
 Week 24 has delivered a noticeably softer picture for the UK property market.
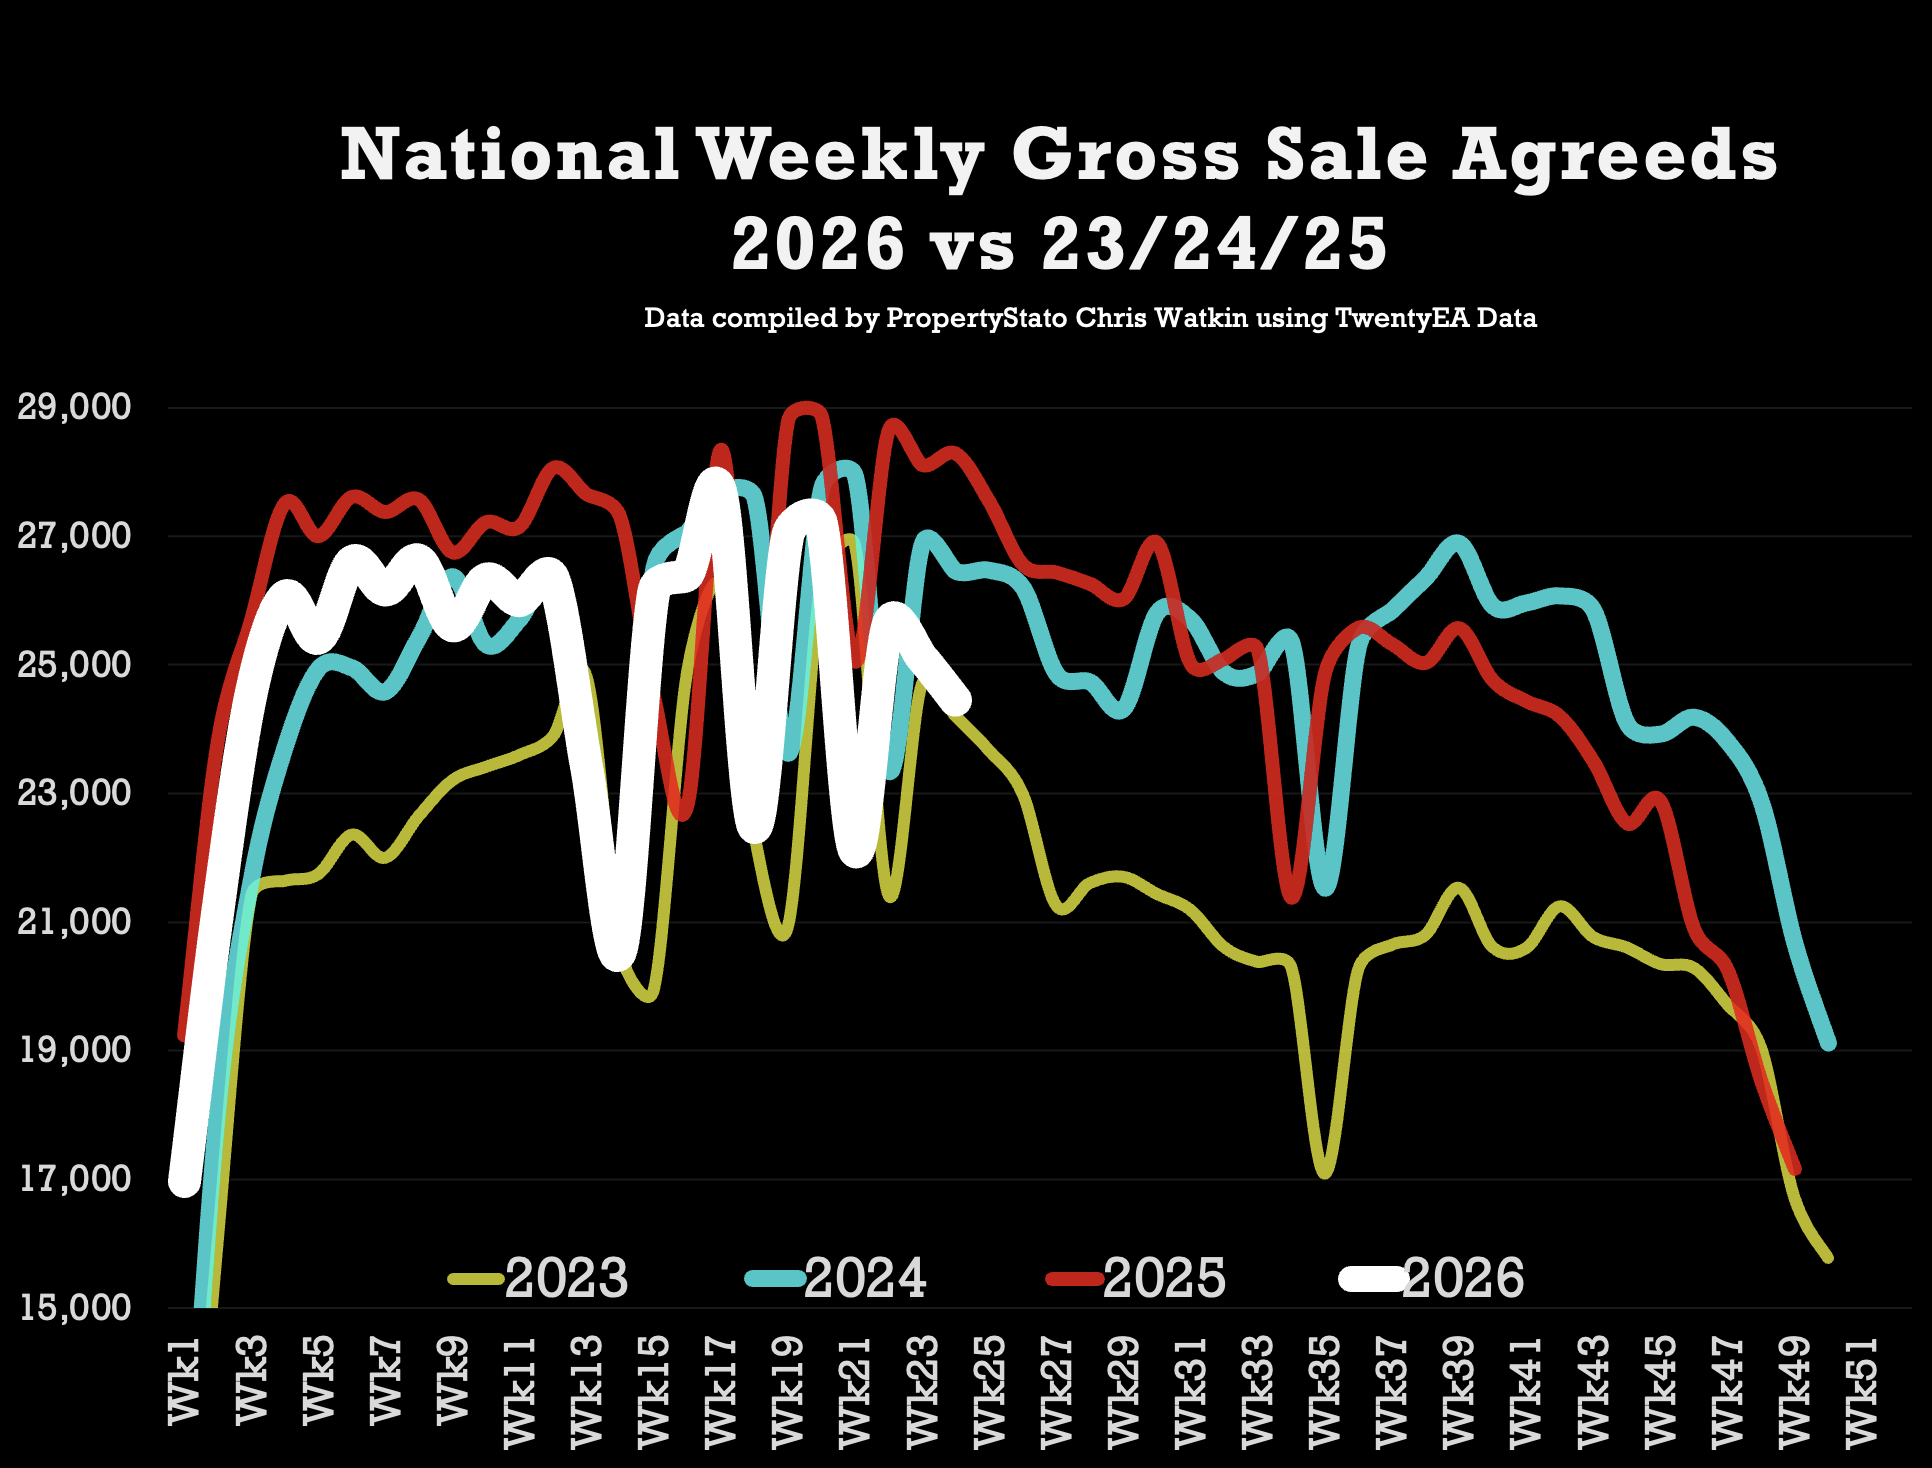
Across the first three full weeks of June 2026, 75k UK homes were sold subject to contract, down 10.39% on the same period in 2025.
That represents 7.8k fewer sales agreed than the 82.8k recorded during the first three full weeks of June last year.
With every UK region reporting a decline (full breakdown of the regions below), it would be wrong to pretend that the market has not become more challenging.
Yet the comparison needs context. The first 3 weeks of June in 2024, 77.8k homes went sold STC, down by a more modest 2.8k sales, or just 3.8%. Also, when compared with 2023, the picture is stronger. Just 70.2k homes were sold STC during the equivalent period that year, meaning 2026 is ahead by 4.8k sales, an increase of 6.45%.
So, UK home sales have undoubtedly lost momentum compared with an unusually strong June 2025.
However, this is not a market that has stopped. It is a market operating below last year’s peak, broadly alongside 2024, and still comfortably ahead of 2023. Regional Breakdown below
Detailed breakdown of the main stats
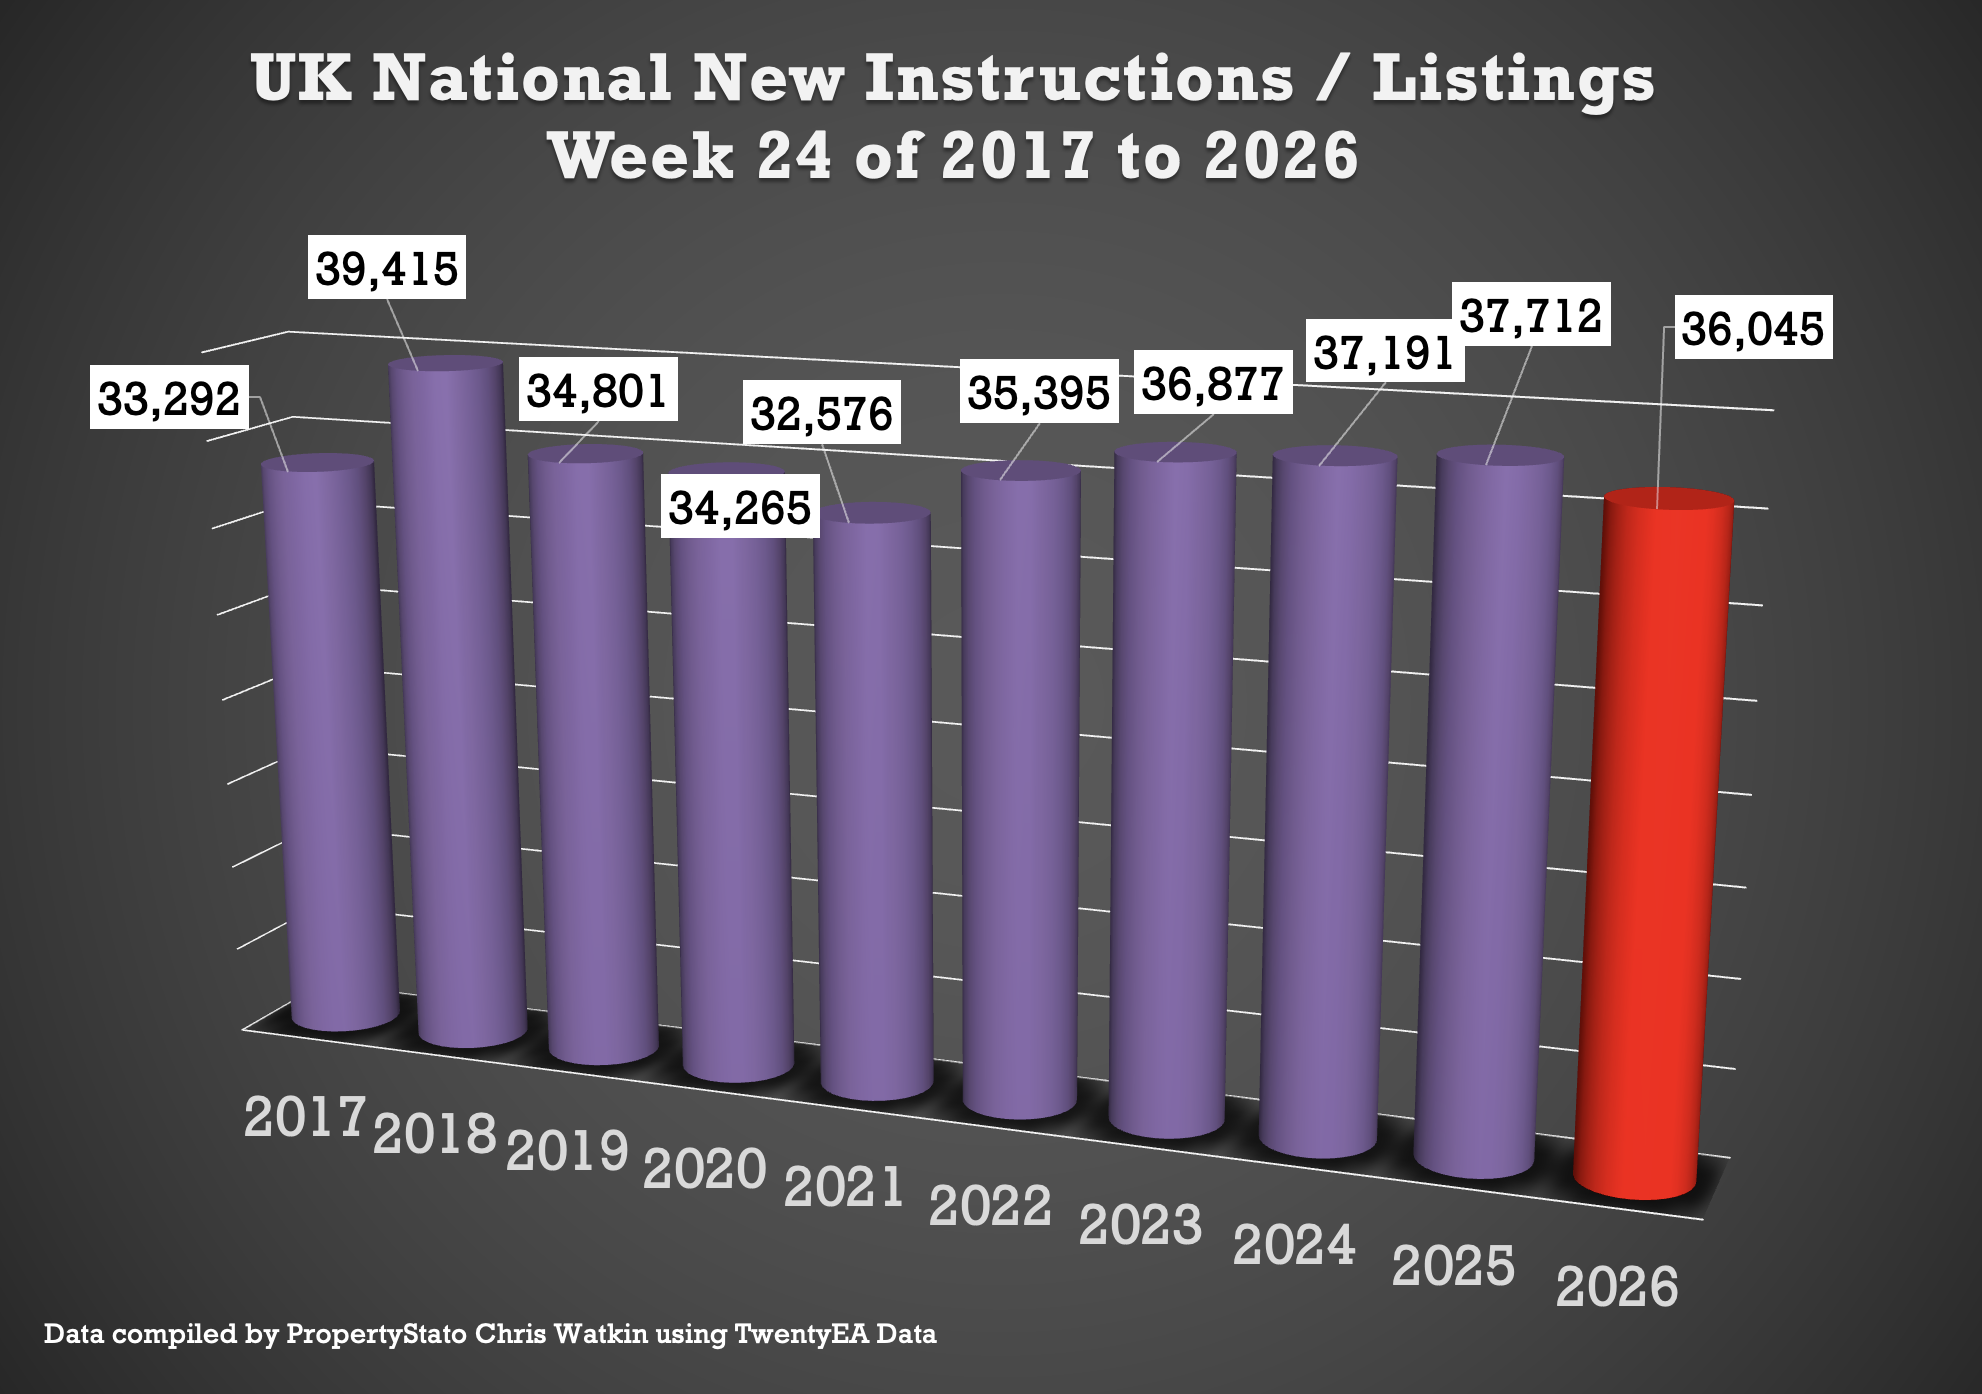
🟩 Listings
Week 24 ..
36k new listings this week, (36.5k last week).
Weekly 2026 average : 37.3k.
10 year week 24 average : 35.7k
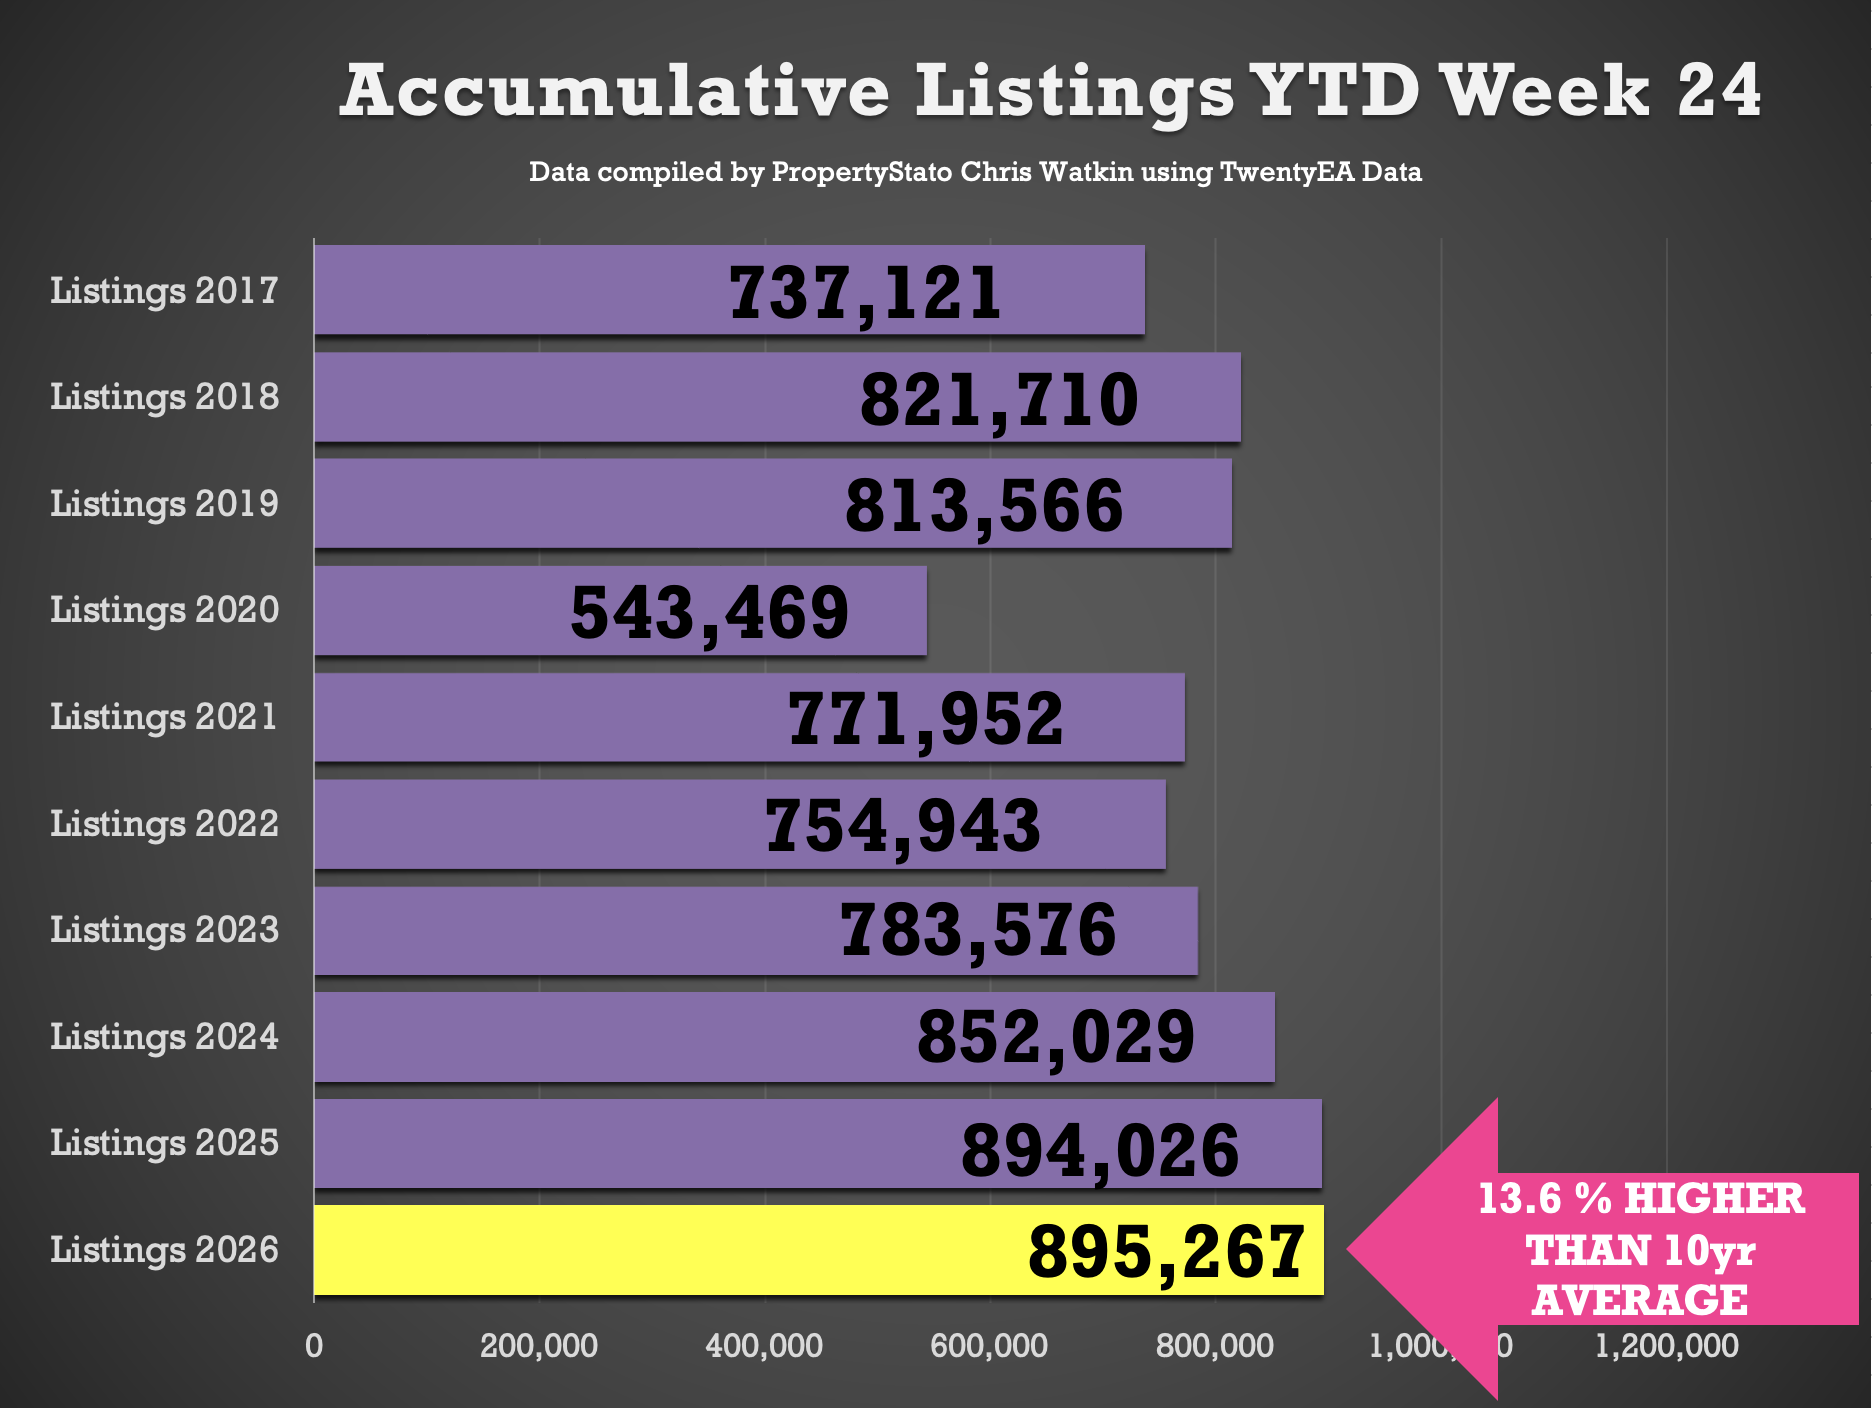
Year to Date
895k new listings YTD
0.1% ahead of 2025 YTD (894k)
5.1% ahead of 2024 YTD (852k)
13.6% higher than the 2017–19 average YTD (787k).
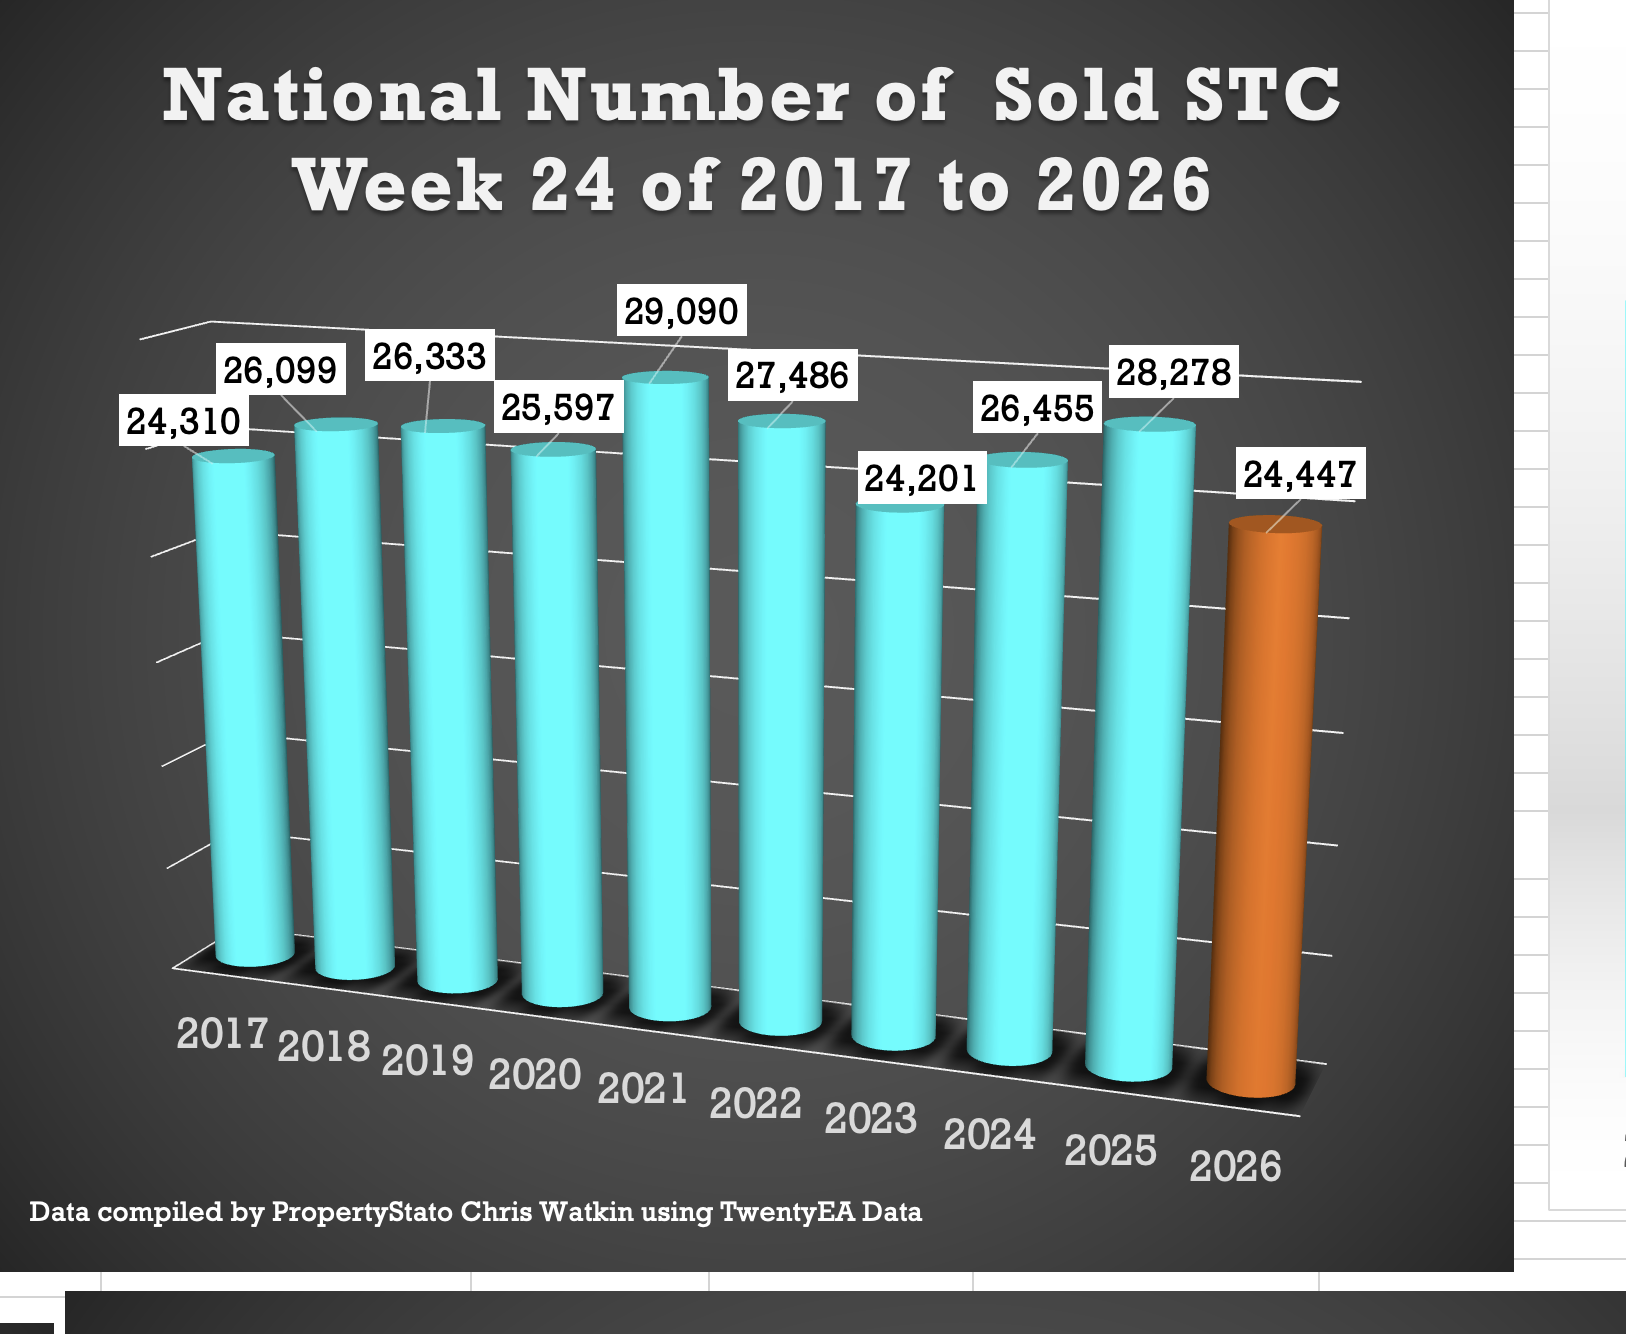
🟩 UK Gross Resi Sales
Week 24 ..
24.4k homes sold stc this week 24 (25.1k last week)
10 year week 23 average : 26.2k
2026 weekly average : 24.8k.
Year to Date for house sales
596k UK homes sold stc YTD
6.4% lower than 2025 YTD (636k)
Yet still Gross Sales are still …
1.3% higher than 2024 YTD (588k)
11.4% higher than 2023 YTD (535k)
8.4% higher above pre Covid 2017-19 years (550k).
🟩 June Regional month to date Breakdown
The first 3 complete weeks of June – Gross Sales MTD
The regional picture is as follows:
- National: down 10.39%
- East Midlands: down 9.66%
- East of England: down 7.73%
- Inner London: down 12.74%
- North East: down 6.99%
- North West: down 11.49%
- Outer London: down 13.13%
- Scotland: down 5.89%
- South East: down 7.38%
- South West: down 8.55%
- Wales: down 7.20%
- West Midlands: down 9.58%
- Yorkshire and Humber: down 5.44%. Graph 12a
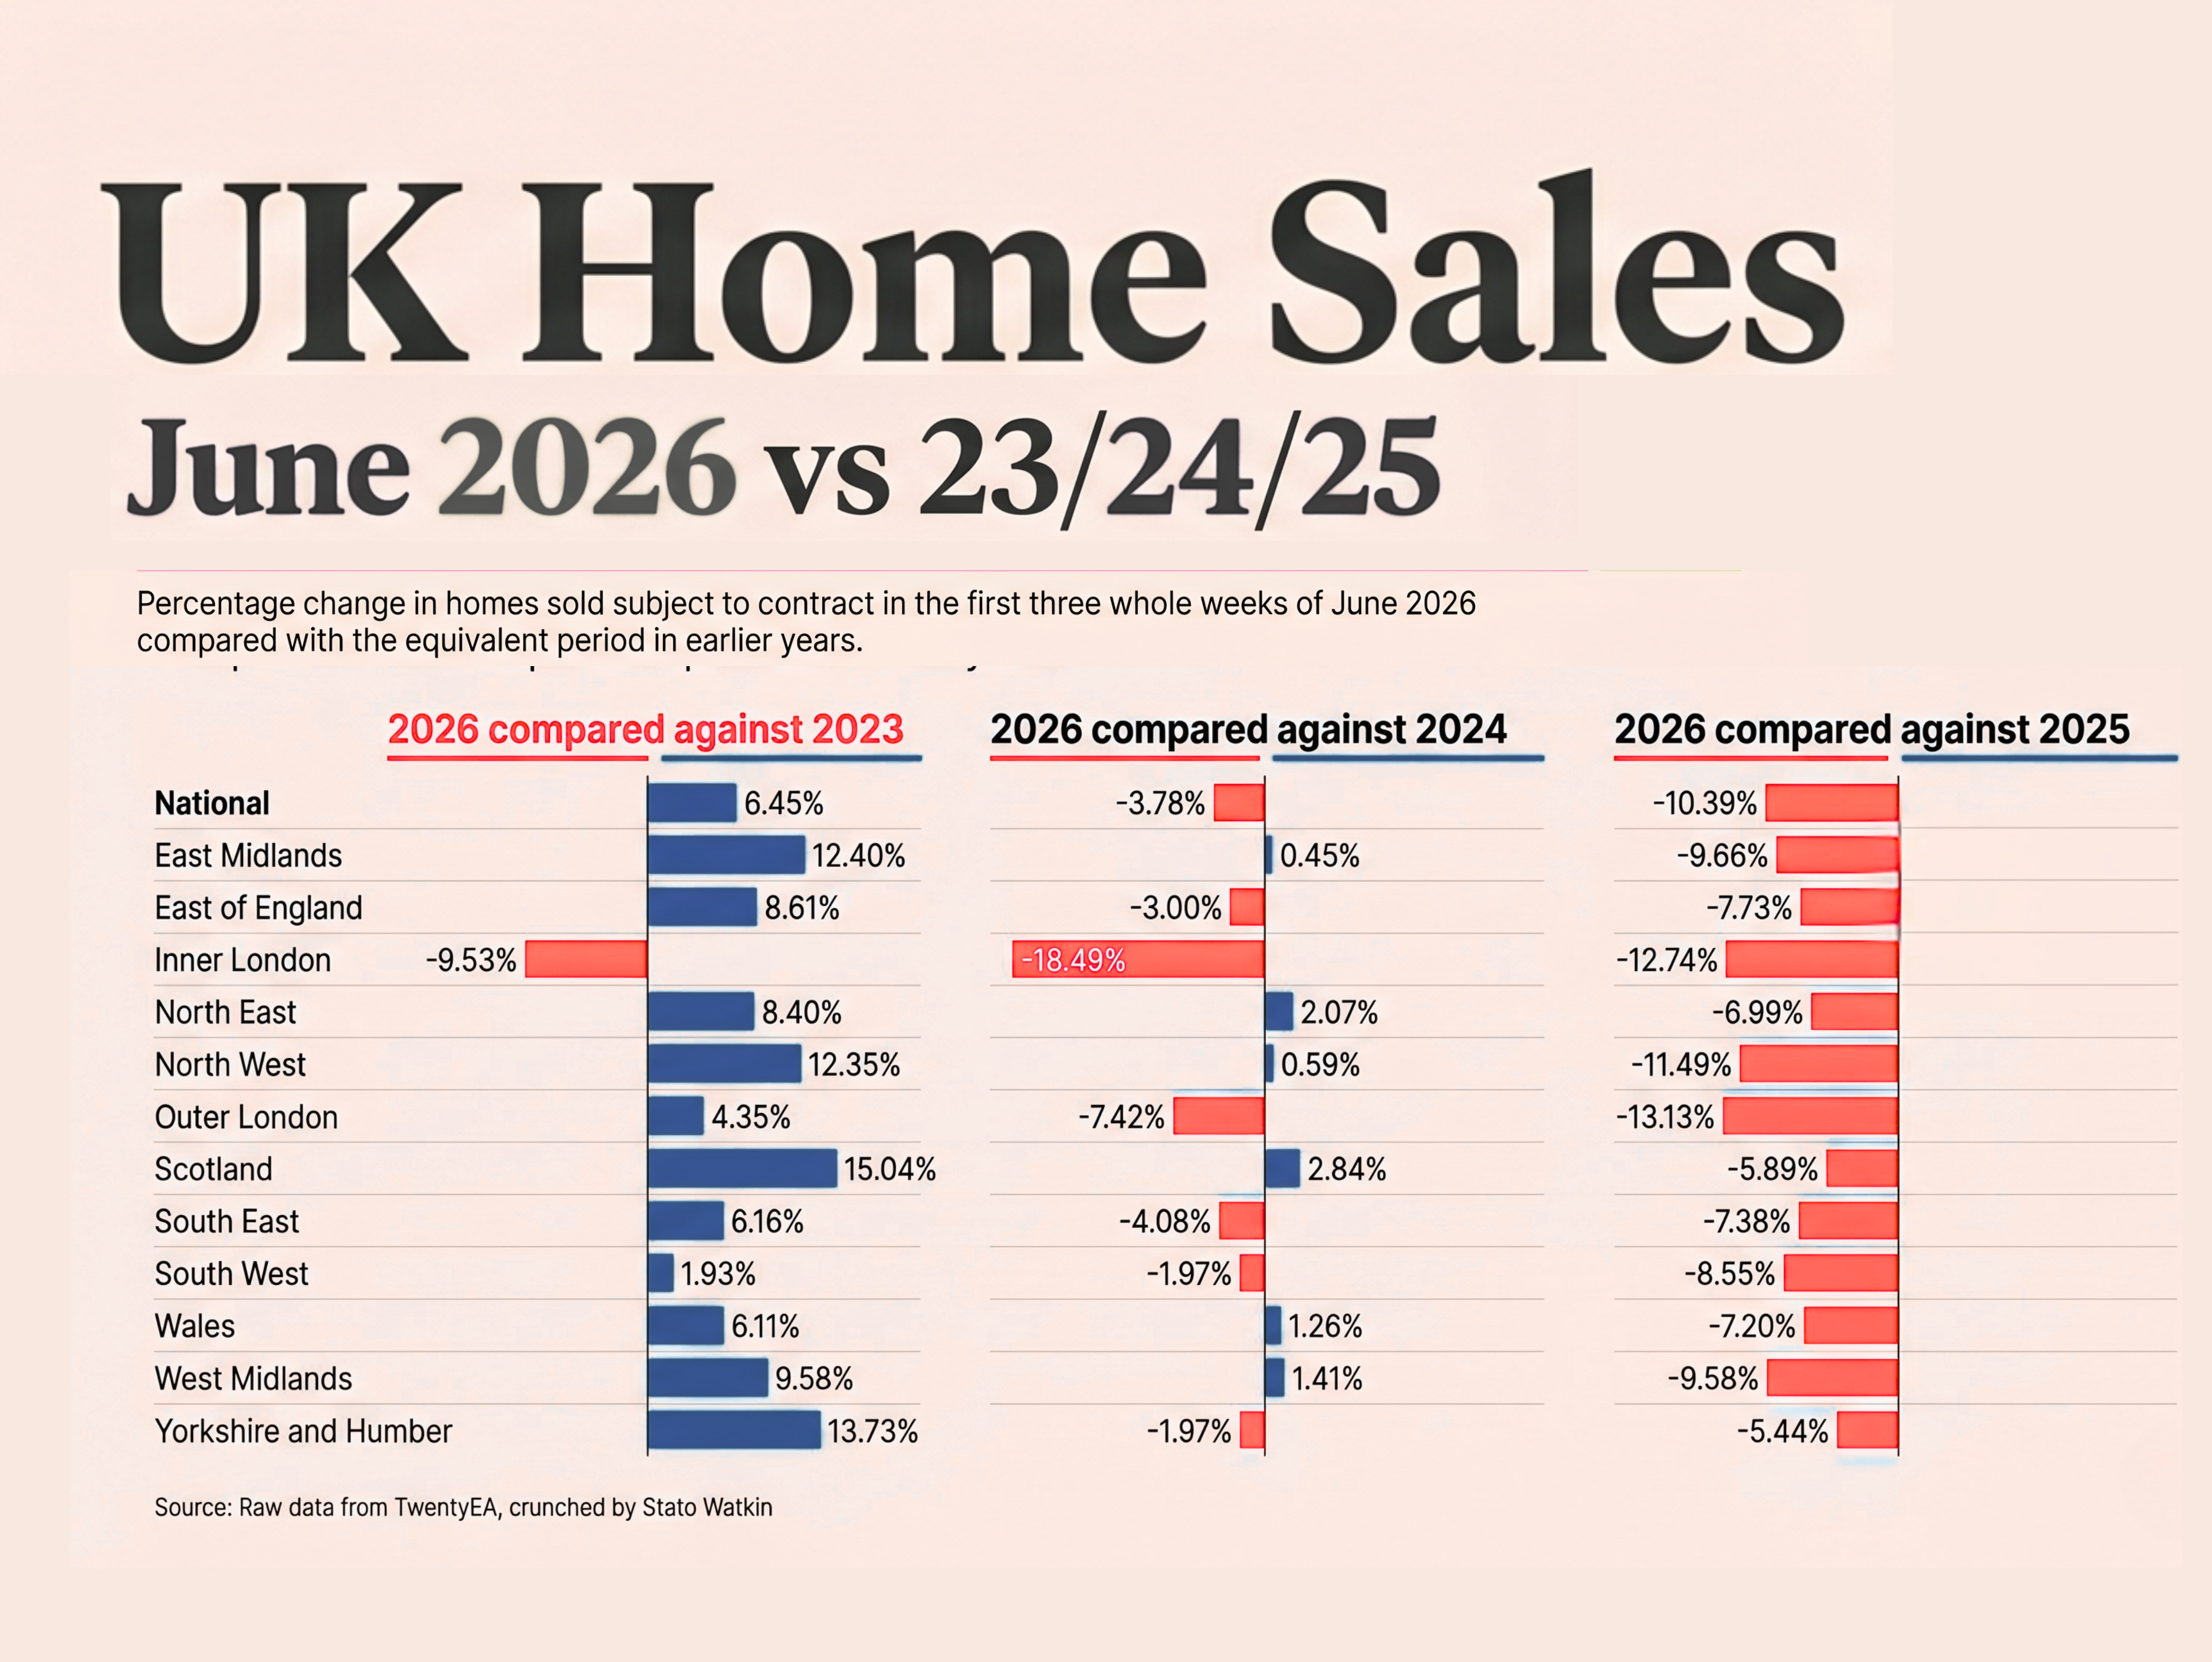
Outer London recorded the sharpest fall, followed by Inner London and the North West. Scotland and Yorkshire and Humber proved the most resilient, although both were still below last year.
The message is simple. This is a tougher market than June 2025, but it is not a dead one. Homes are still selling. The difference is that buyers have more choice, less urgency and far less tolerance for overpricing.
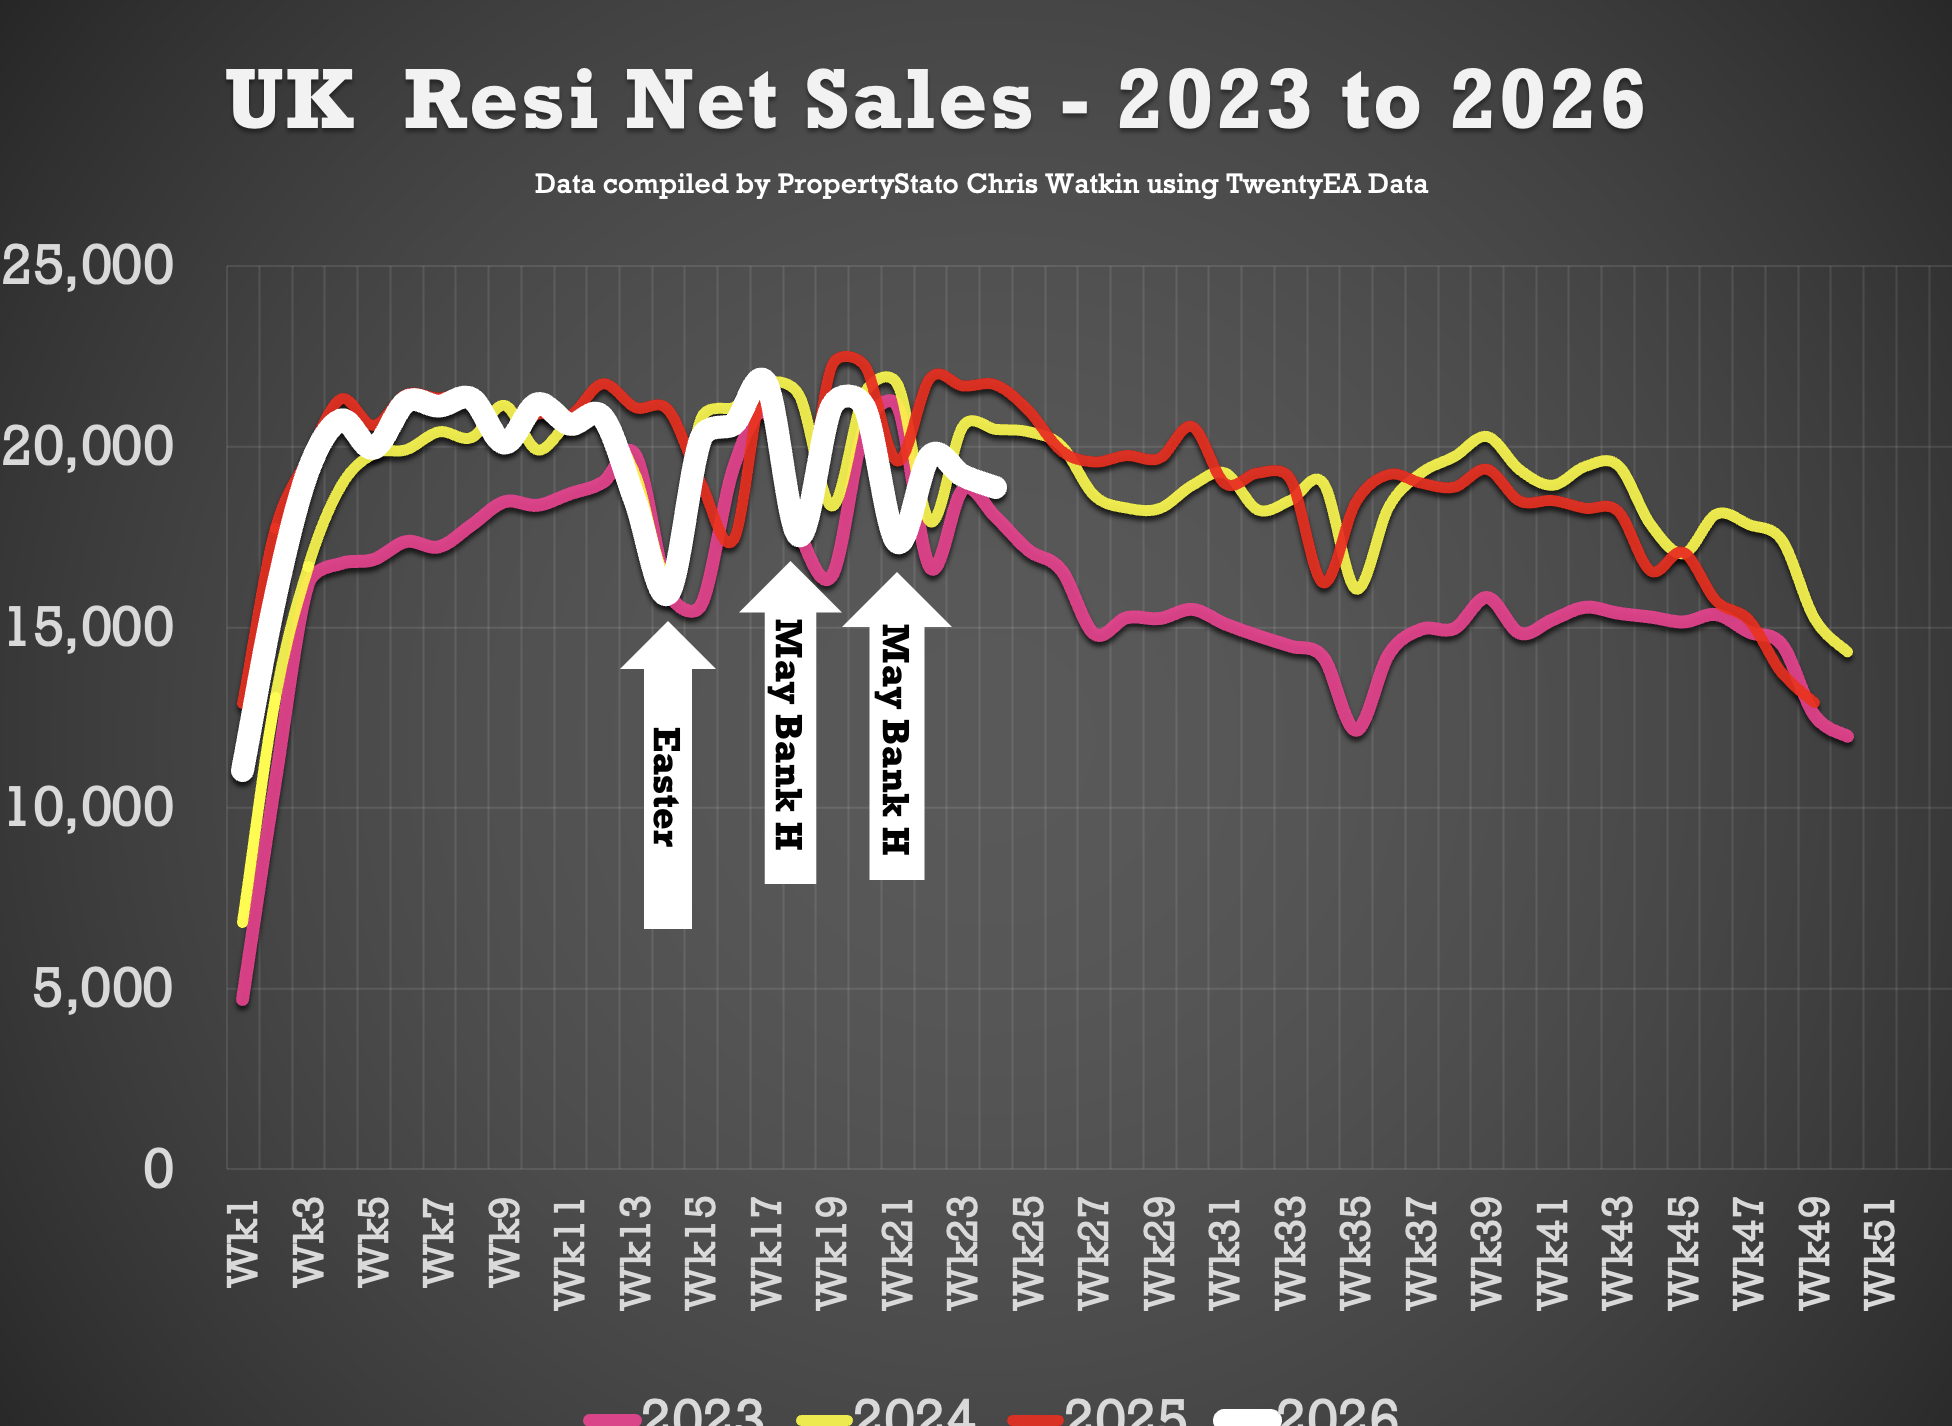
🟩 UK Net Resi Sales YTD
(Net Sales being Gross Sales less Sale Fall Thrus).
Week 24
18.9k Net Sales (19.2k last week)
10 year Week 23 average: 20.3k.
Weekly average for 2026: 19.4k.
Year to Date
464k UK net home sales YTD
4.7% lower than 2025 (488k),
1.1% ahead of 2024 (460k),
12.6% ahead of 2023 (413k)
6% above the 2017–19 average (439k).
🟩 Exchanges
• May 2026 – 76.8k Exchanges … note this figure will increase throughout June as more May exchanges come thru the system
• 365k UK Exchanges YTD to end of May 2026. 5.5% lower than Jan to May 2025, when it was 386k. NB. There were more exchanges in Q1 2025 because of the stamp duty holiday which finished in April 2025.
Additional info …
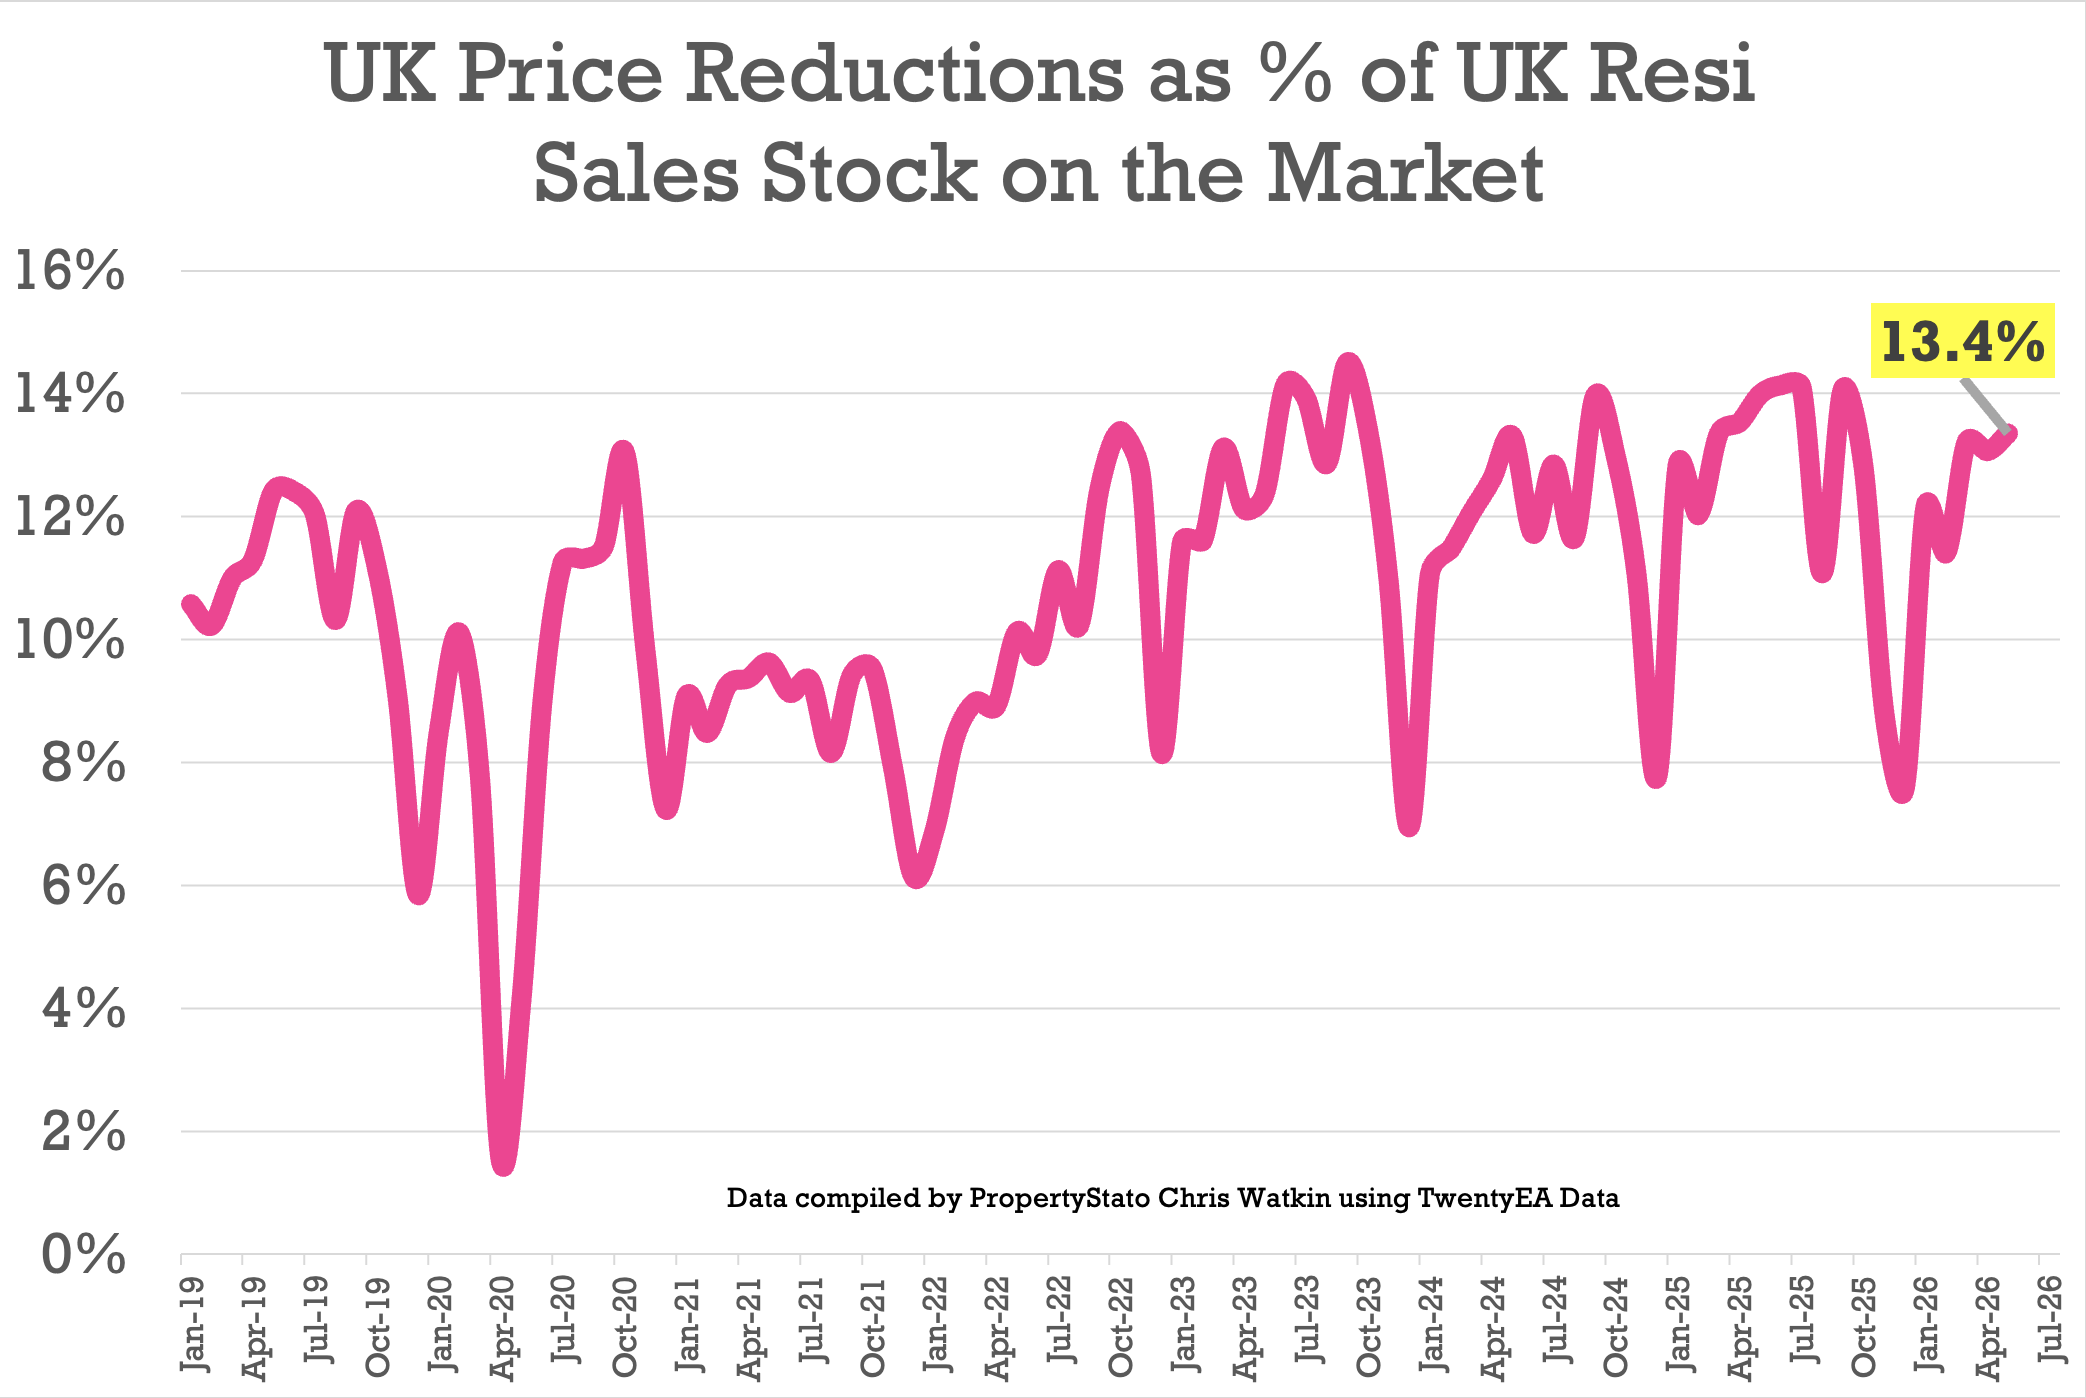
🟥 Price Reductions
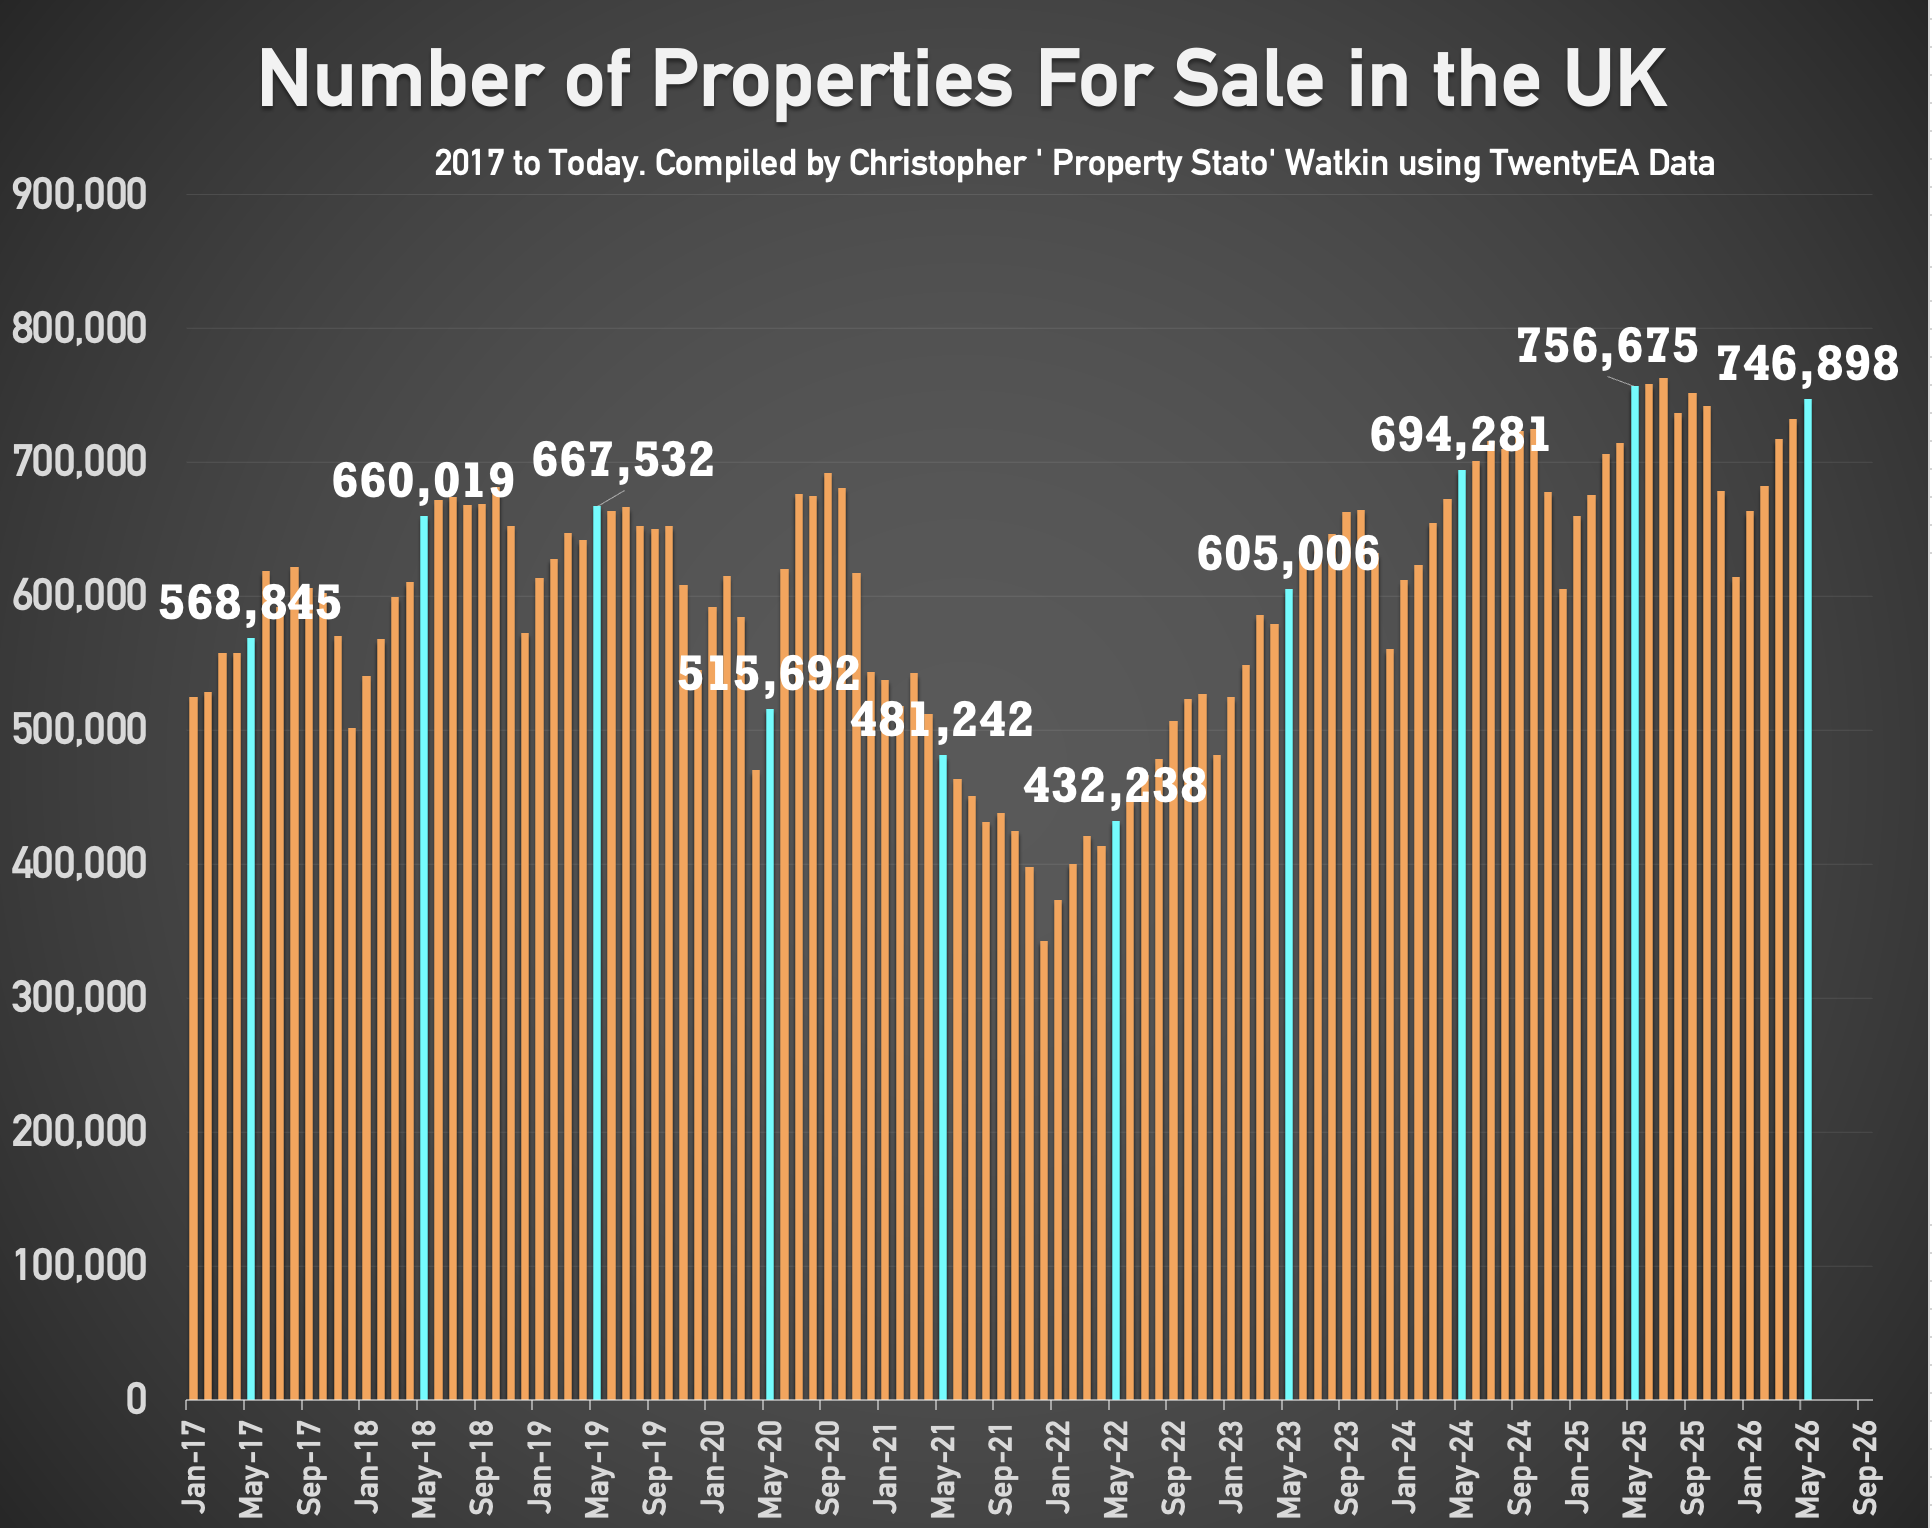
• 25.9k reductions this week on a 747k UK homes for sale
• 13.4% of UK homes for sale were reduced in May.
• 2025 average 12.8%, versus the 6-year long-term average of 10.7%.
🟥 Withdrawals
• May 2026 – 64k Withdrawals – again, this figure will increase as more May withdrawals come thru the system throughout June
• That means that 45.2% of all homes that left UK Estate Agent books in May went unsold.
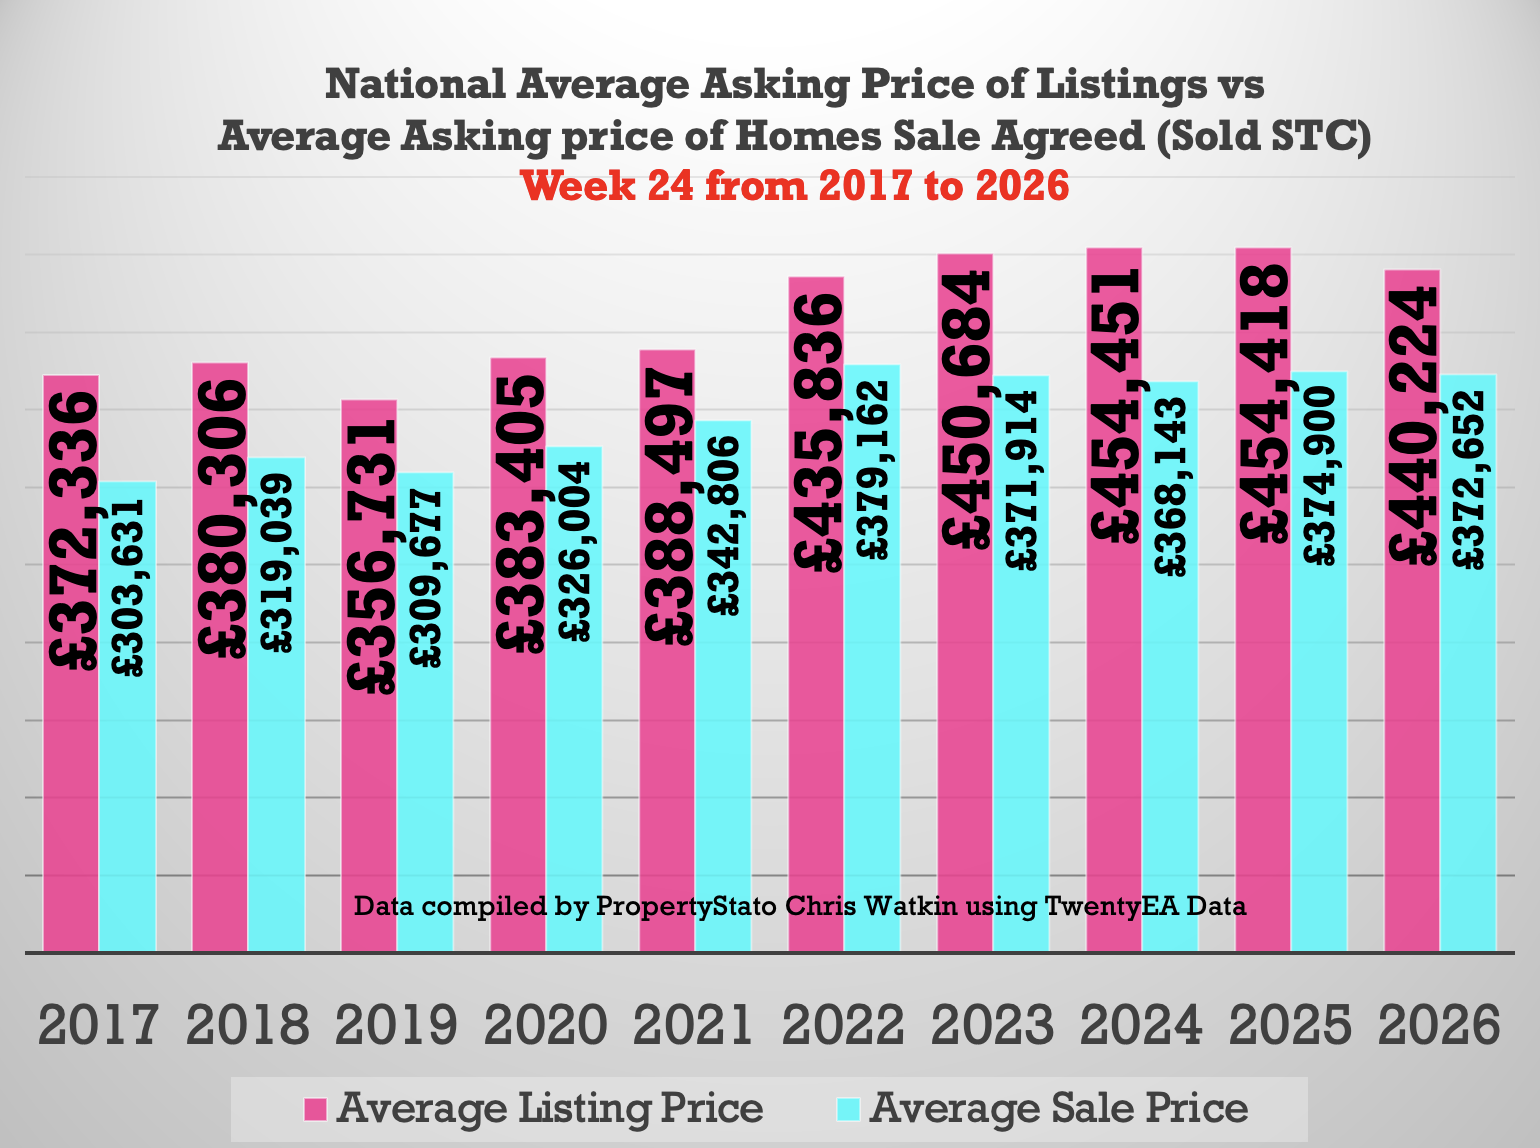
🟥 Price Difference between Asking Price of Listings & Asking Price of those Homes that go Sold stc
• 18.1% difference (long term 10 year average is 16% to 17%). (£440k ave Listing Ave Asking price vs £373k Sale Agreed ave Asking price).
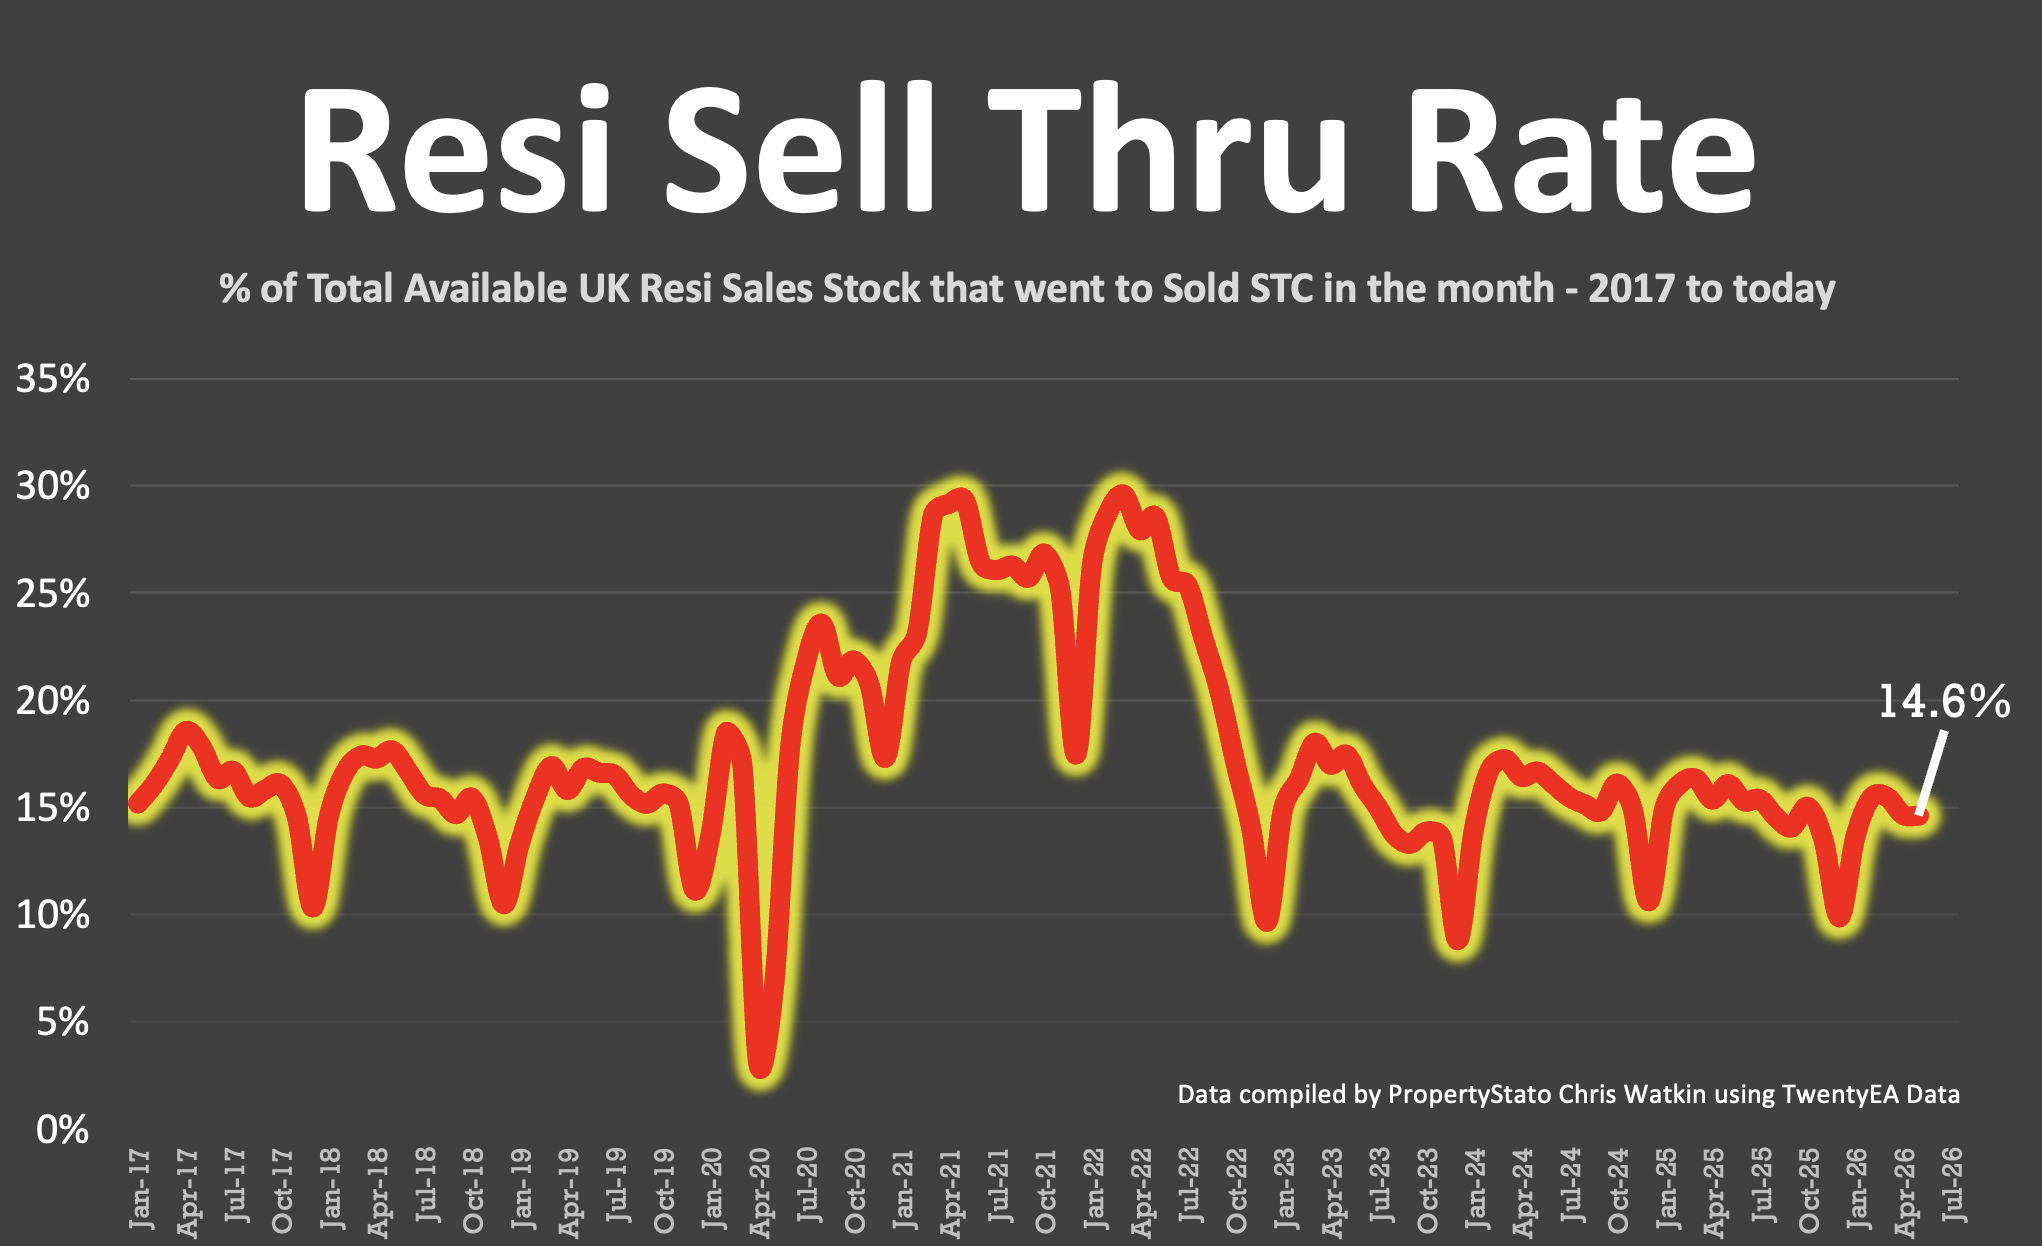
🟥 Sell-Through Rate
• 14.6% of homes on agents’ books went SSTC in May ’26.
• Pre-Covid average: 15.5%.
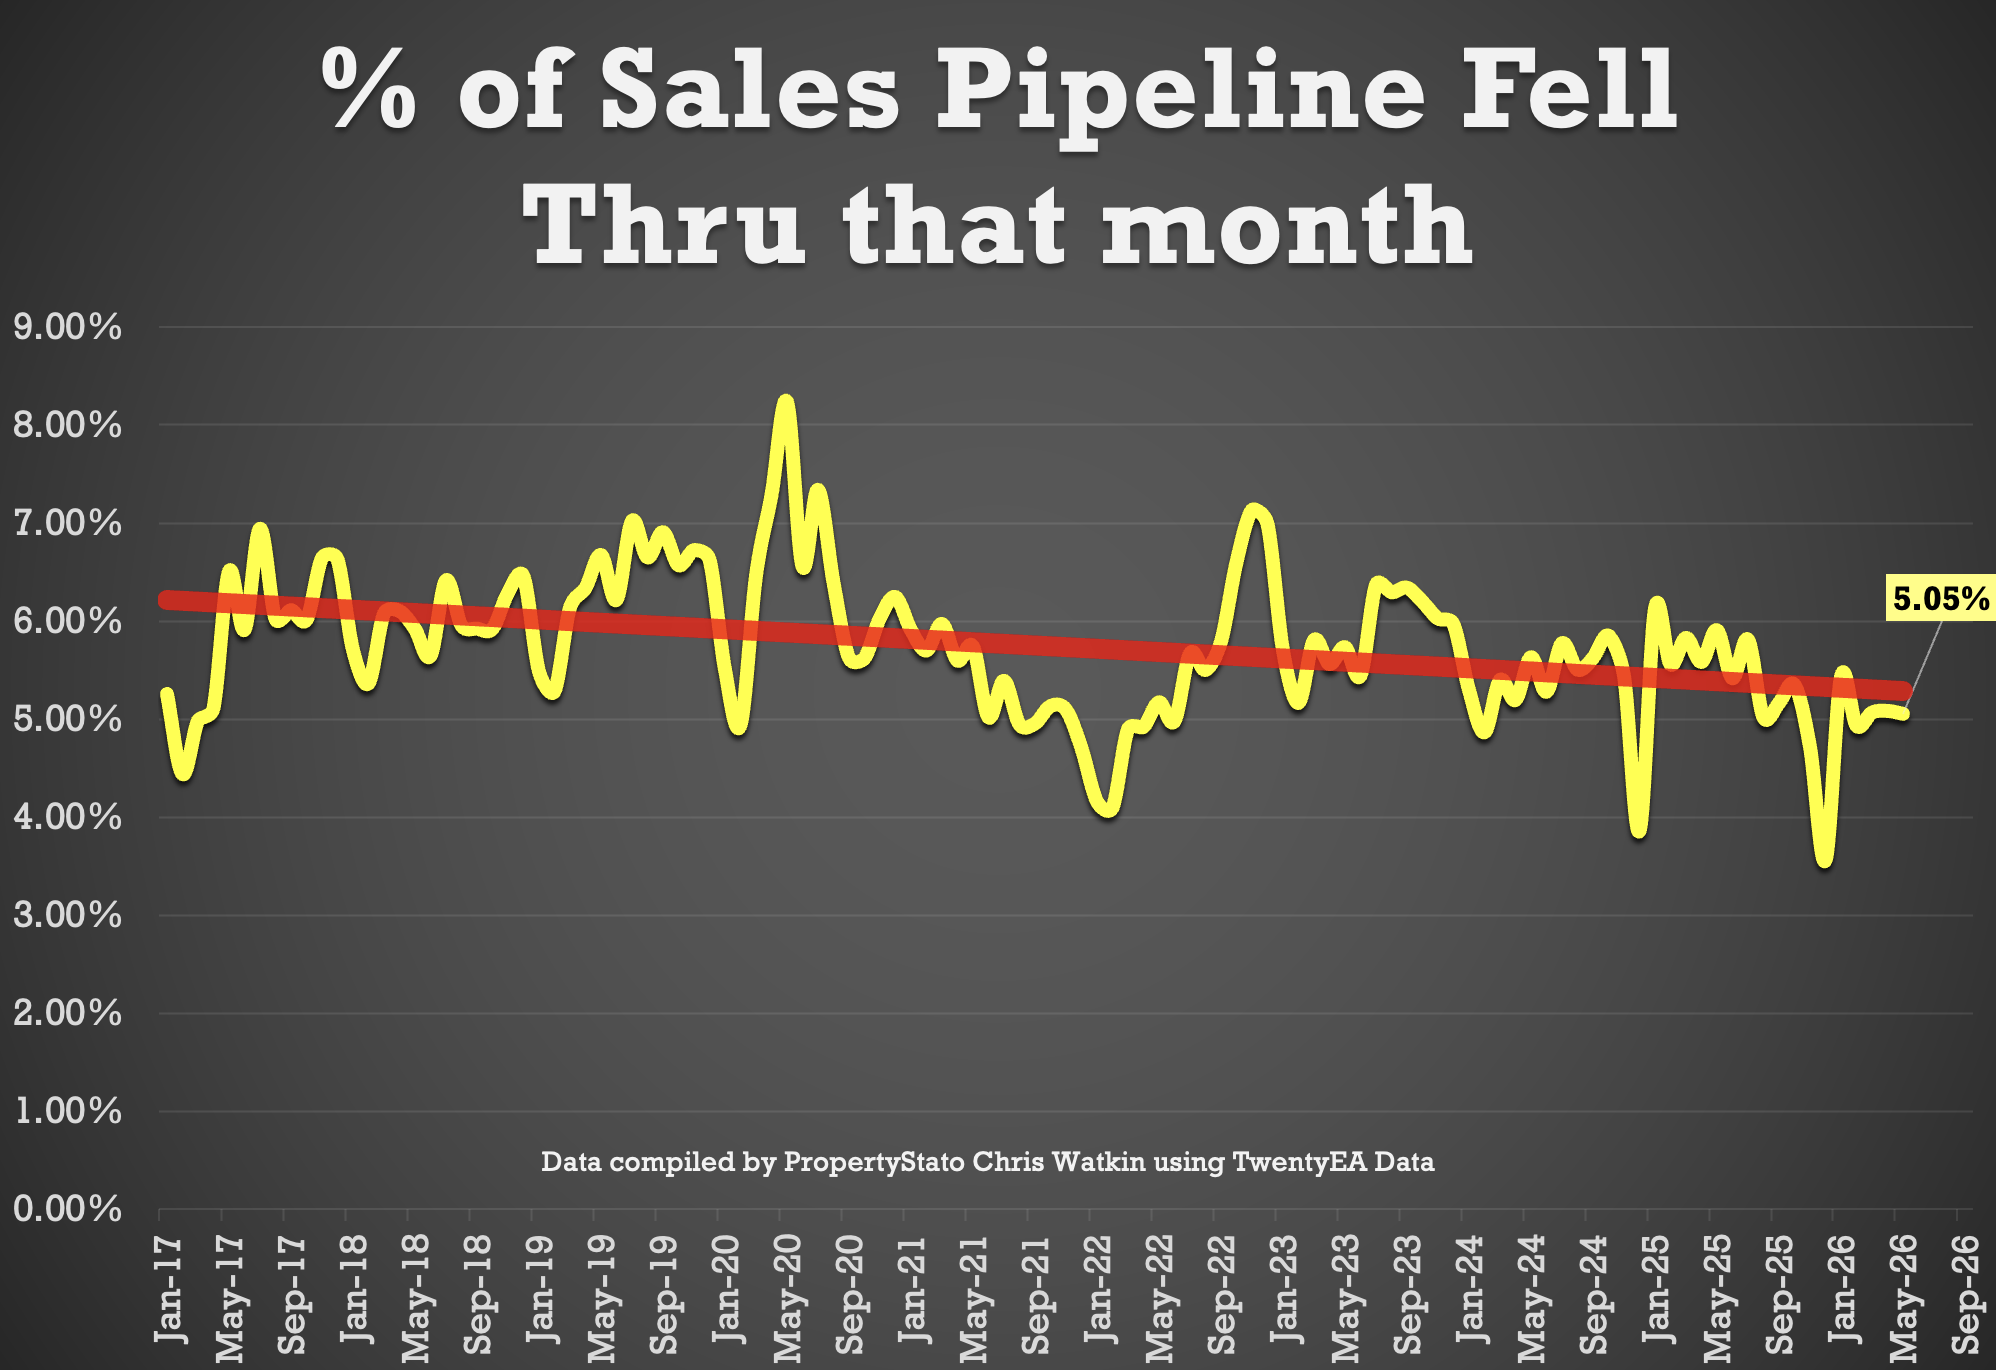
🟥 Sale Fall-Thrus
• Fall-thru rate 22.8%
• Decade average: 24.5%
• 5.05% of homes sold STC fell thru in May 2026, below both the 2025 average of 5.3% and the 10 year average of 5.8%. (May figures to follow next week).
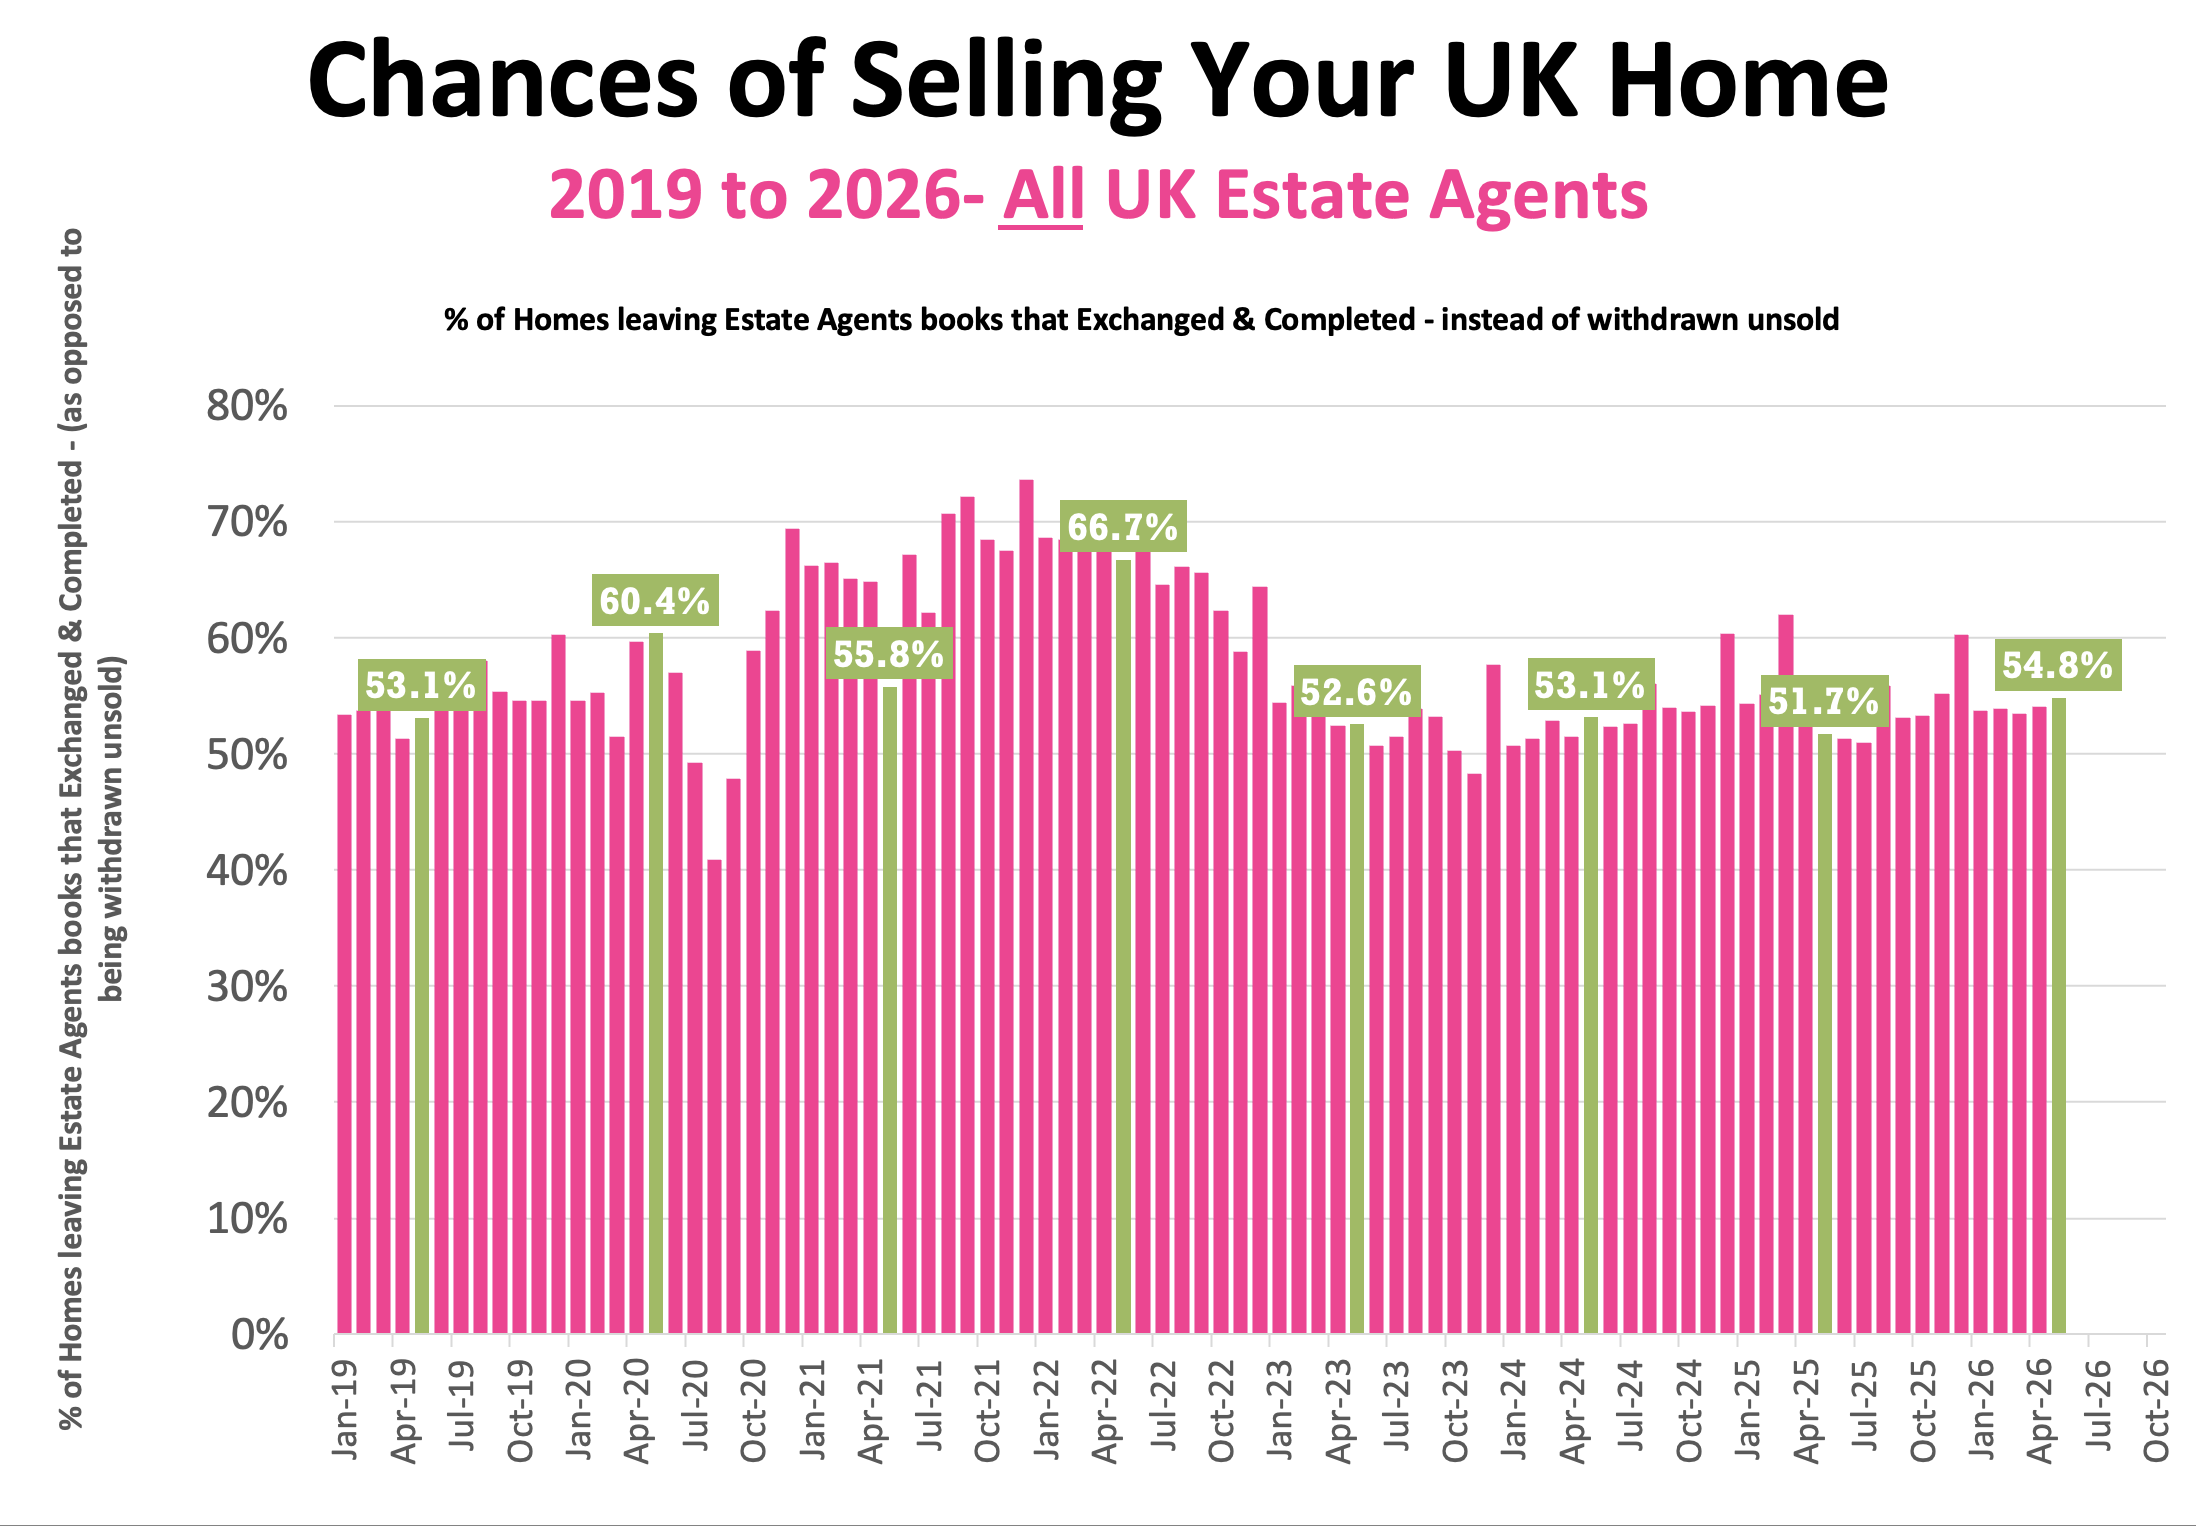
🟥 Probability of Selling (% that Exchange vs withdrawal)
• May 2026 Stats : 54.8% of homes that left agents’ books exchanged & completed in May. (Note this figure will change throughout the month as more May stats come in).
• 57.6% is the 7 year average (which includes the crazy years post lockdown 18 months).
🟥 Stock Levels
• 747k homes on the market on the 1st of June ’26.
• 472k homes in agent’s sales pipeline on the 1st June 2026, slightly lower than 12 months ago on 1st June ’25 (474k).
🟥 House Prices (£/sq.ft)
• May ’26 agreed sales averaged £349.64 per sq.ft. 1.9% higher than 12 months ago (£342.87) and 13.2% than 5 years ago (£308.94). The £/sqft at sale agreed matches the HM Land Registry Index with a 98% accuracy, 5 months in advance. That is why it is so important.
🟥 UK Rental Data
• Average Rent in Wk 24 – £1,817 pcm
• Average Rent in May 2026 – £1,785 pcm (£1,779 in May 25)
• Average Rent in YTD 2026 – £1,747 pcm
• 305k UK Rental Stock available to rent in May 26 (311k in May 2025).
🟥 Local Focus this week in the Show
Aylesbury
The candour premium: Britain’s rudest estate agent proves honesty pays
Read the orginal article: https://propertyindustryeye.com/no-region-escapes-as-uk-home-sales-fall-sharply/


