This week’s edition of the UK Property Market Stats examines the latest housing market trends across Britain, alongside a detailed look at estate agency performance in one of London’s most competitive markets.
In the latest episode, I am joined by Alice Bullard from Nested to analyse housing market activity for the week ending Sunday 10 May 2026.
The programme then shifts focus to Notting Hill, where we examine which estate and letting agents are performing strongest locally, using transaction data, market share analysis and listing performance.
The discussion also explores how agents can use performance data to defend fee levels and counter competitors relying on overvaluations or discounted fees to win instructions. While the case study focuses on Notting Hill, the analysis is intended to provide wider lessons for agents operating in competitive markets across the UK.
UK Property Market Weekly Update for Week 18 2026
🟩 UK GrossResiSales
444k UK homes sold STC YTD
5.2% lower than 2025 YTD (445k)
2.8% higher than 2024 YTD (468k),
13.8% higher than 2023 YTD (390k)
13.8% higher above pre Covid 2017-19 years (399k).
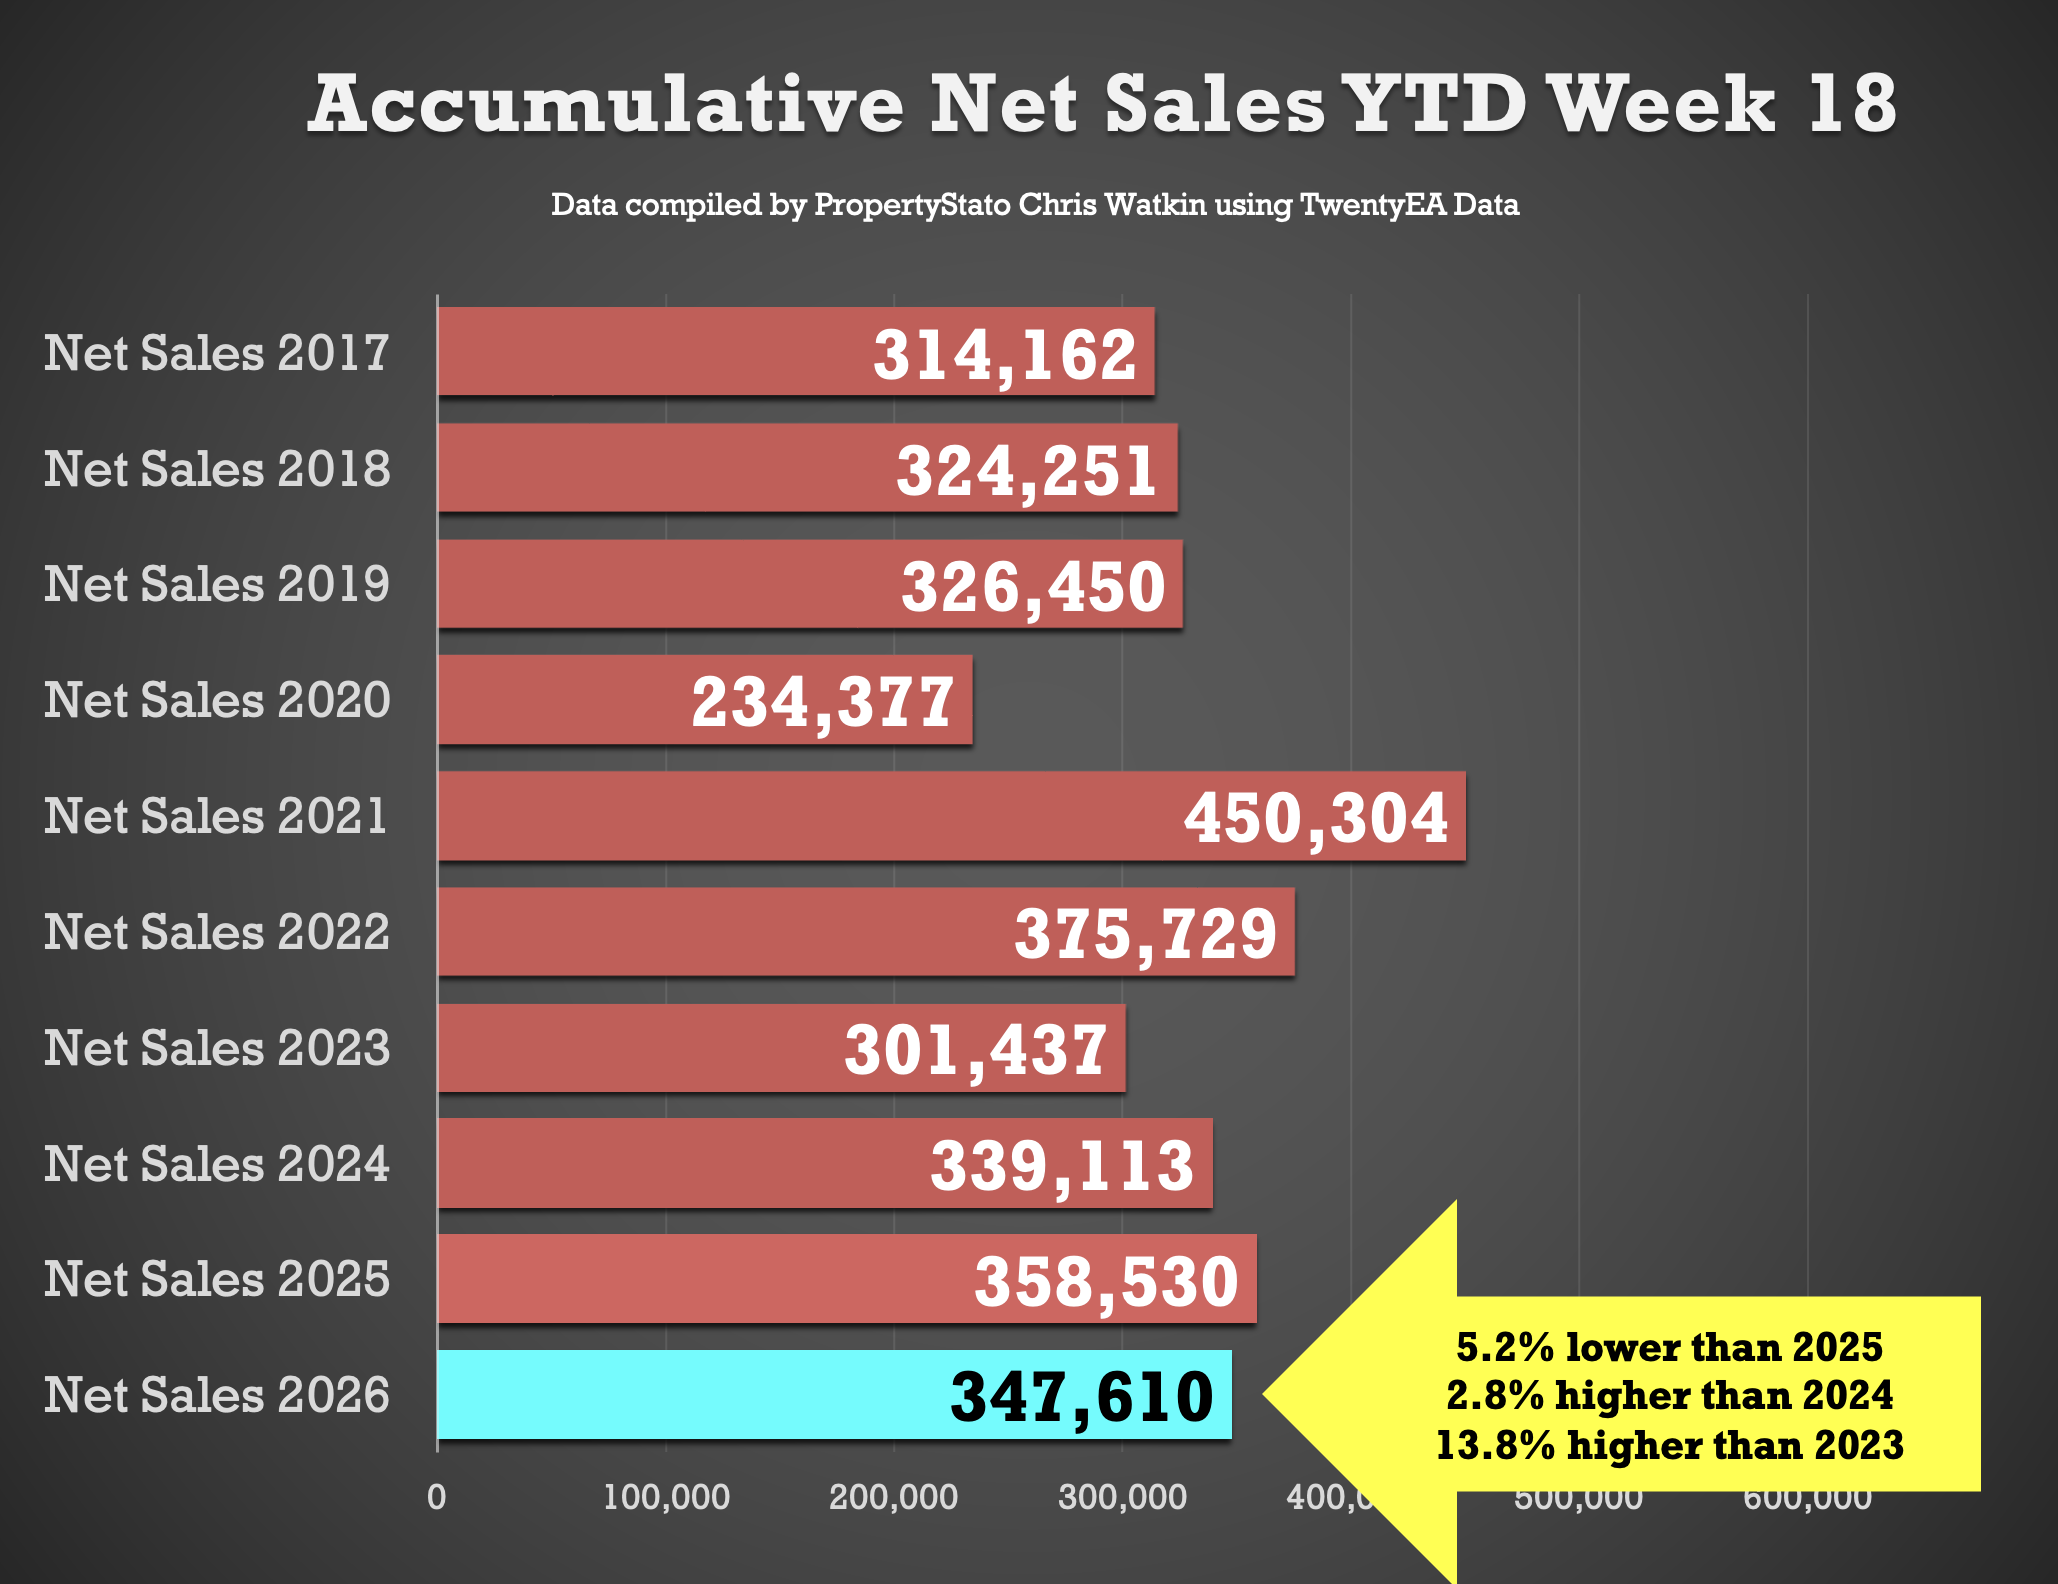
🟩 UKNet Resi Sales YTD
348k UK net home sales YTD
3.1% lower than 2025 (341k),
3.9% ahead of 2024 (318k),
16.3% ahead of 2023 (284k)
9.4% above the 2017–19 average (302k).
(Net Sales being Gross sales less Fall Thrus).
🟩 Listings YTD
671k new properties (listings) have come onto the market YTD
0.9% ahead of 2025 YTD (665k)
5.8% ahead of 2024 YTD (634k)
16.1% higher than the 2017–19 average YTD (577k)
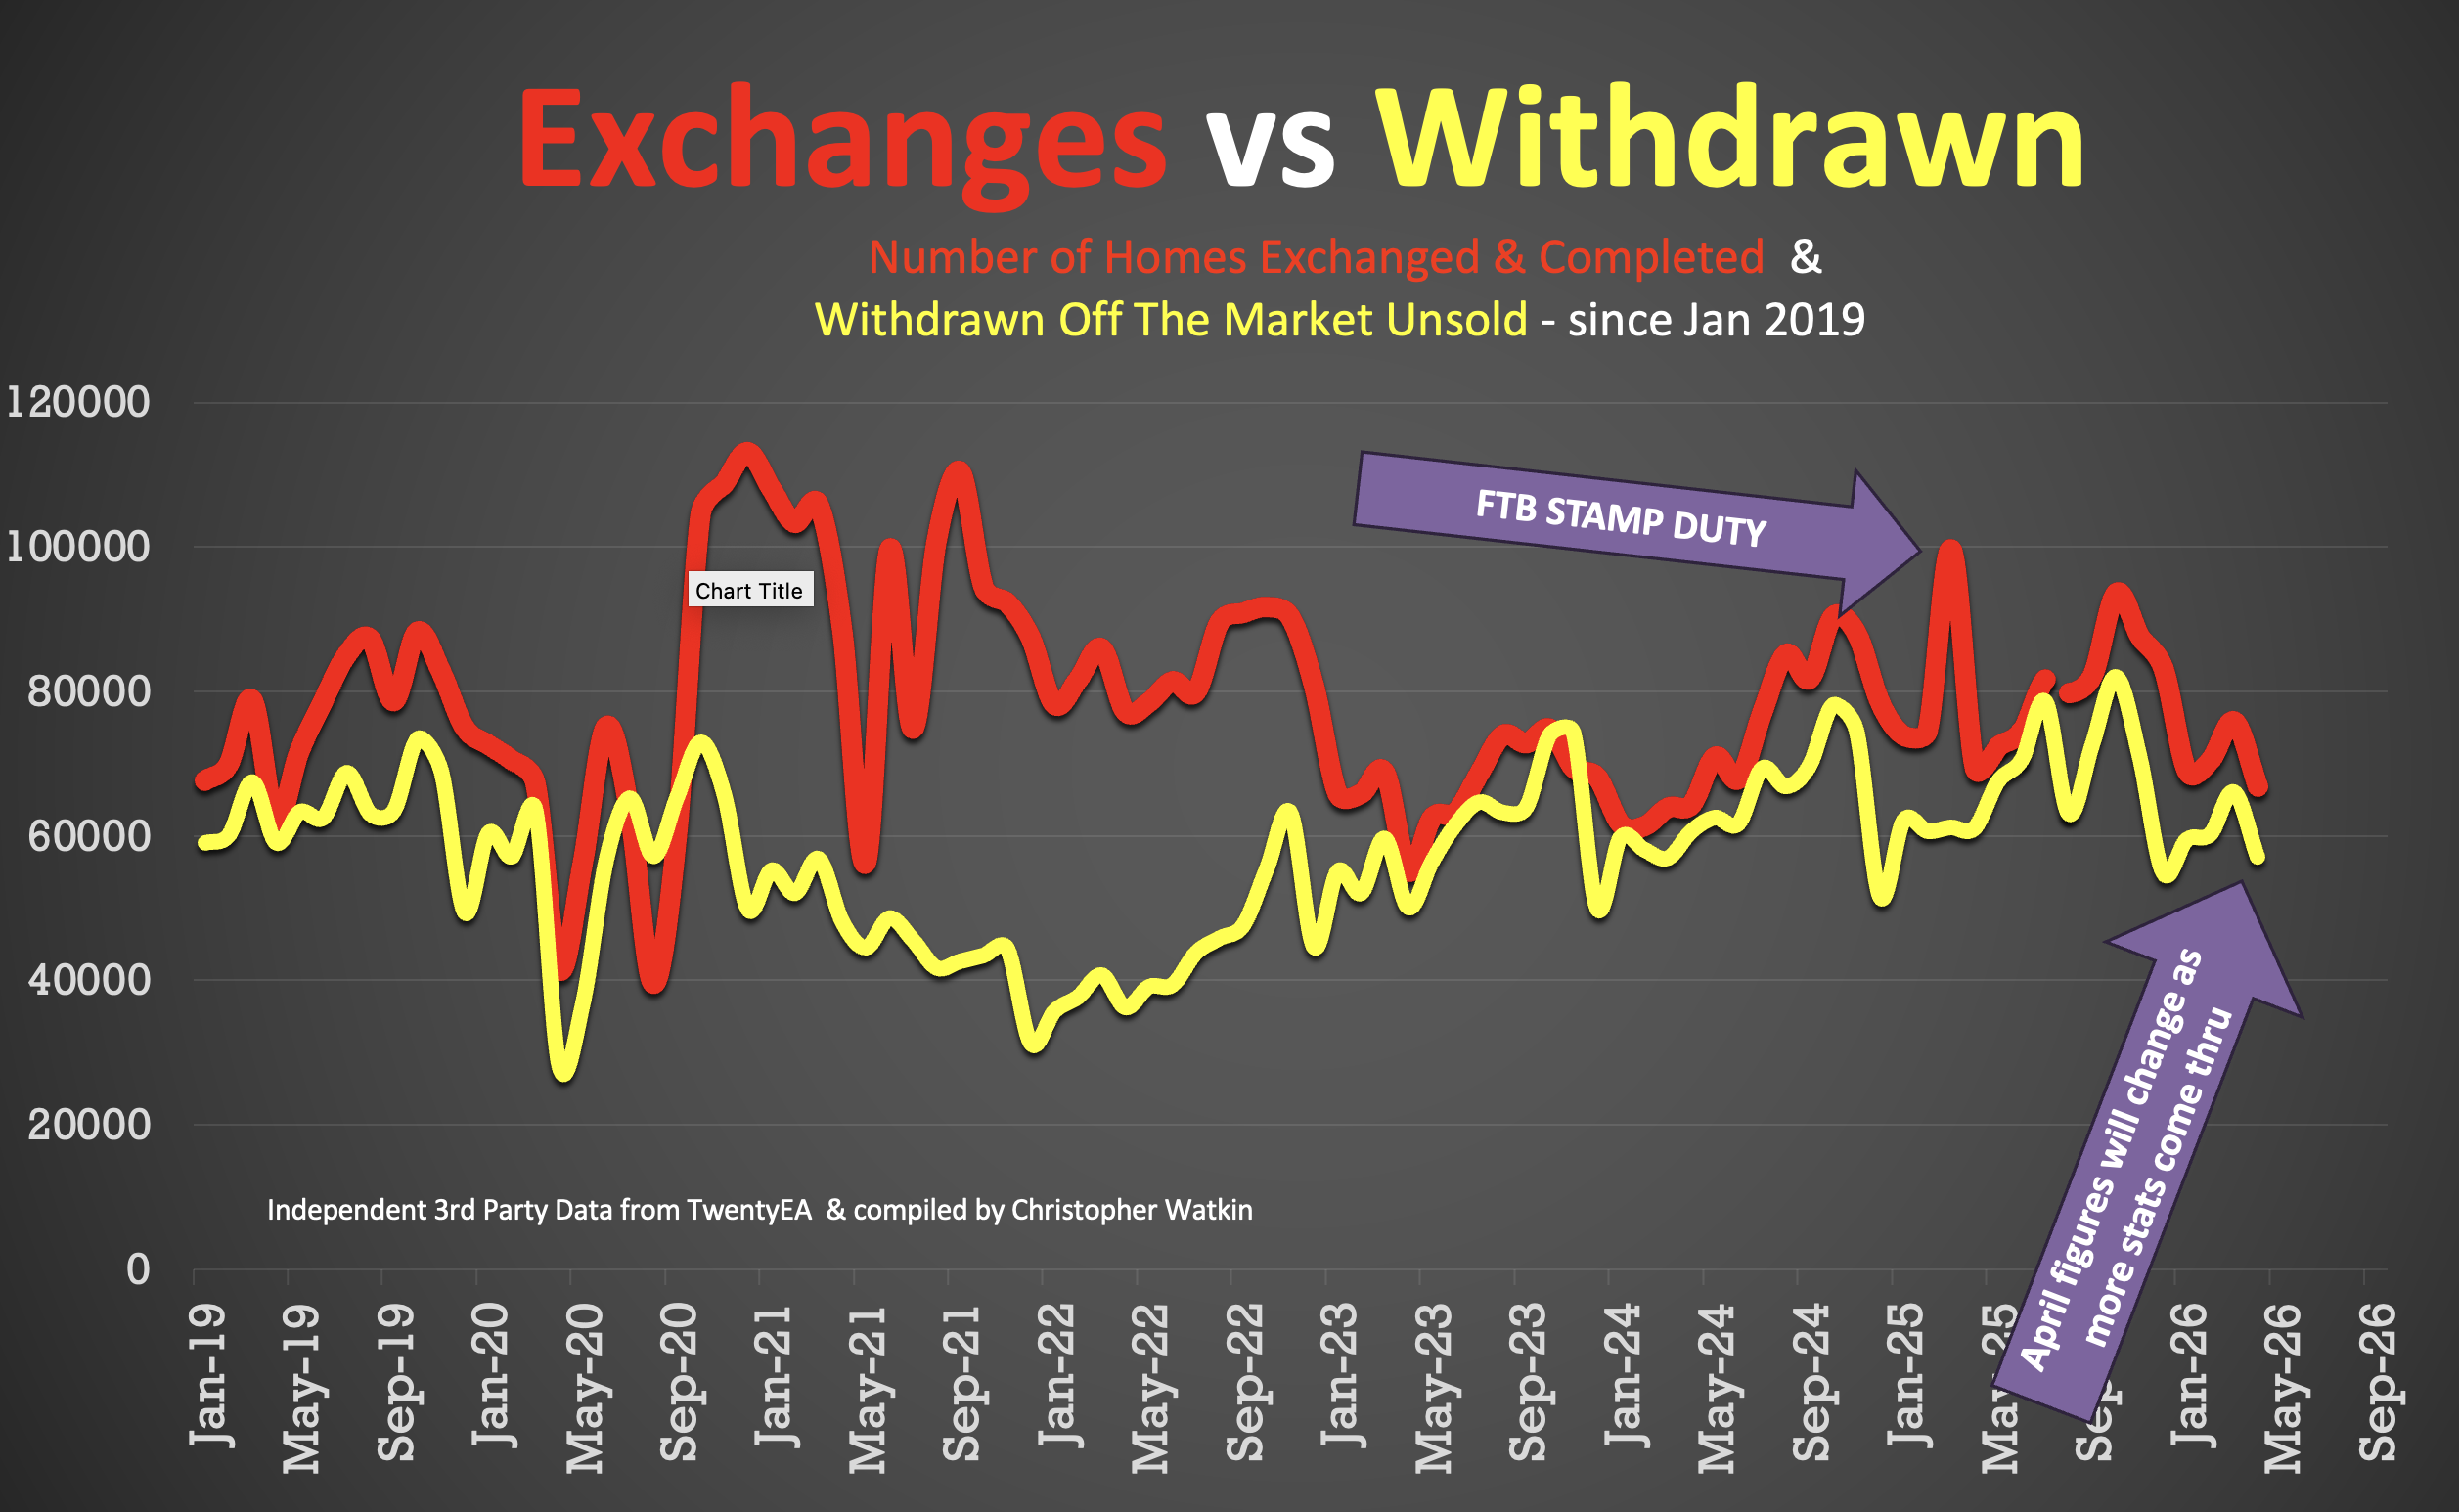
🟩 Exchanges YTD
281k UK Exchanges to the end of April 2026
10.5% lower than Jan to April 2026, when it was 314k.
Note – There were more exchanges in Q1 2025 because of the stamp duty holiday which finished in April 2025
🟩 Overvaluing
46.1% of the homes that left UK Estate Agents books in April were withdrawn unsold.
Main cause – blatant overvaluing supported by long sole agency agreements of 20+ weeks.
Detailed Breakdown …
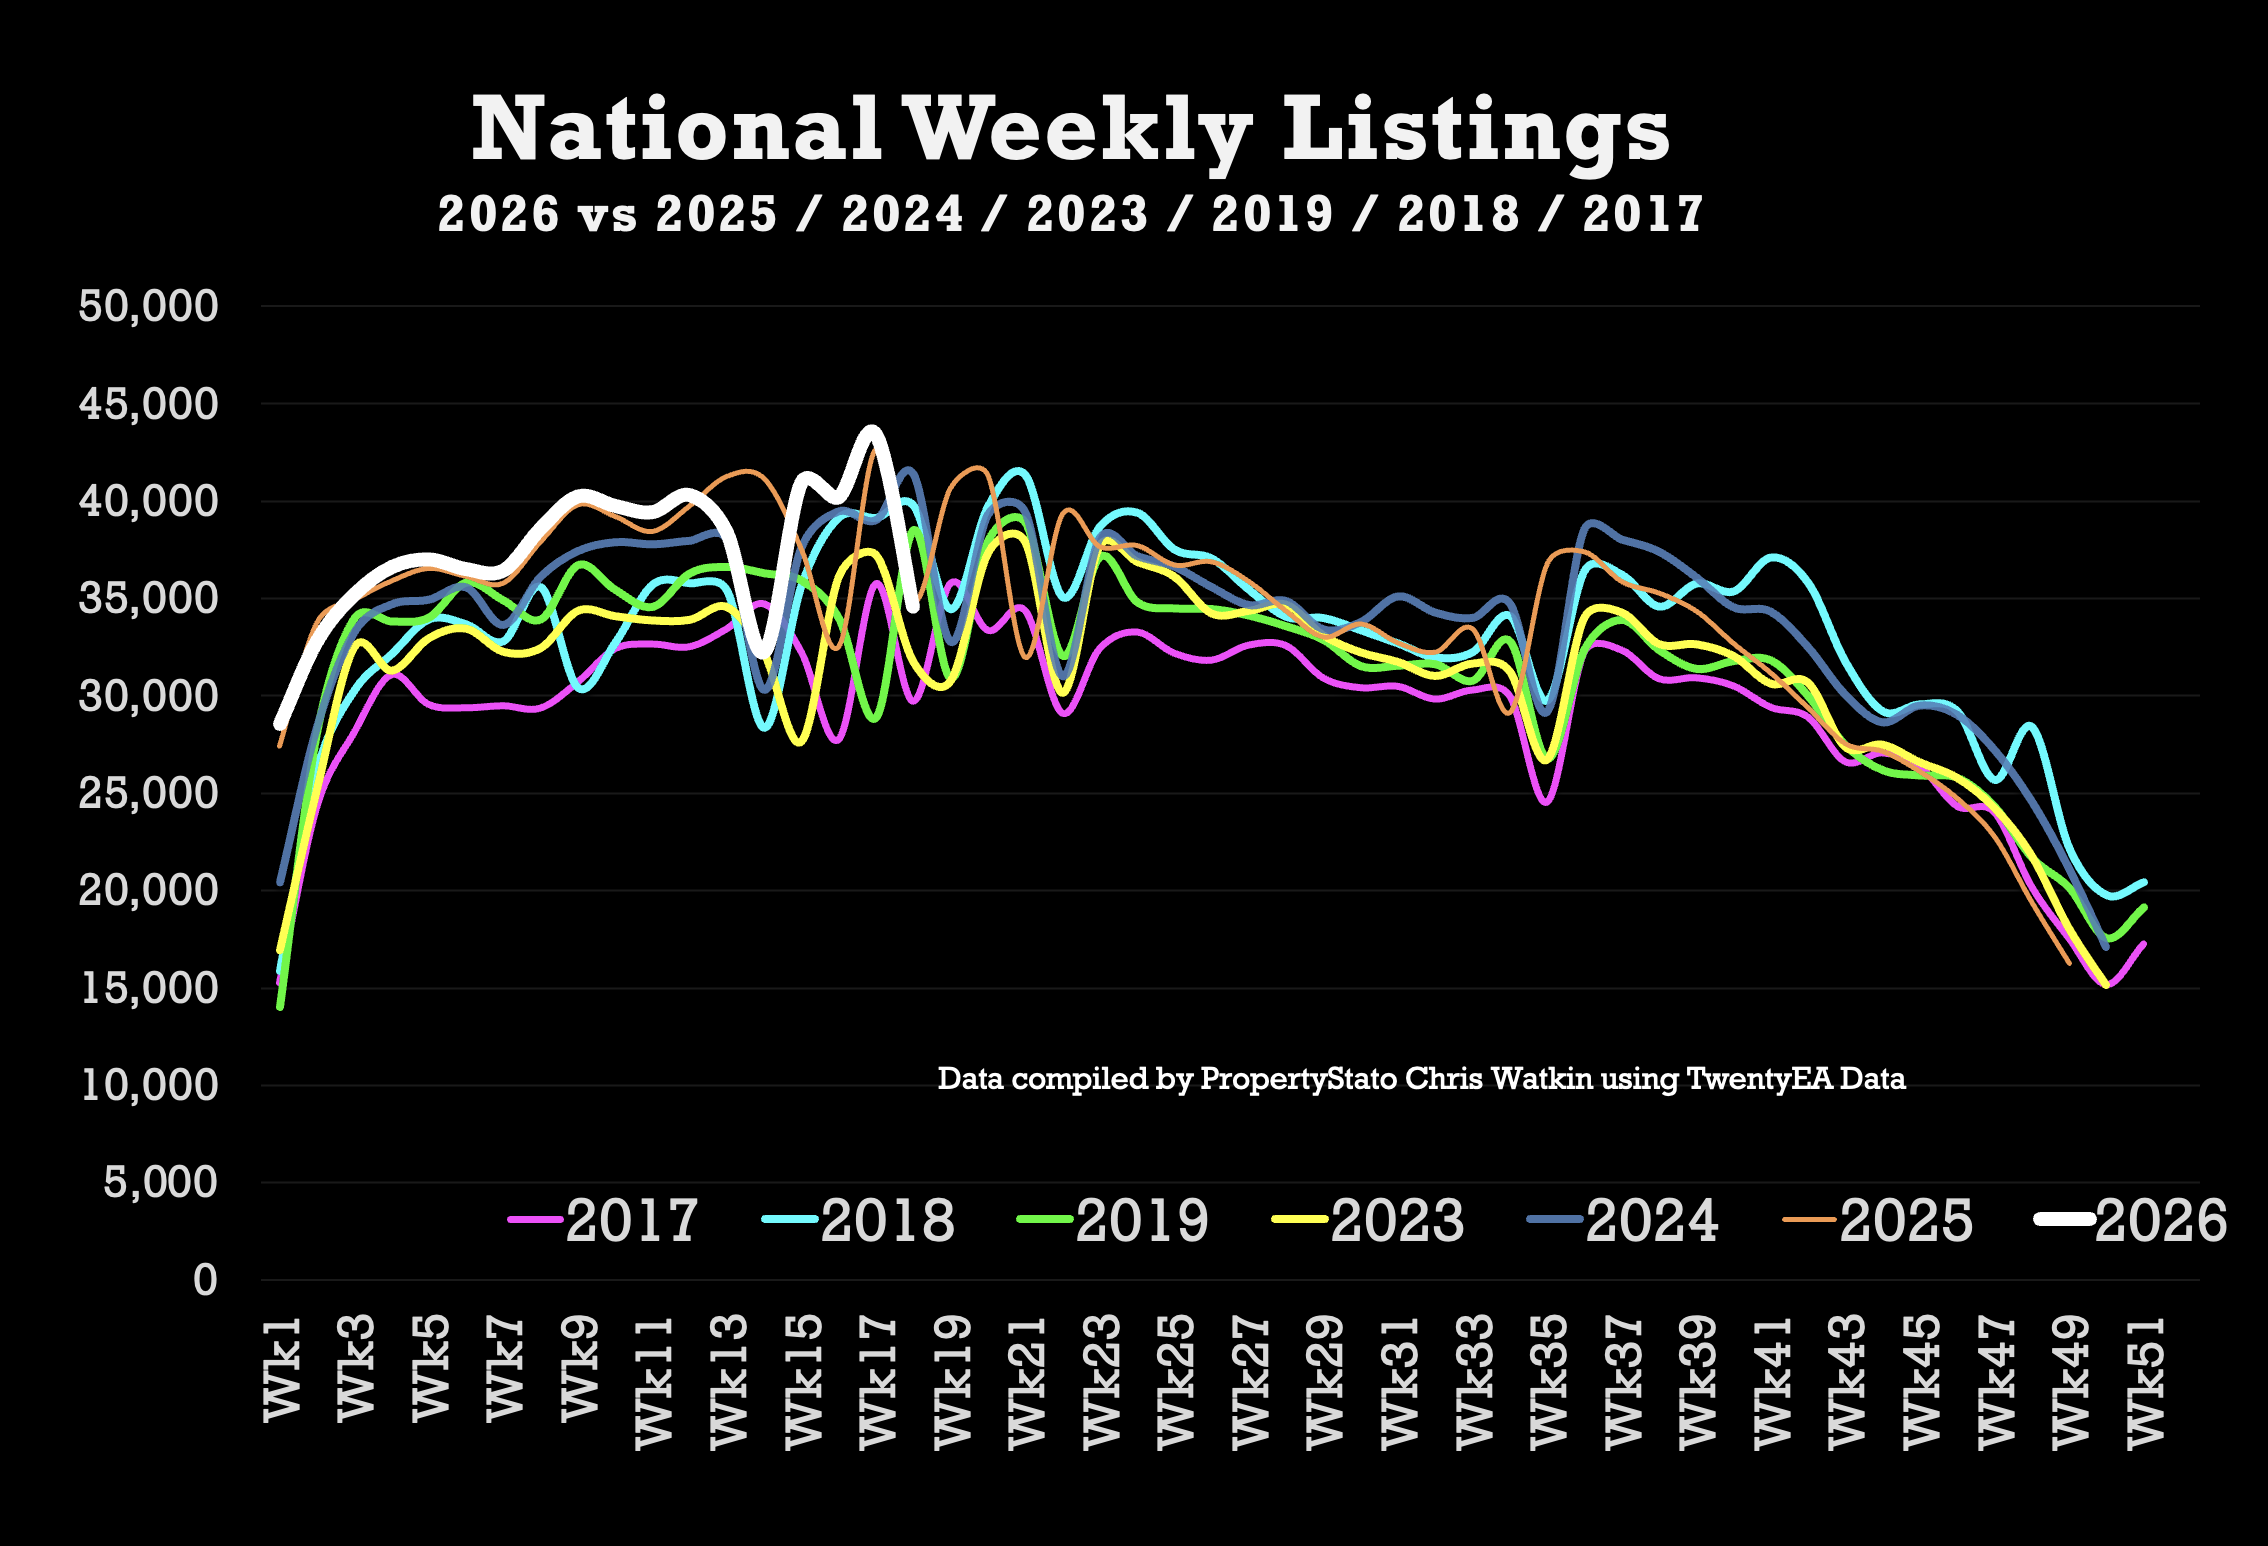
NB: Remember, this week was Bank Holiday week so all the numbers will be lower than the week before. Look at the graphs and you see that to be the case.
✅ New Listings
• 34.6k new properties came onto market this week (week 18), DOWN from 43.4k last week.
• 2025 weekly average: 30.6k.
• 10-year week 18 average : 32.3k
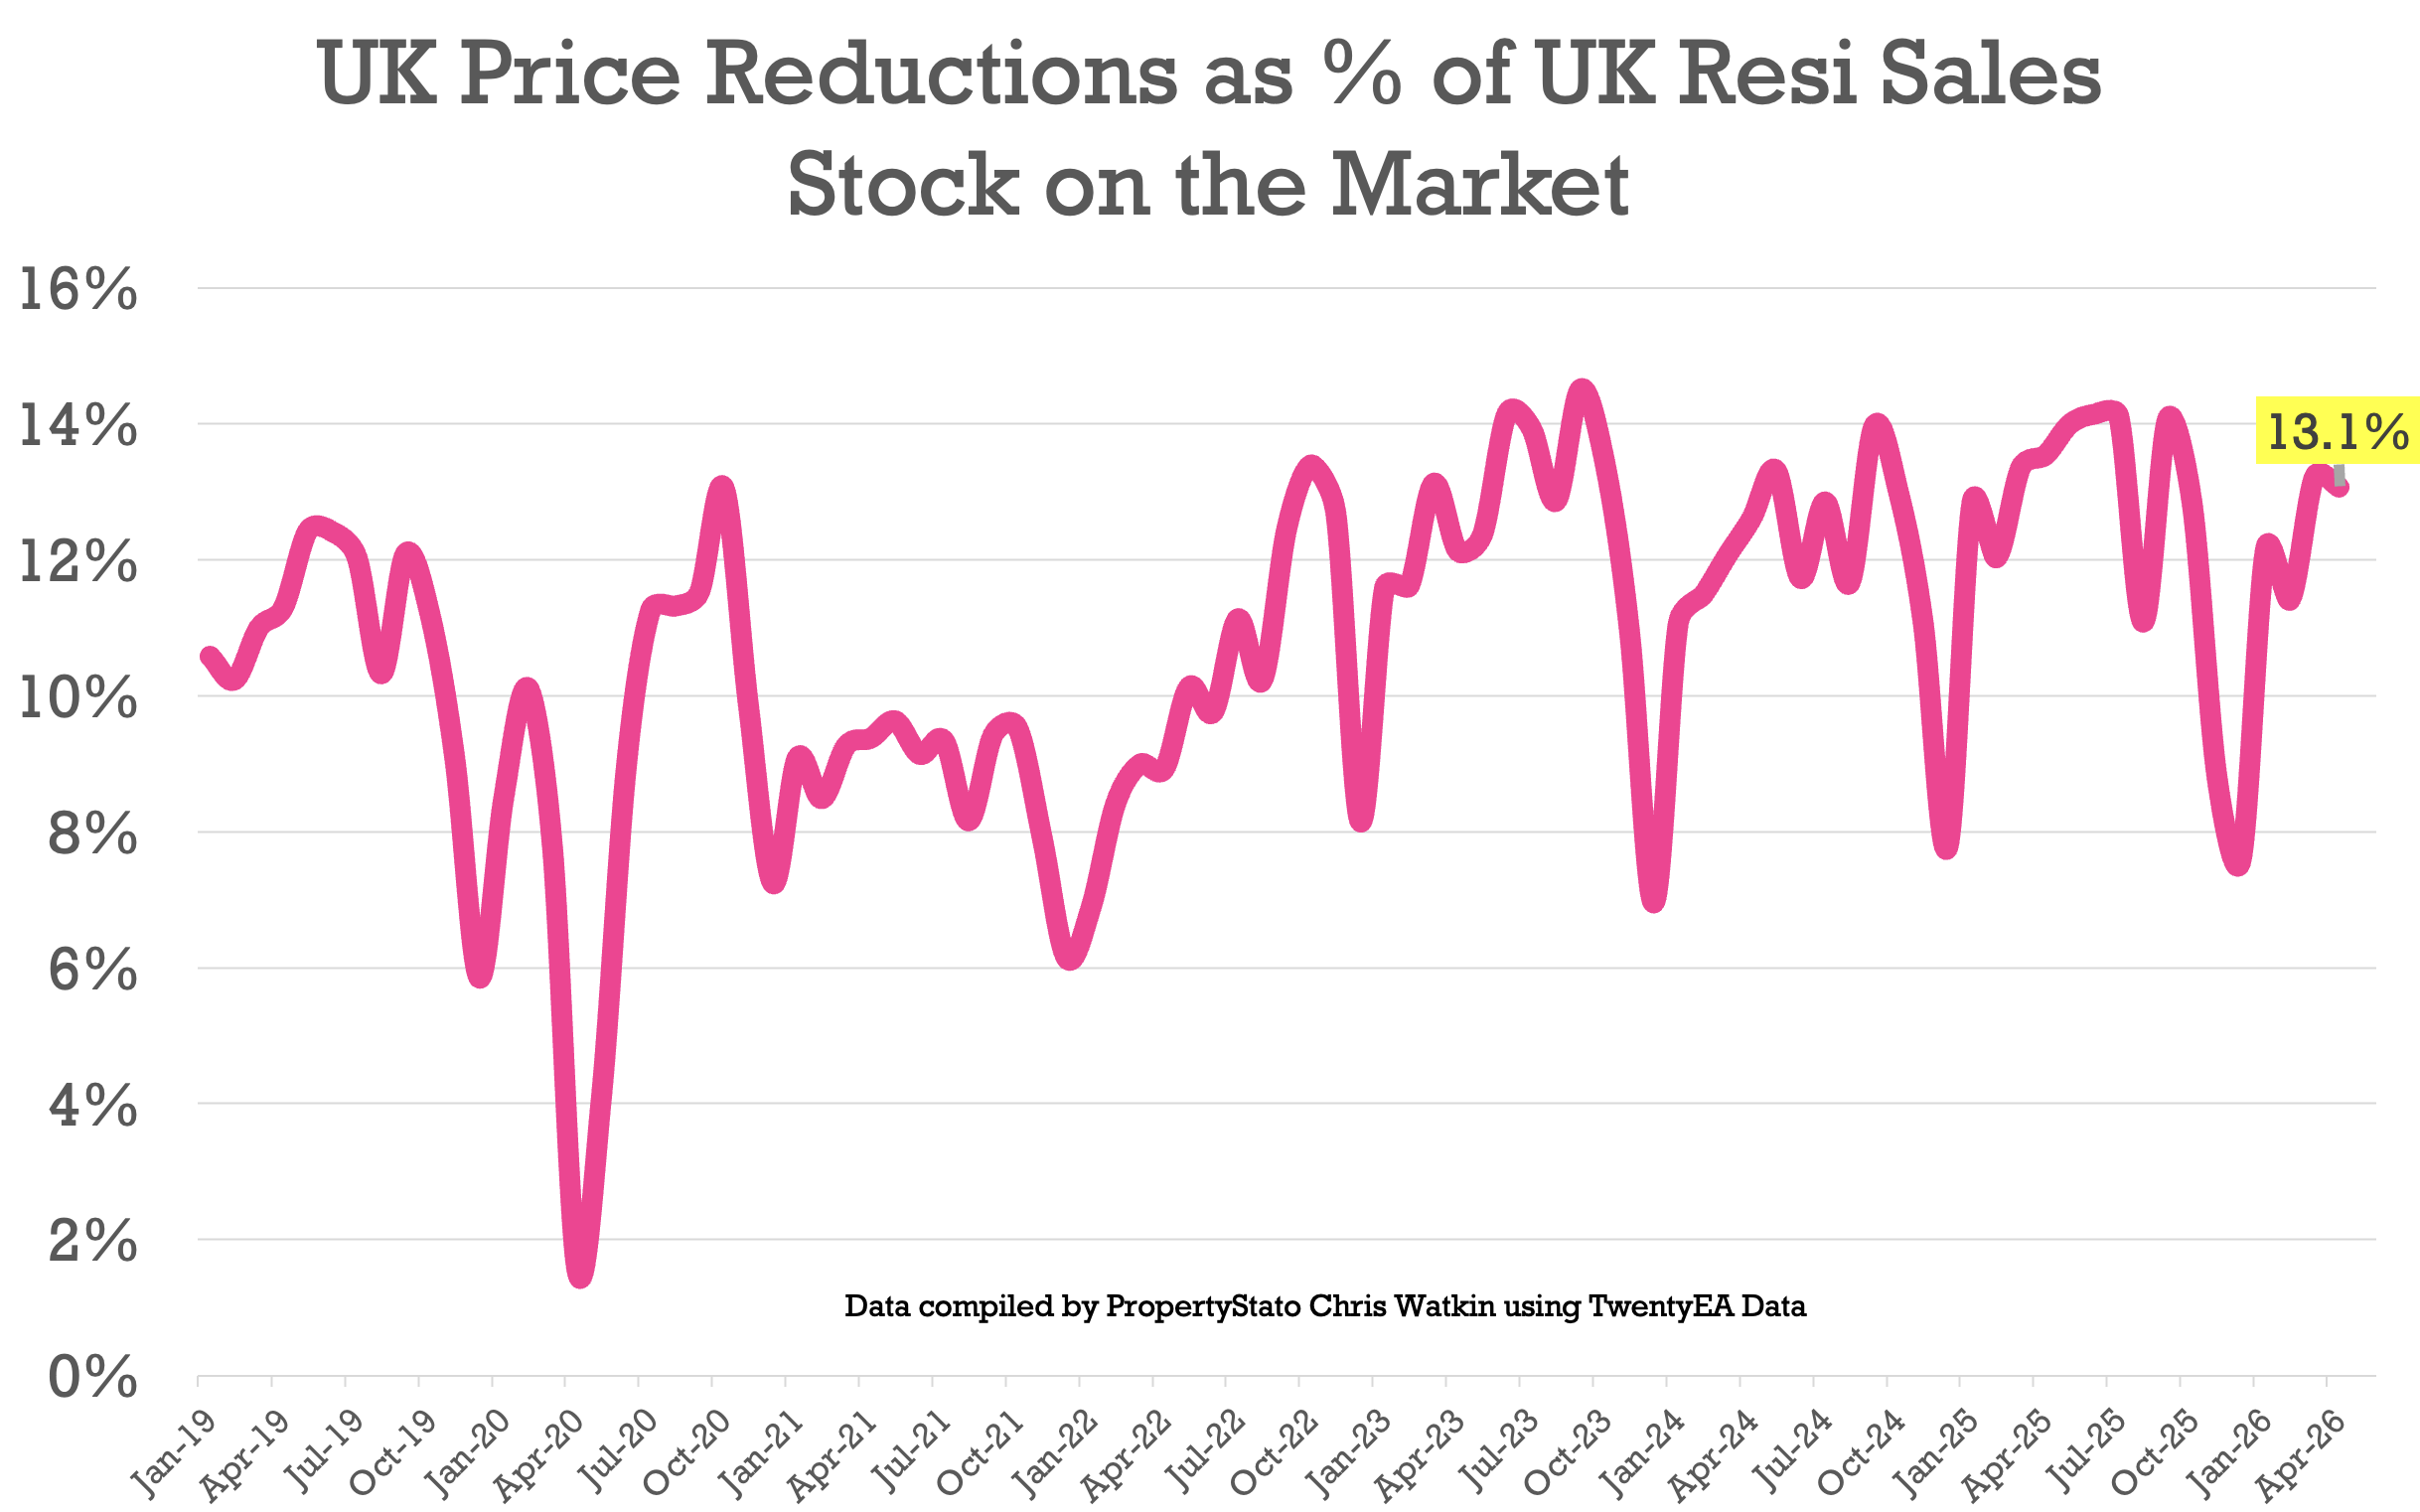
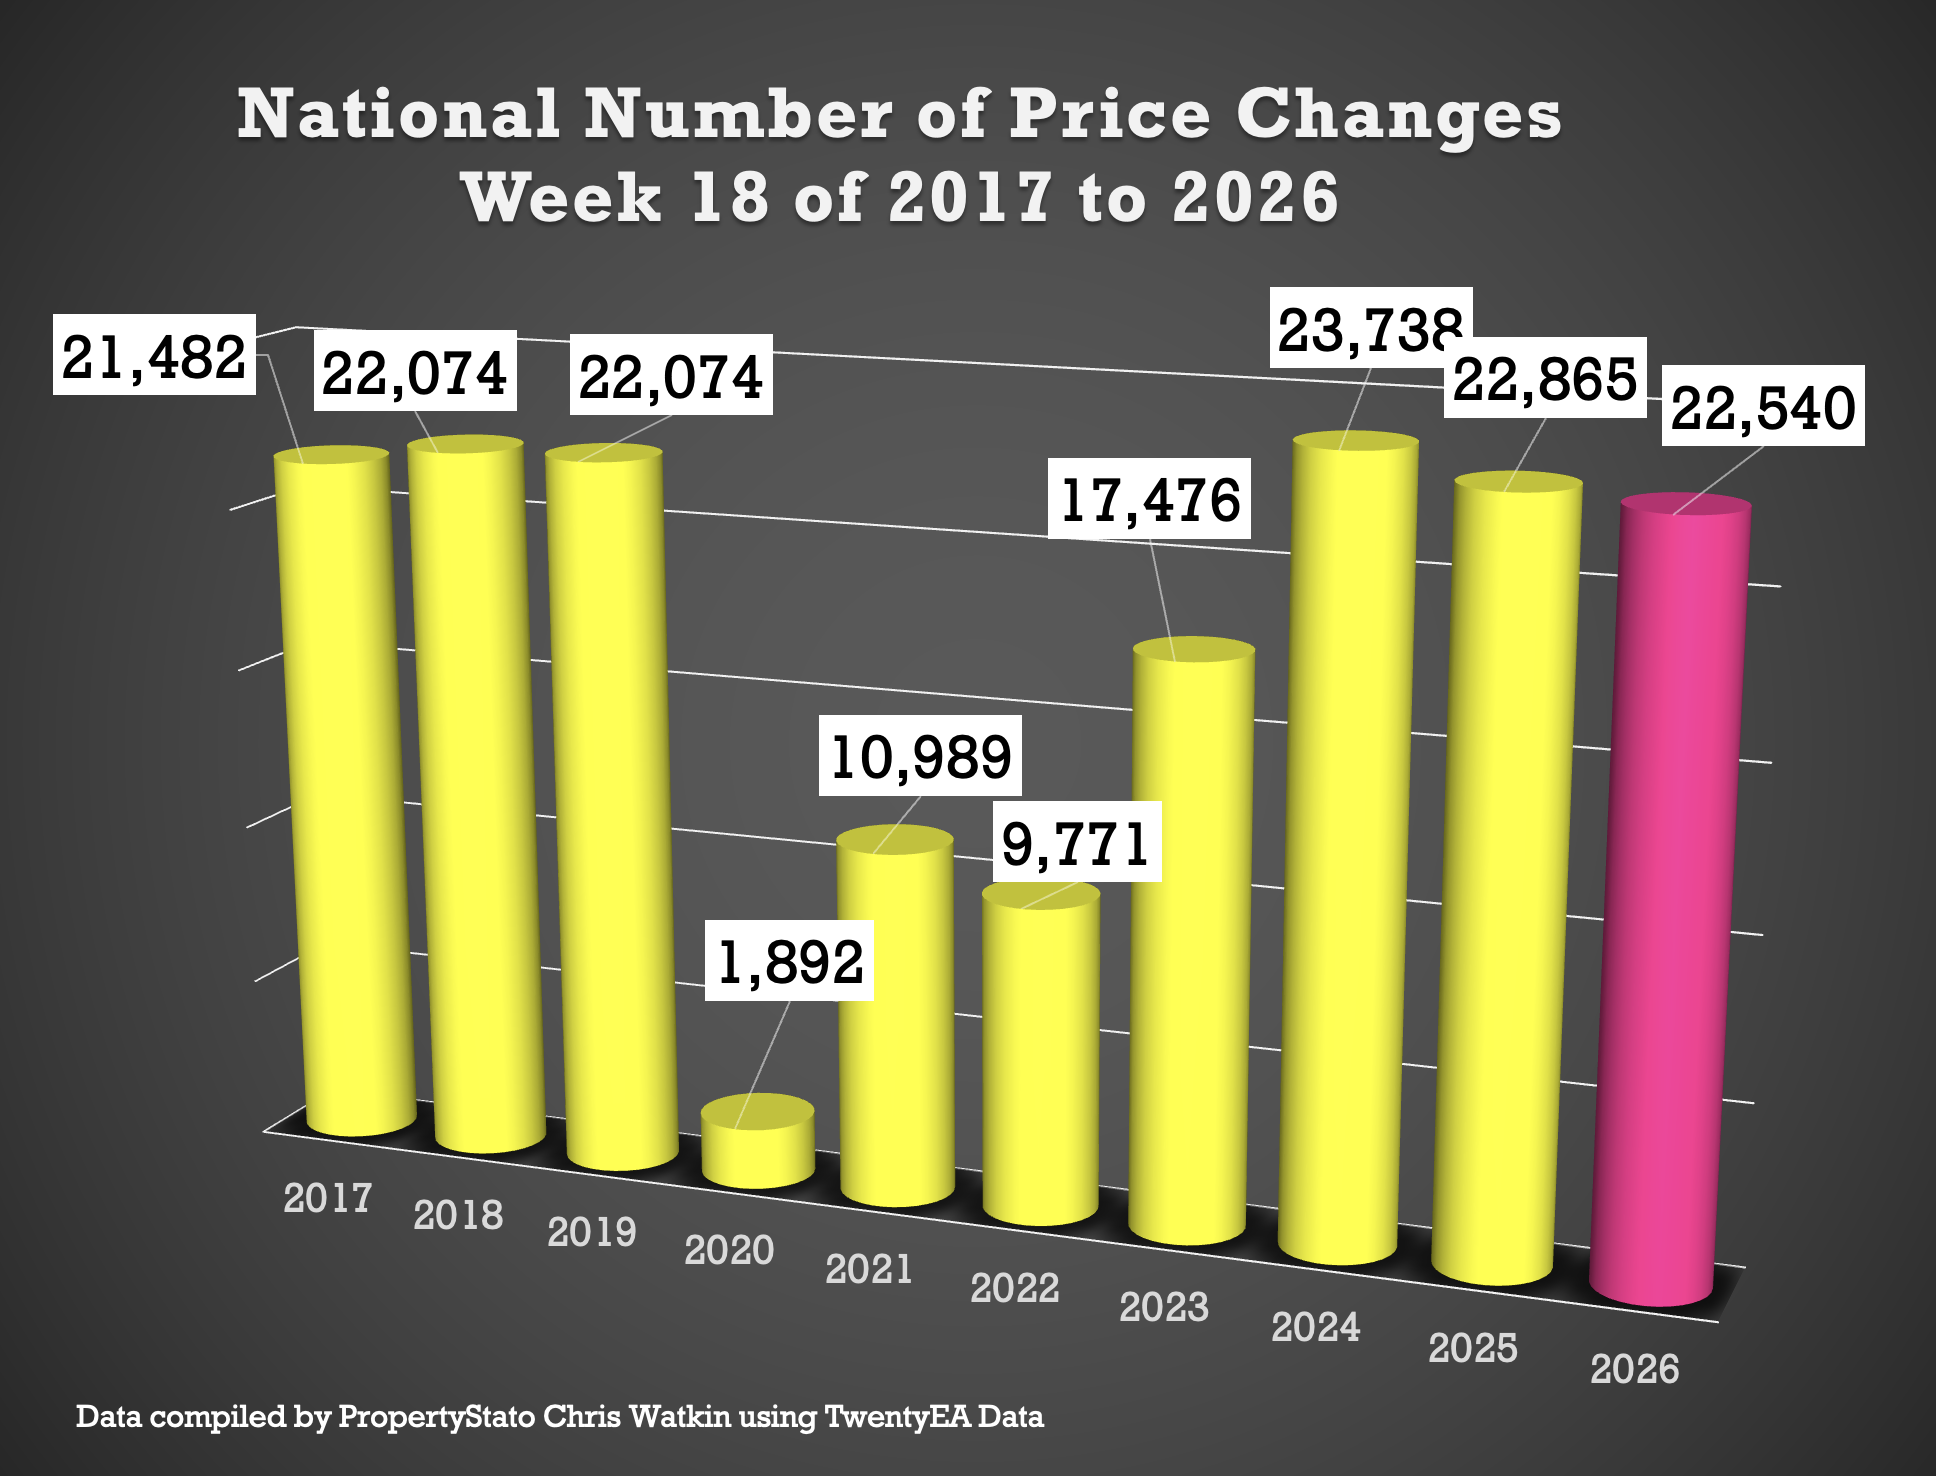
✅ Price Reductions
• 22.5k reductions this week, UP from 26.3k last week.
• 13.1% of UK resi homes for sale were reduced in April. Mar 26 was 13.2%.
• 2025 average was 12.8%, versus the 6-year long-term average of 10.7%.
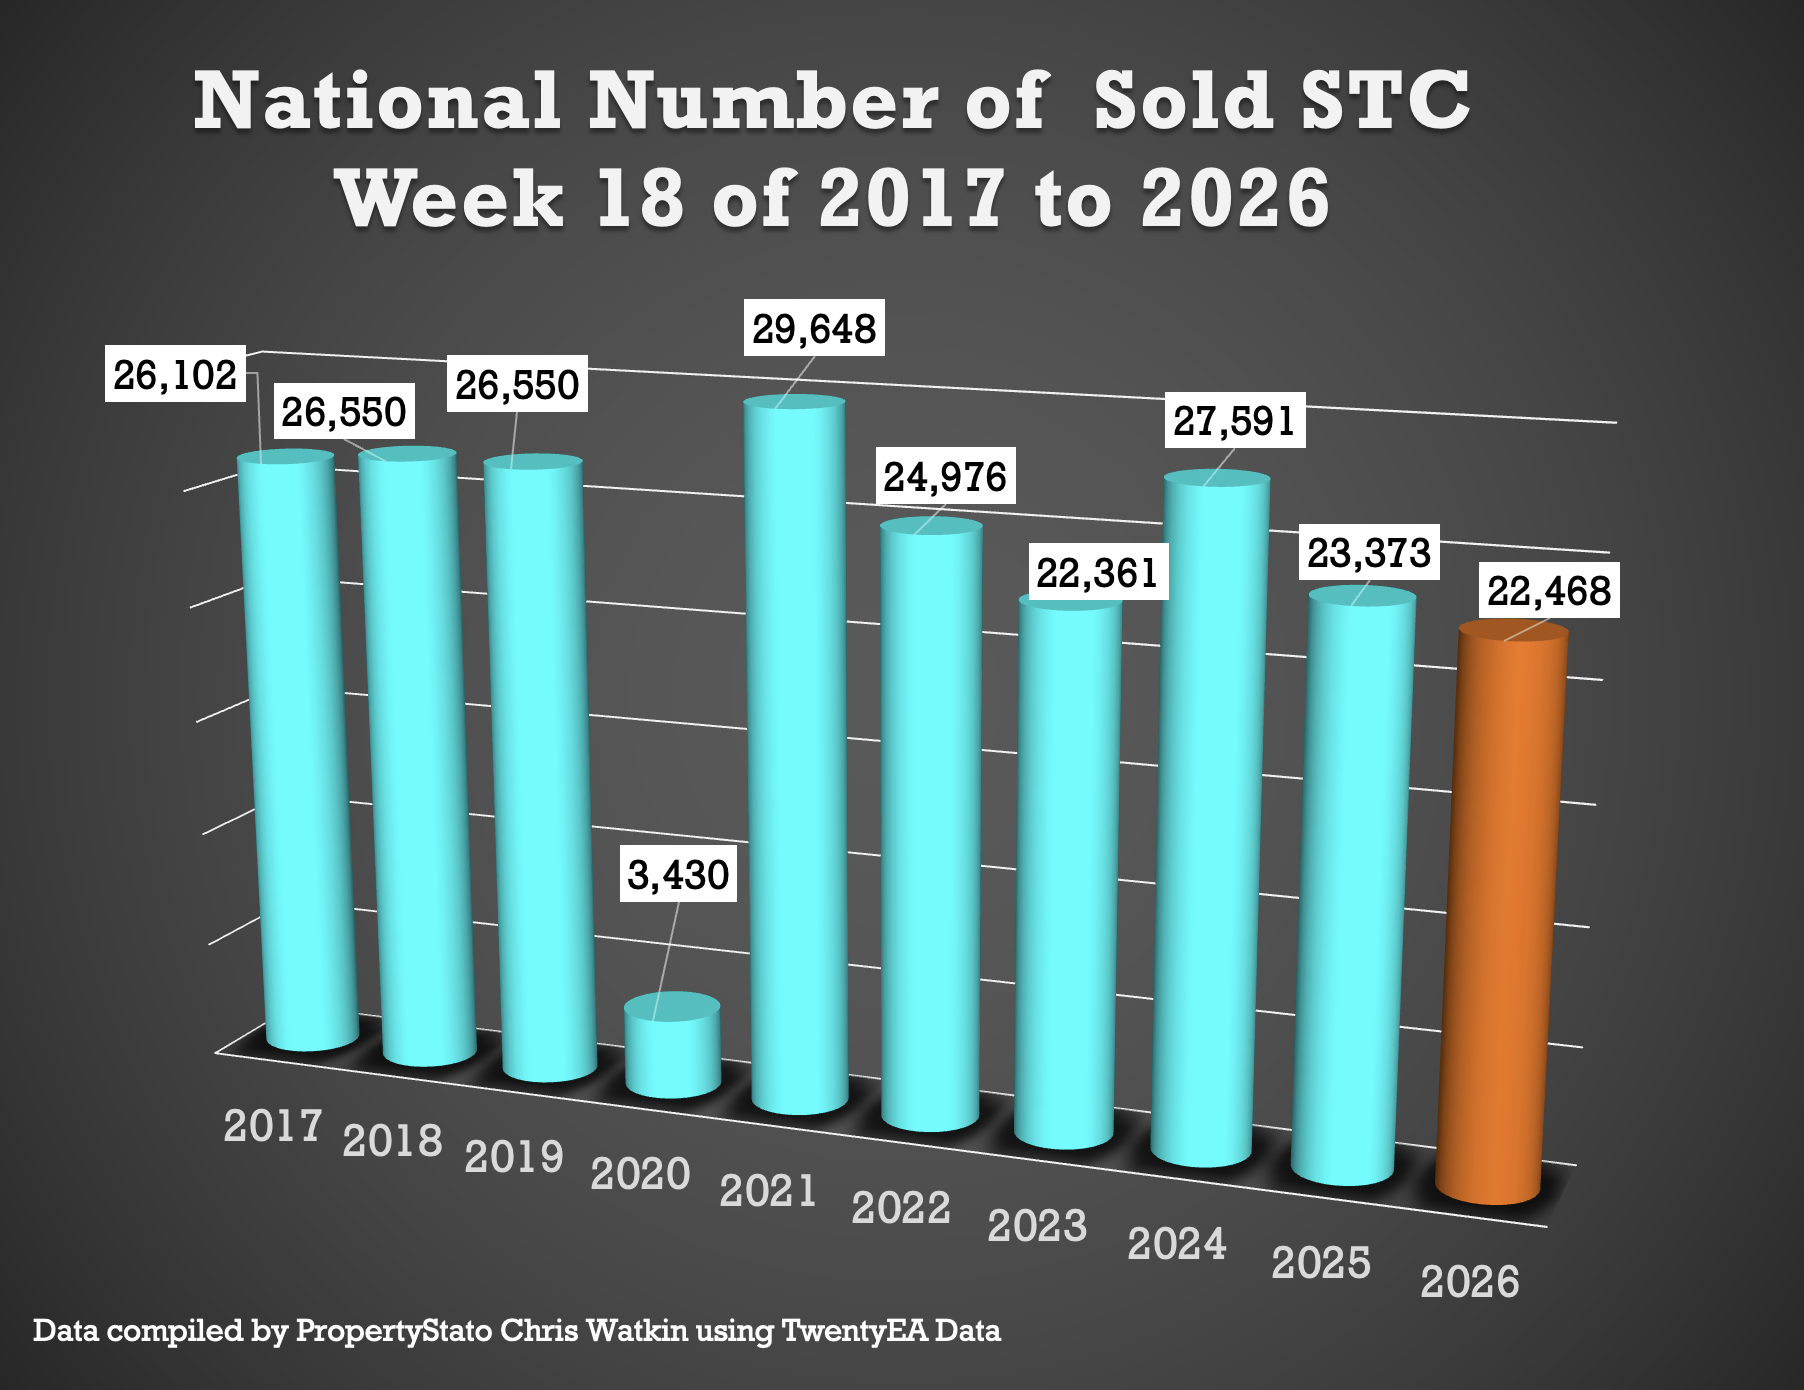
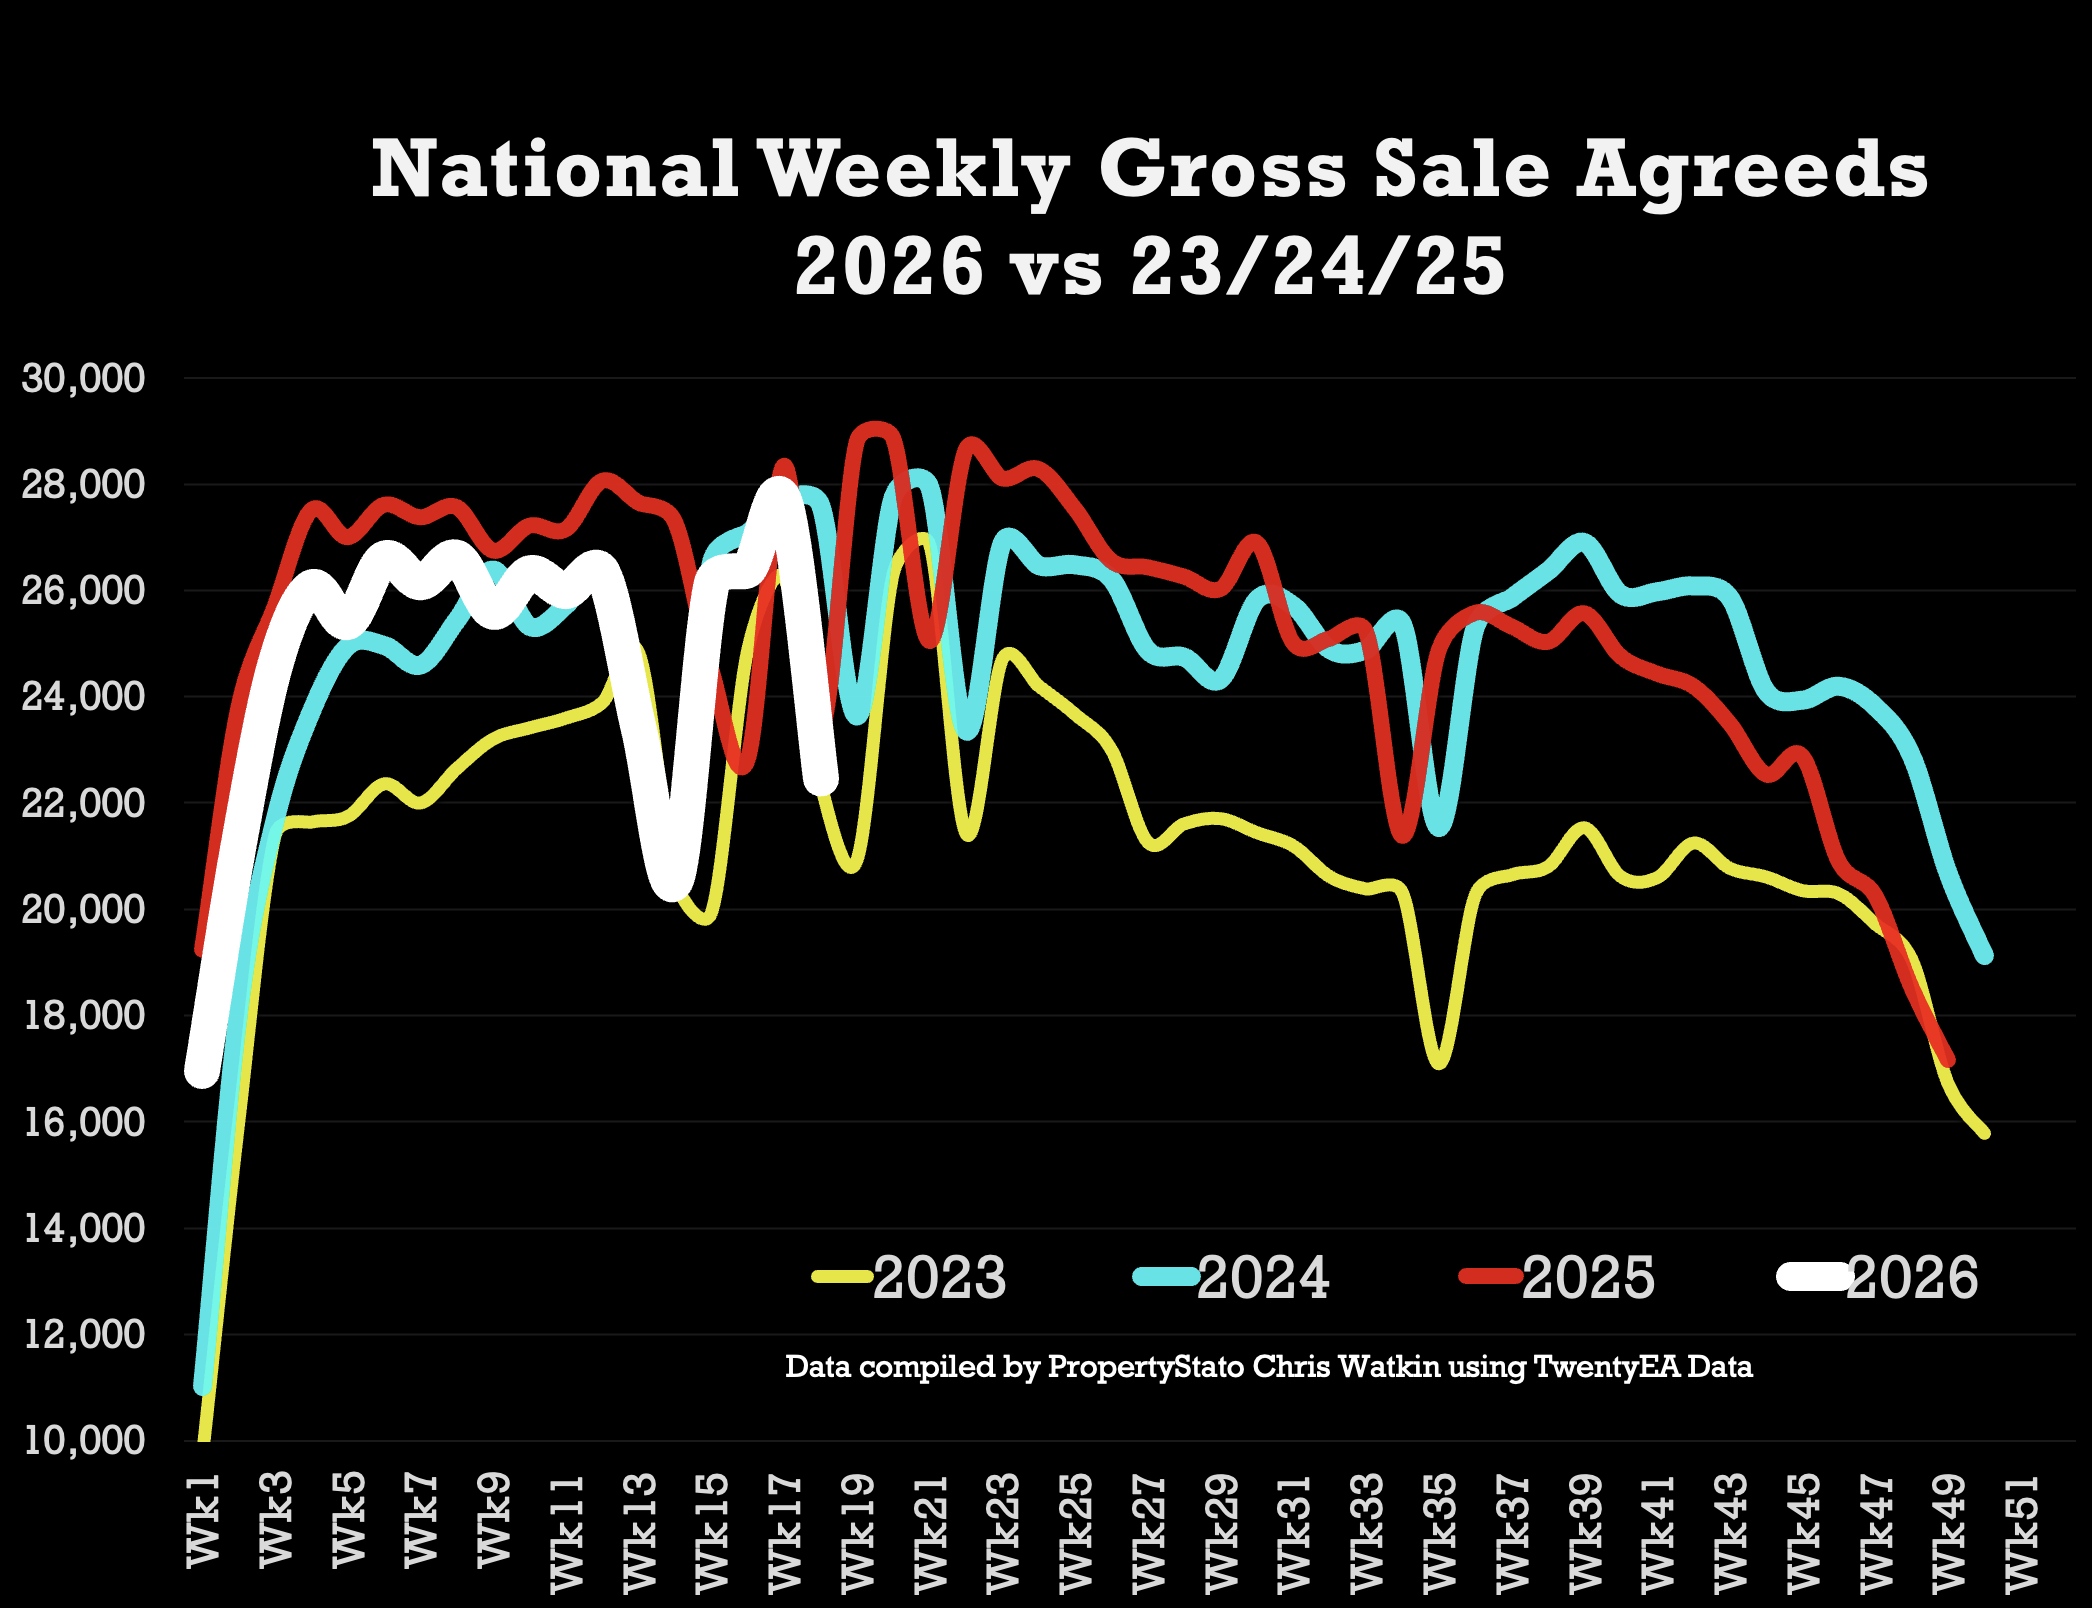
✅ Sales Agreed
• 22.5k homes sold stc this week 18, DOWN from 27.7k last week.
• Week 18 average (for last 10 years which includes the post pandemic boom) : 23.3k
• 2026 weekly average : 24.7k.
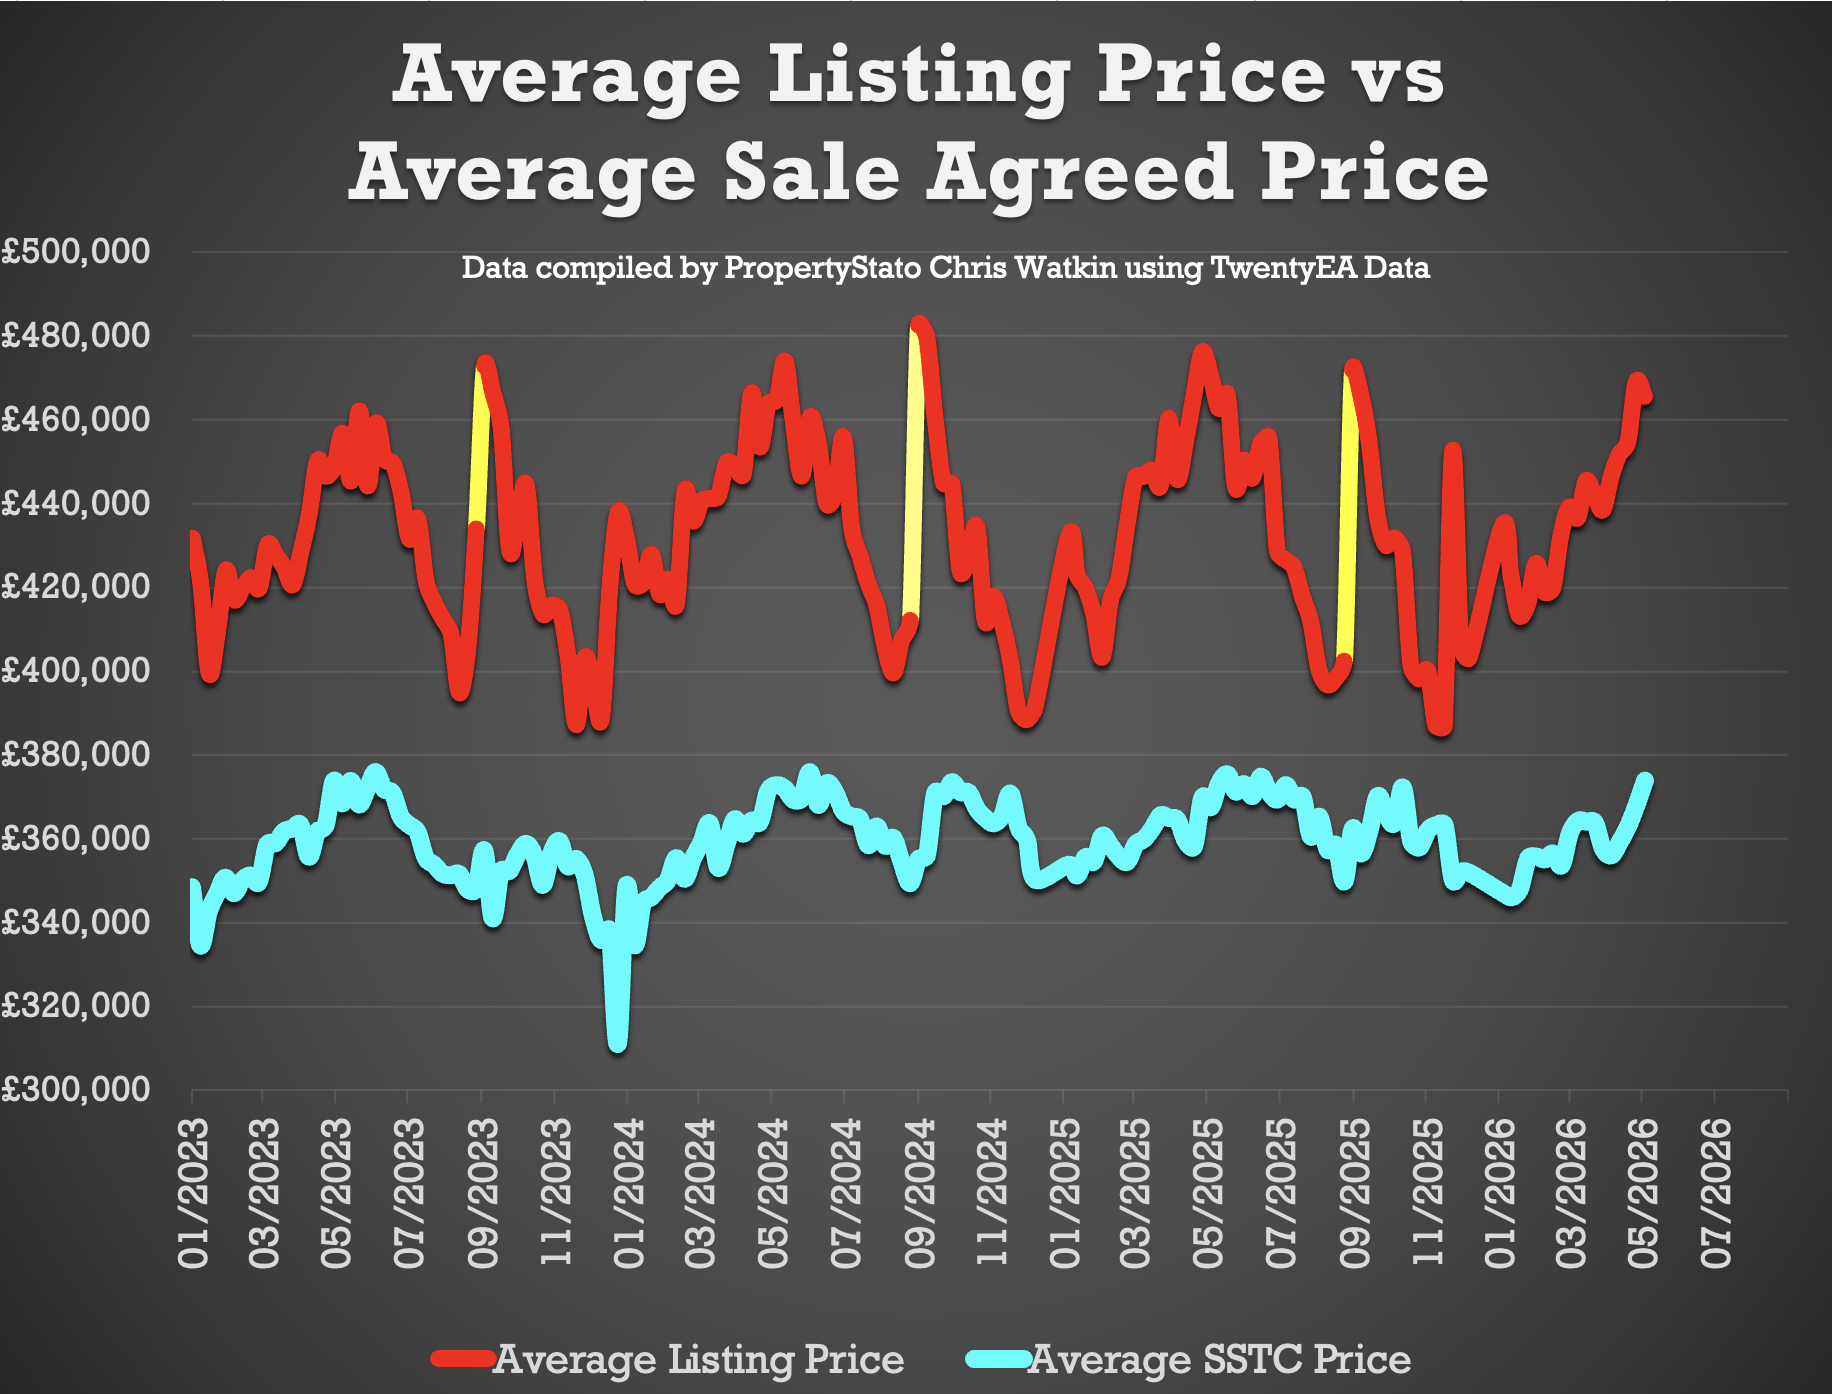
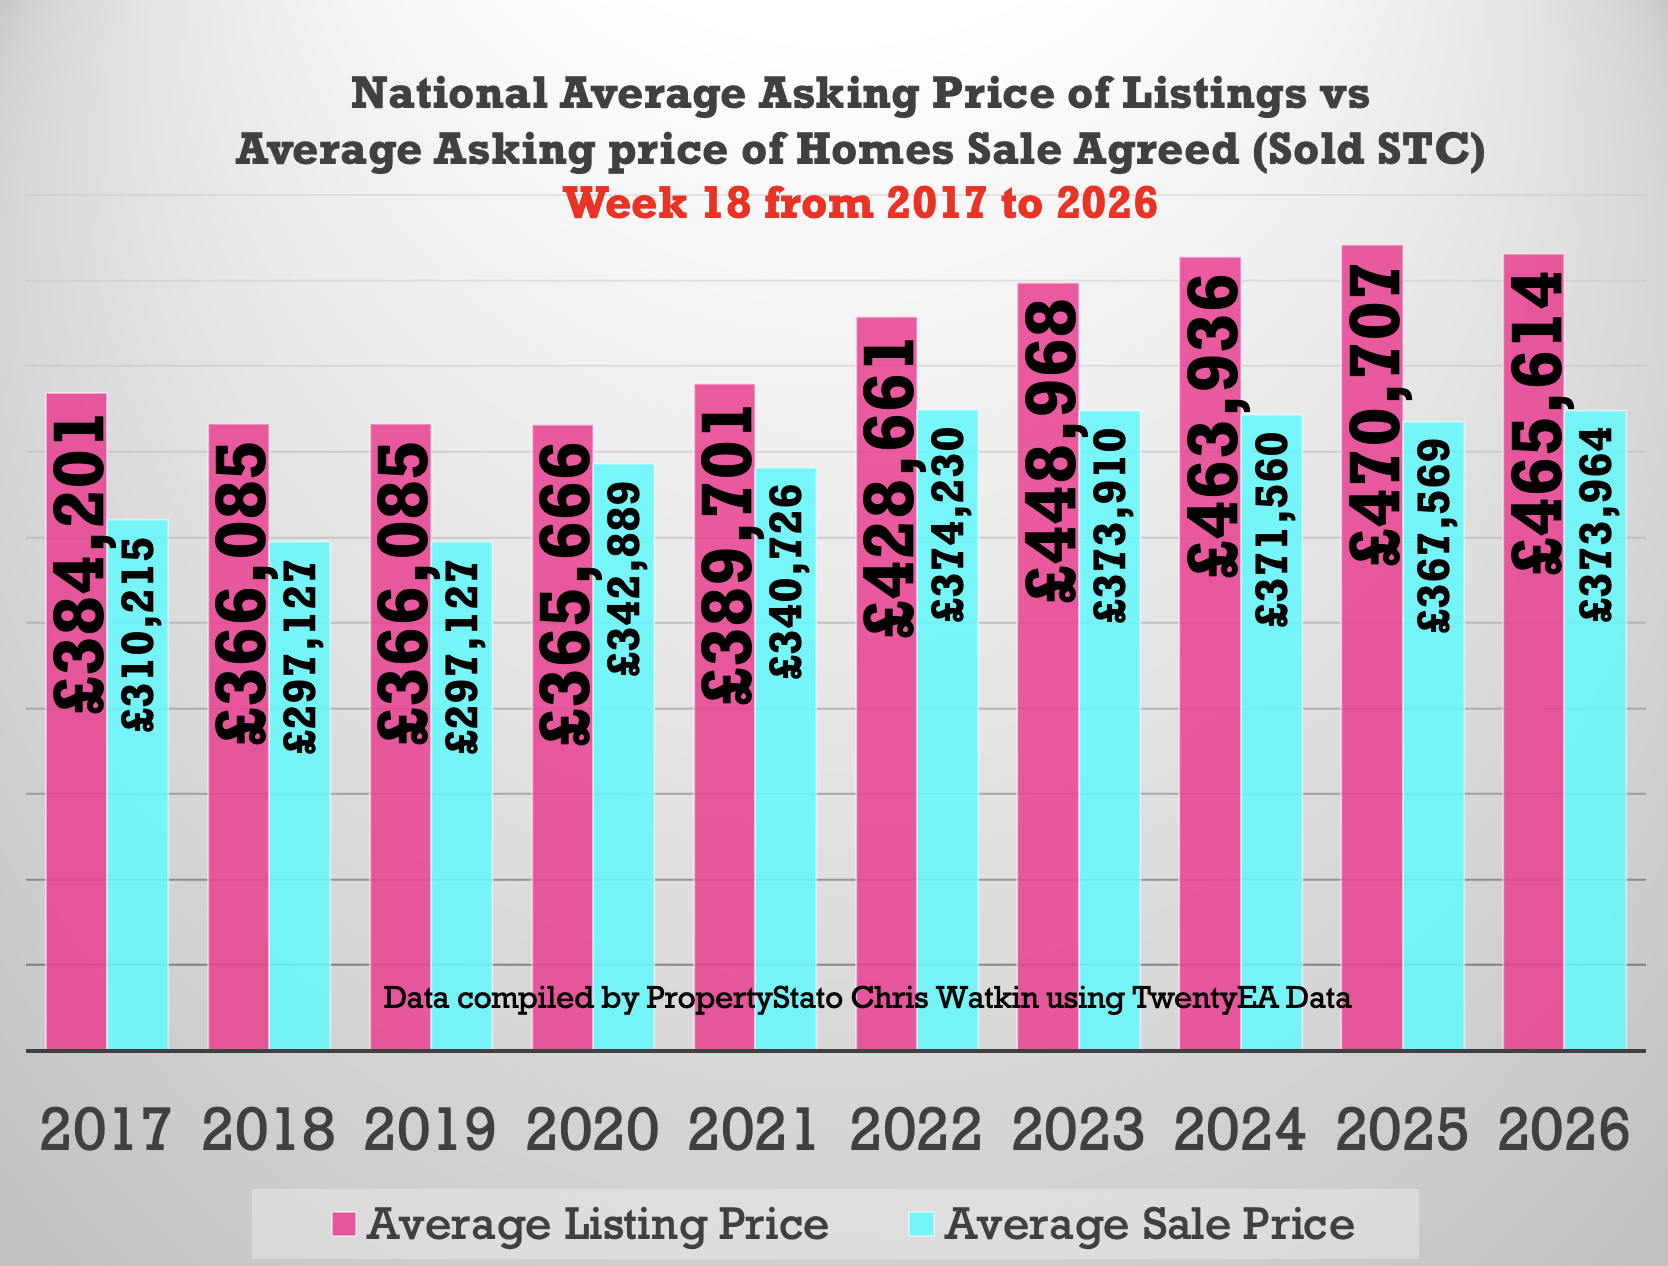
✅ Price Difference between Listings & Sales
• 24.5% difference (long term 10 year average is 16% to 17%). (£466k ave Listing Ave Asking price vs £374k Sale Agreed ave Asking price).
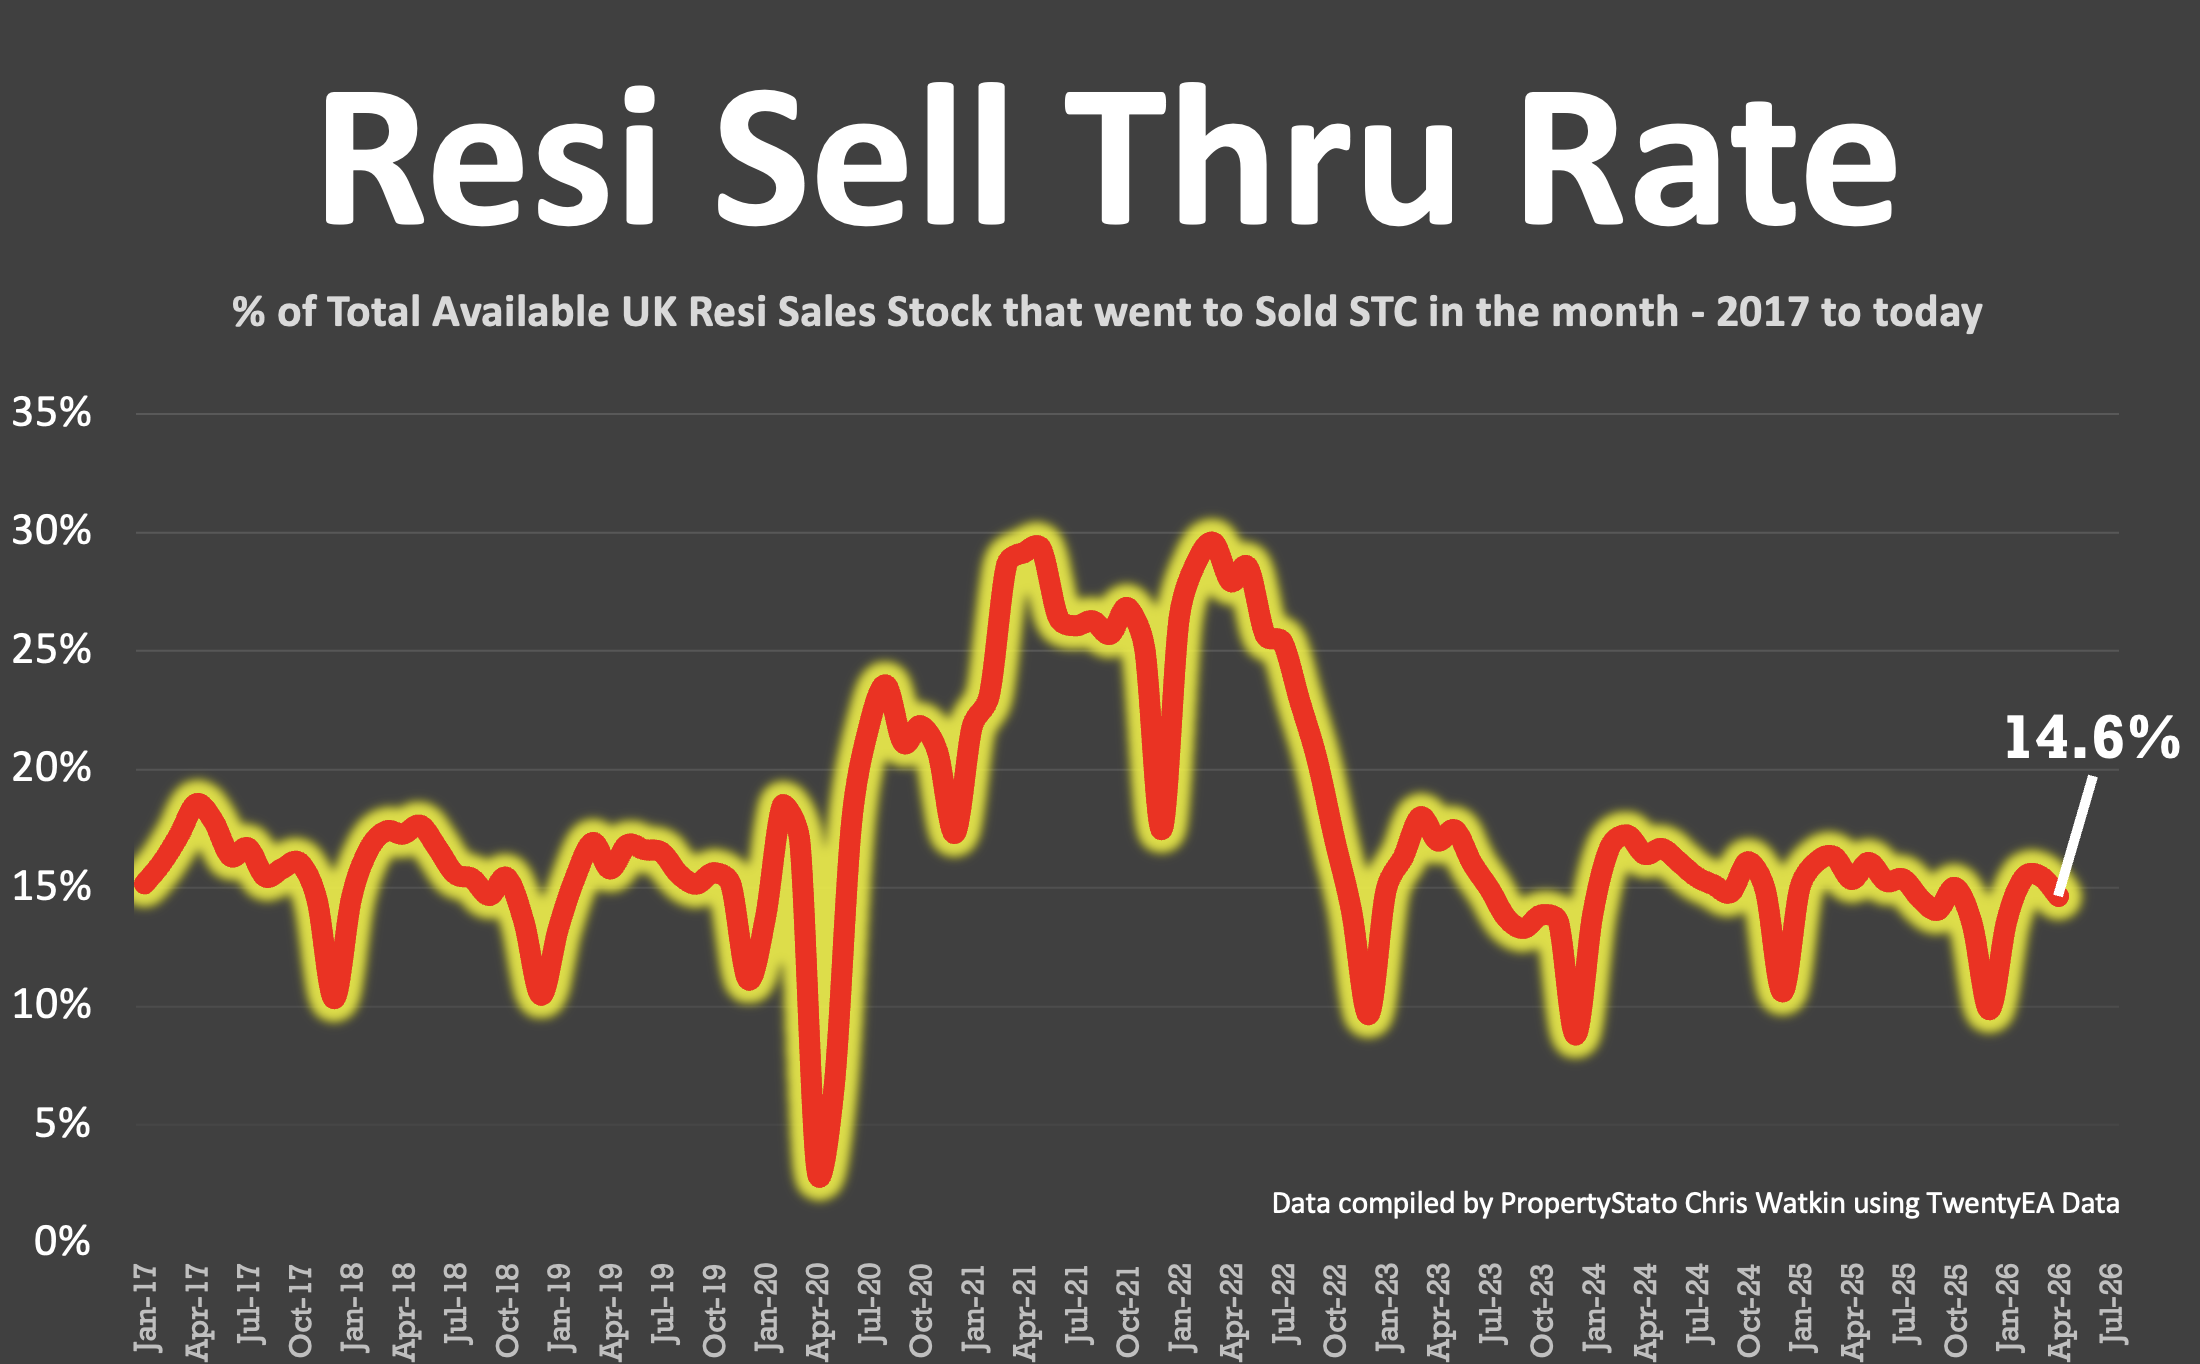
✅ Sell-Through Rate
• 14.6% of homes on agents’ books went SSTC in March ’26. Down from March ’26 – 15.5%
• Pre-Covid average: 15.5%.
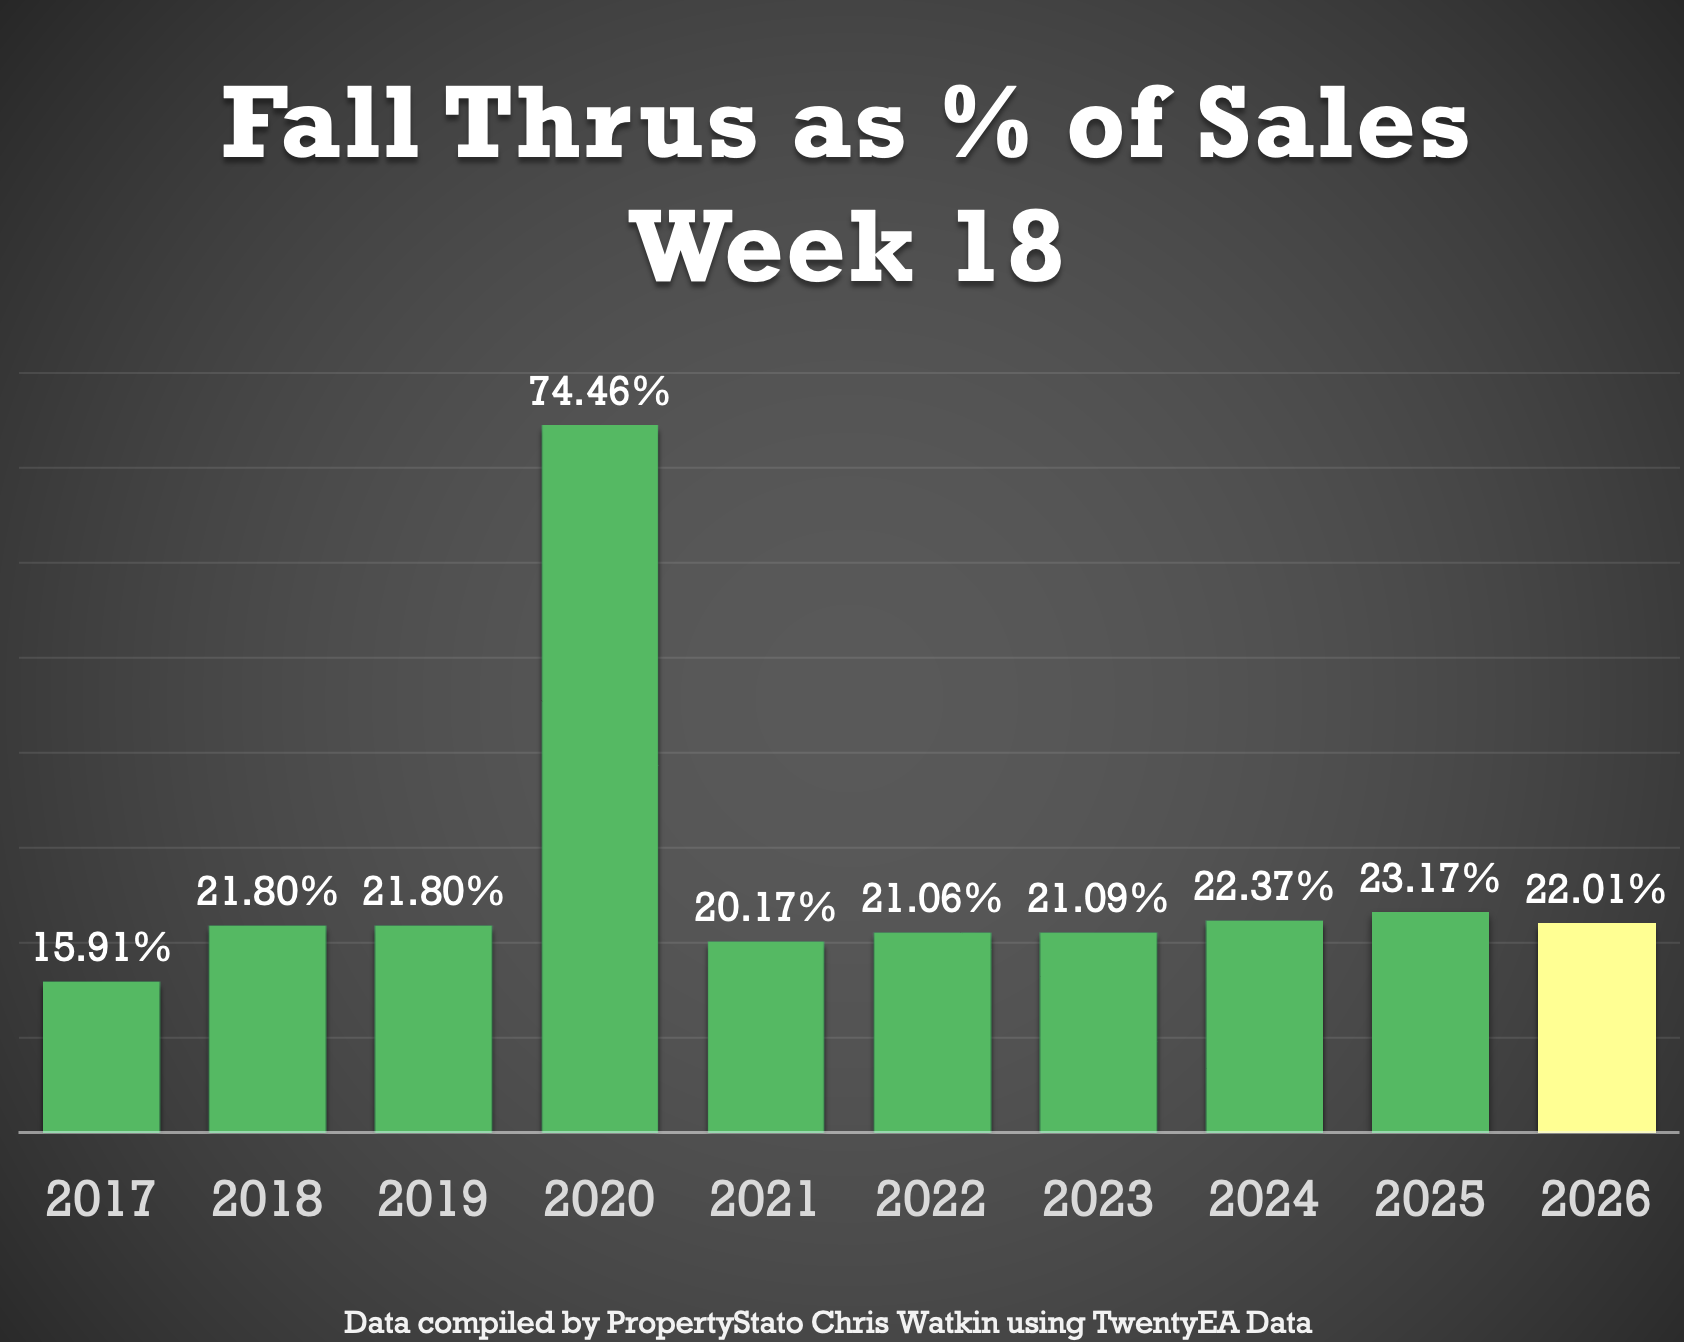
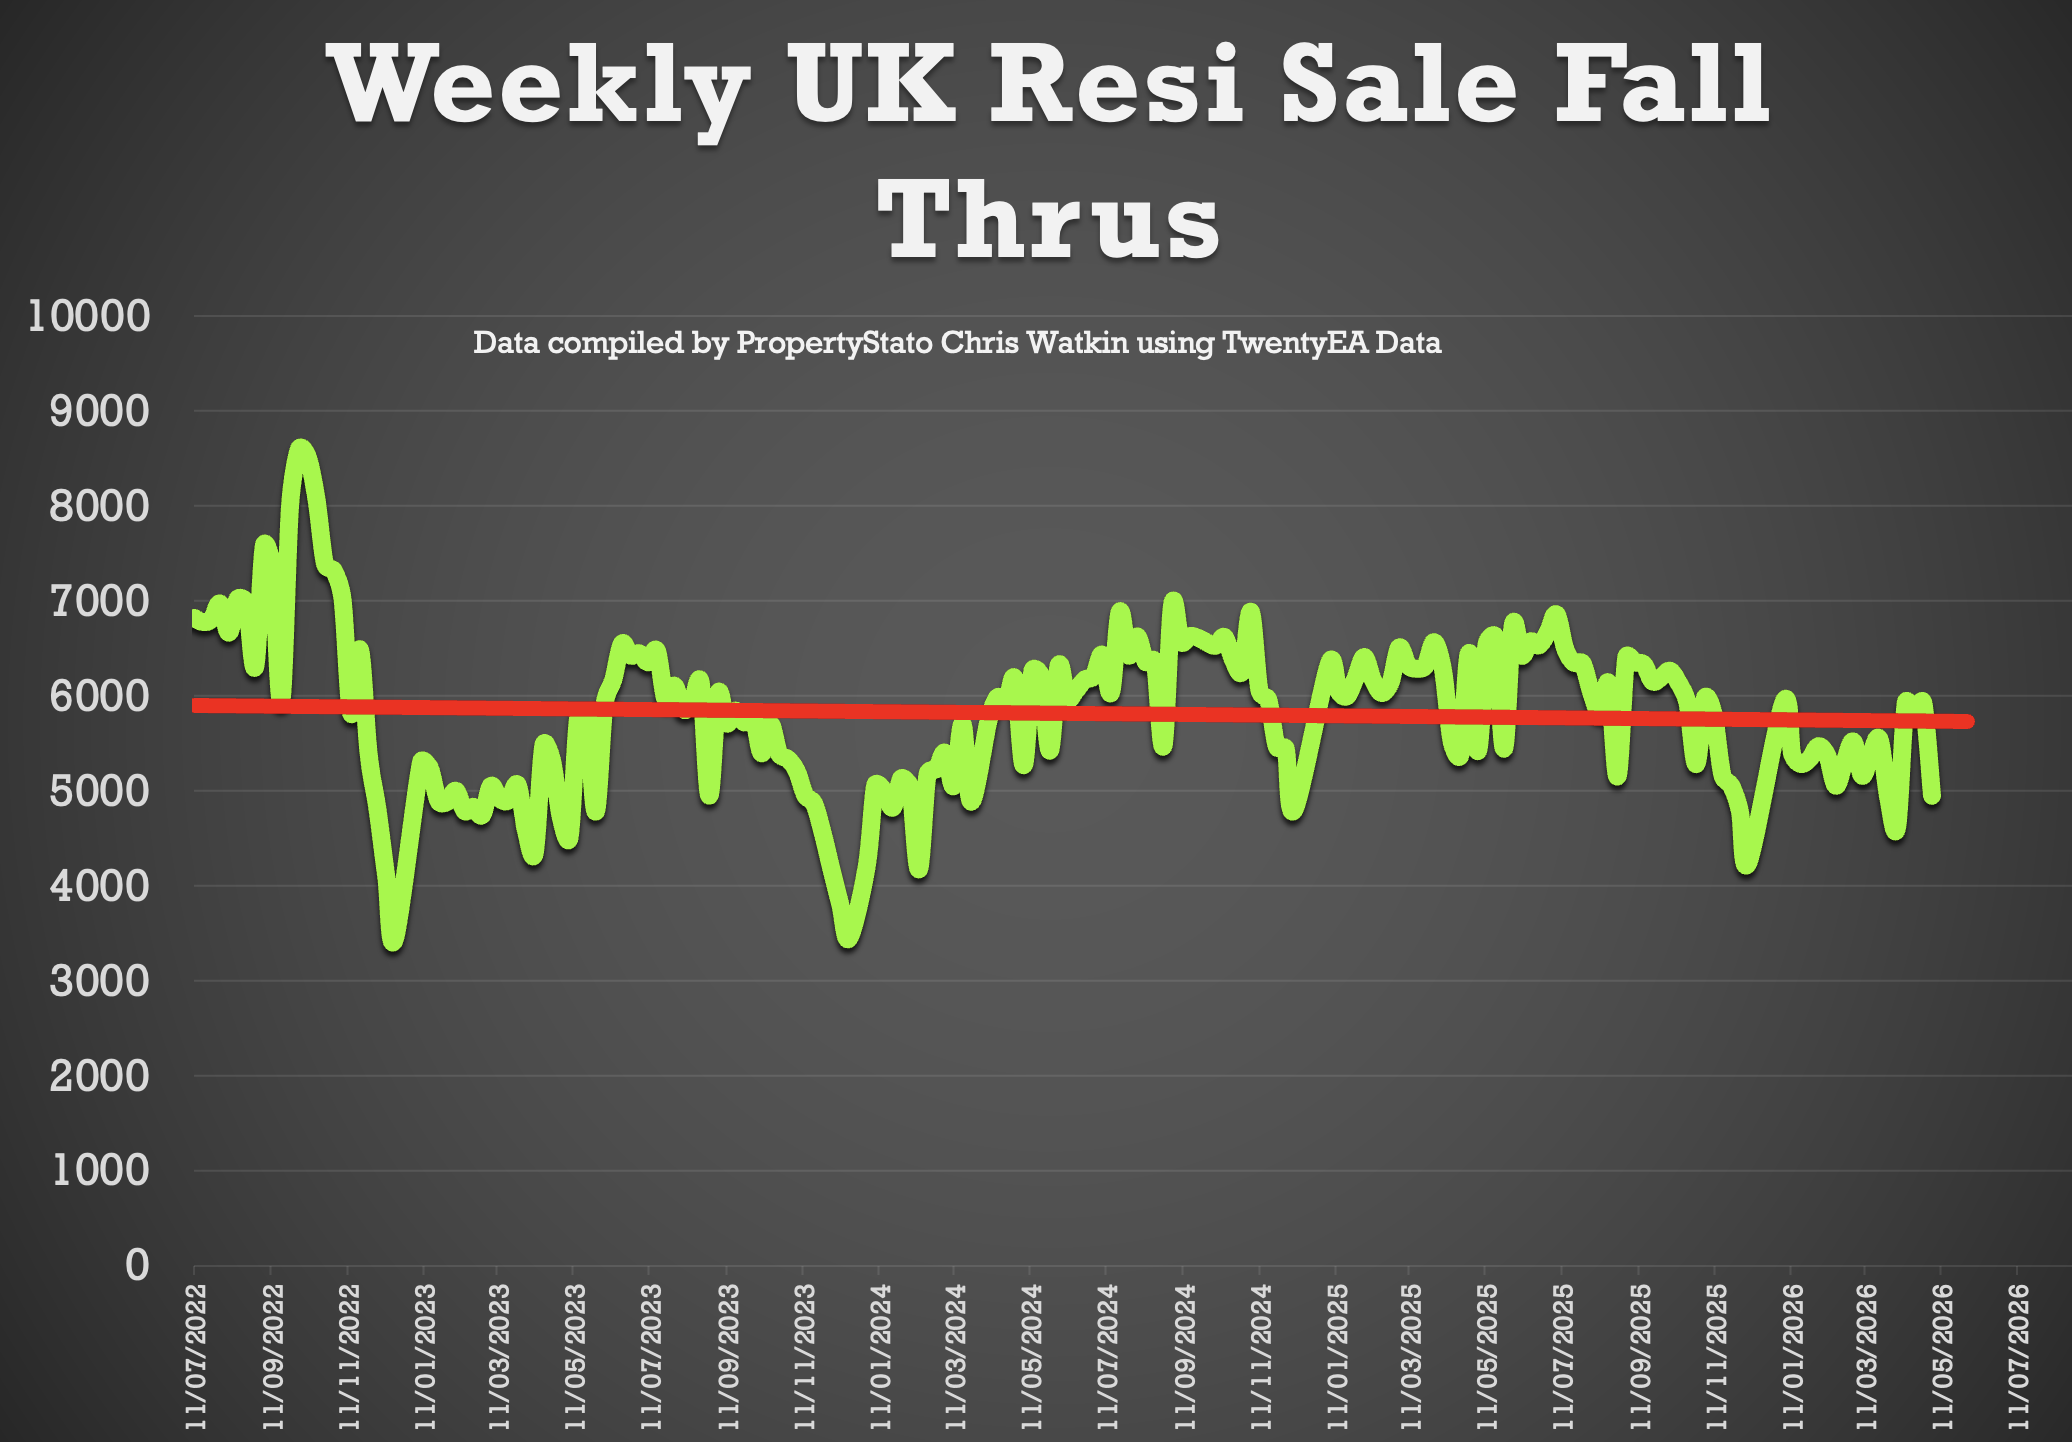
✅ Fall-Throughs
• 4,946 fall-throughs last week (pipeline of 461k home Sold STC).
• Weekly average of fall thrus for the whole of 2025: 6.1k and 5.4k in 2026 YTD
• Fall-through rate (Fall thru expressed as a % of the Gross sales that week): 22%, UP from last week’s 21.4%.
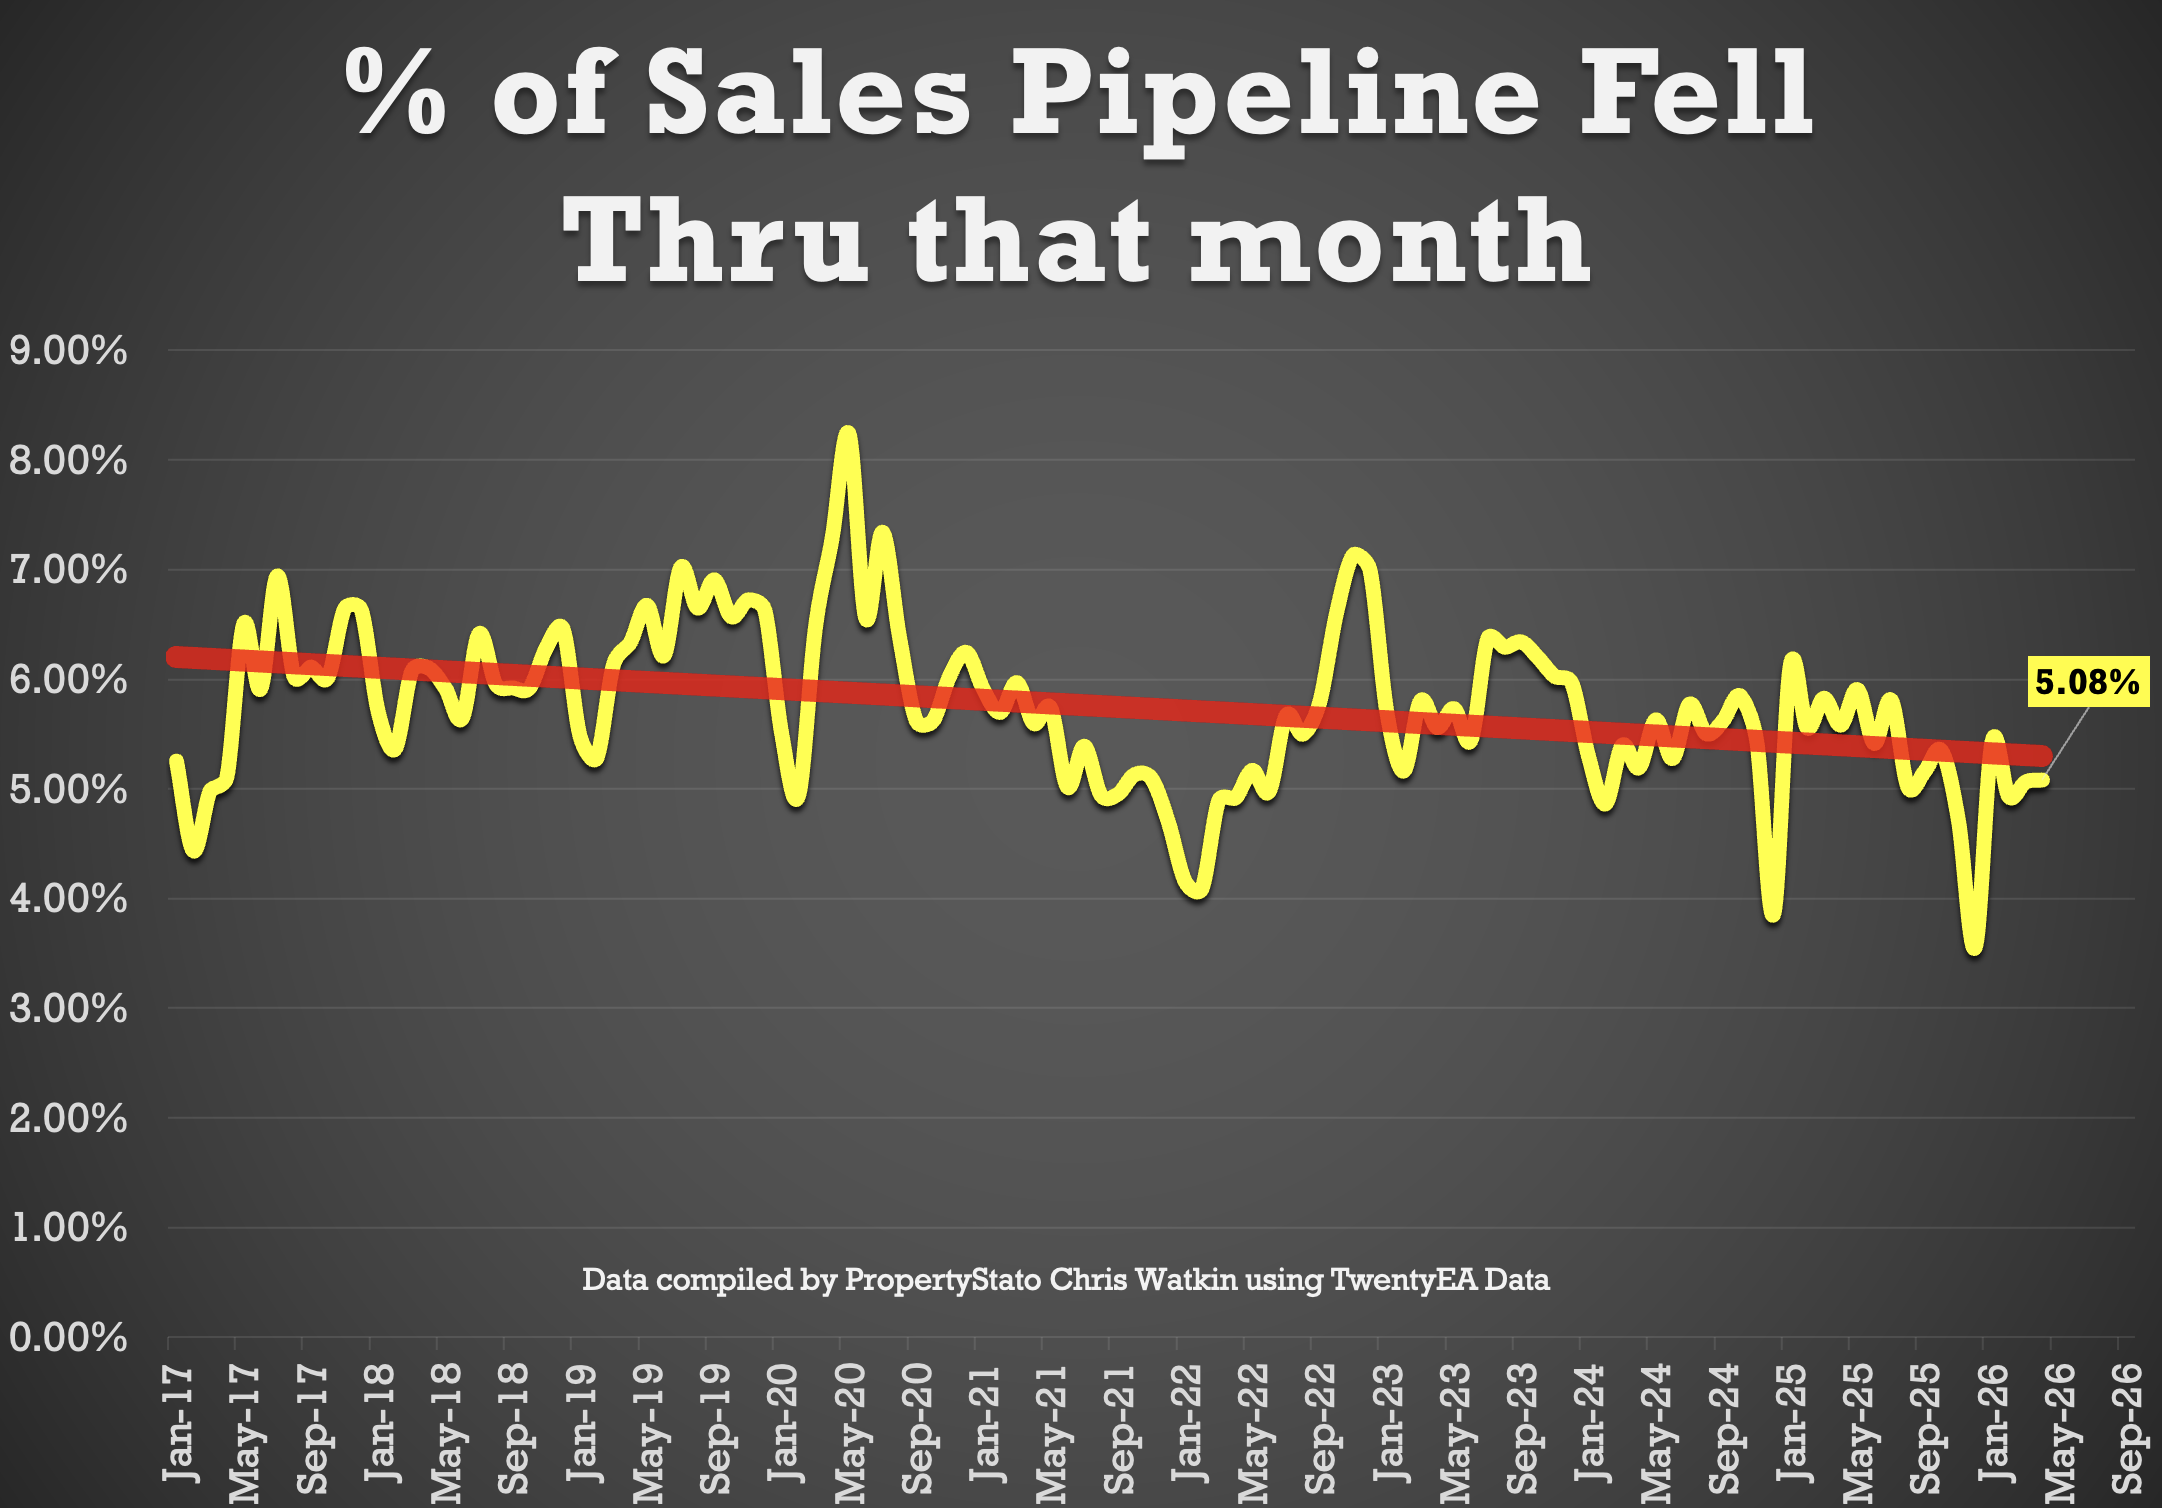
• 5.08% of all the sales agreed in Estate Agent’s Sales pipelines fell thru in April 2026. 2025 average – 5.3% & 10 year average 5.8%).
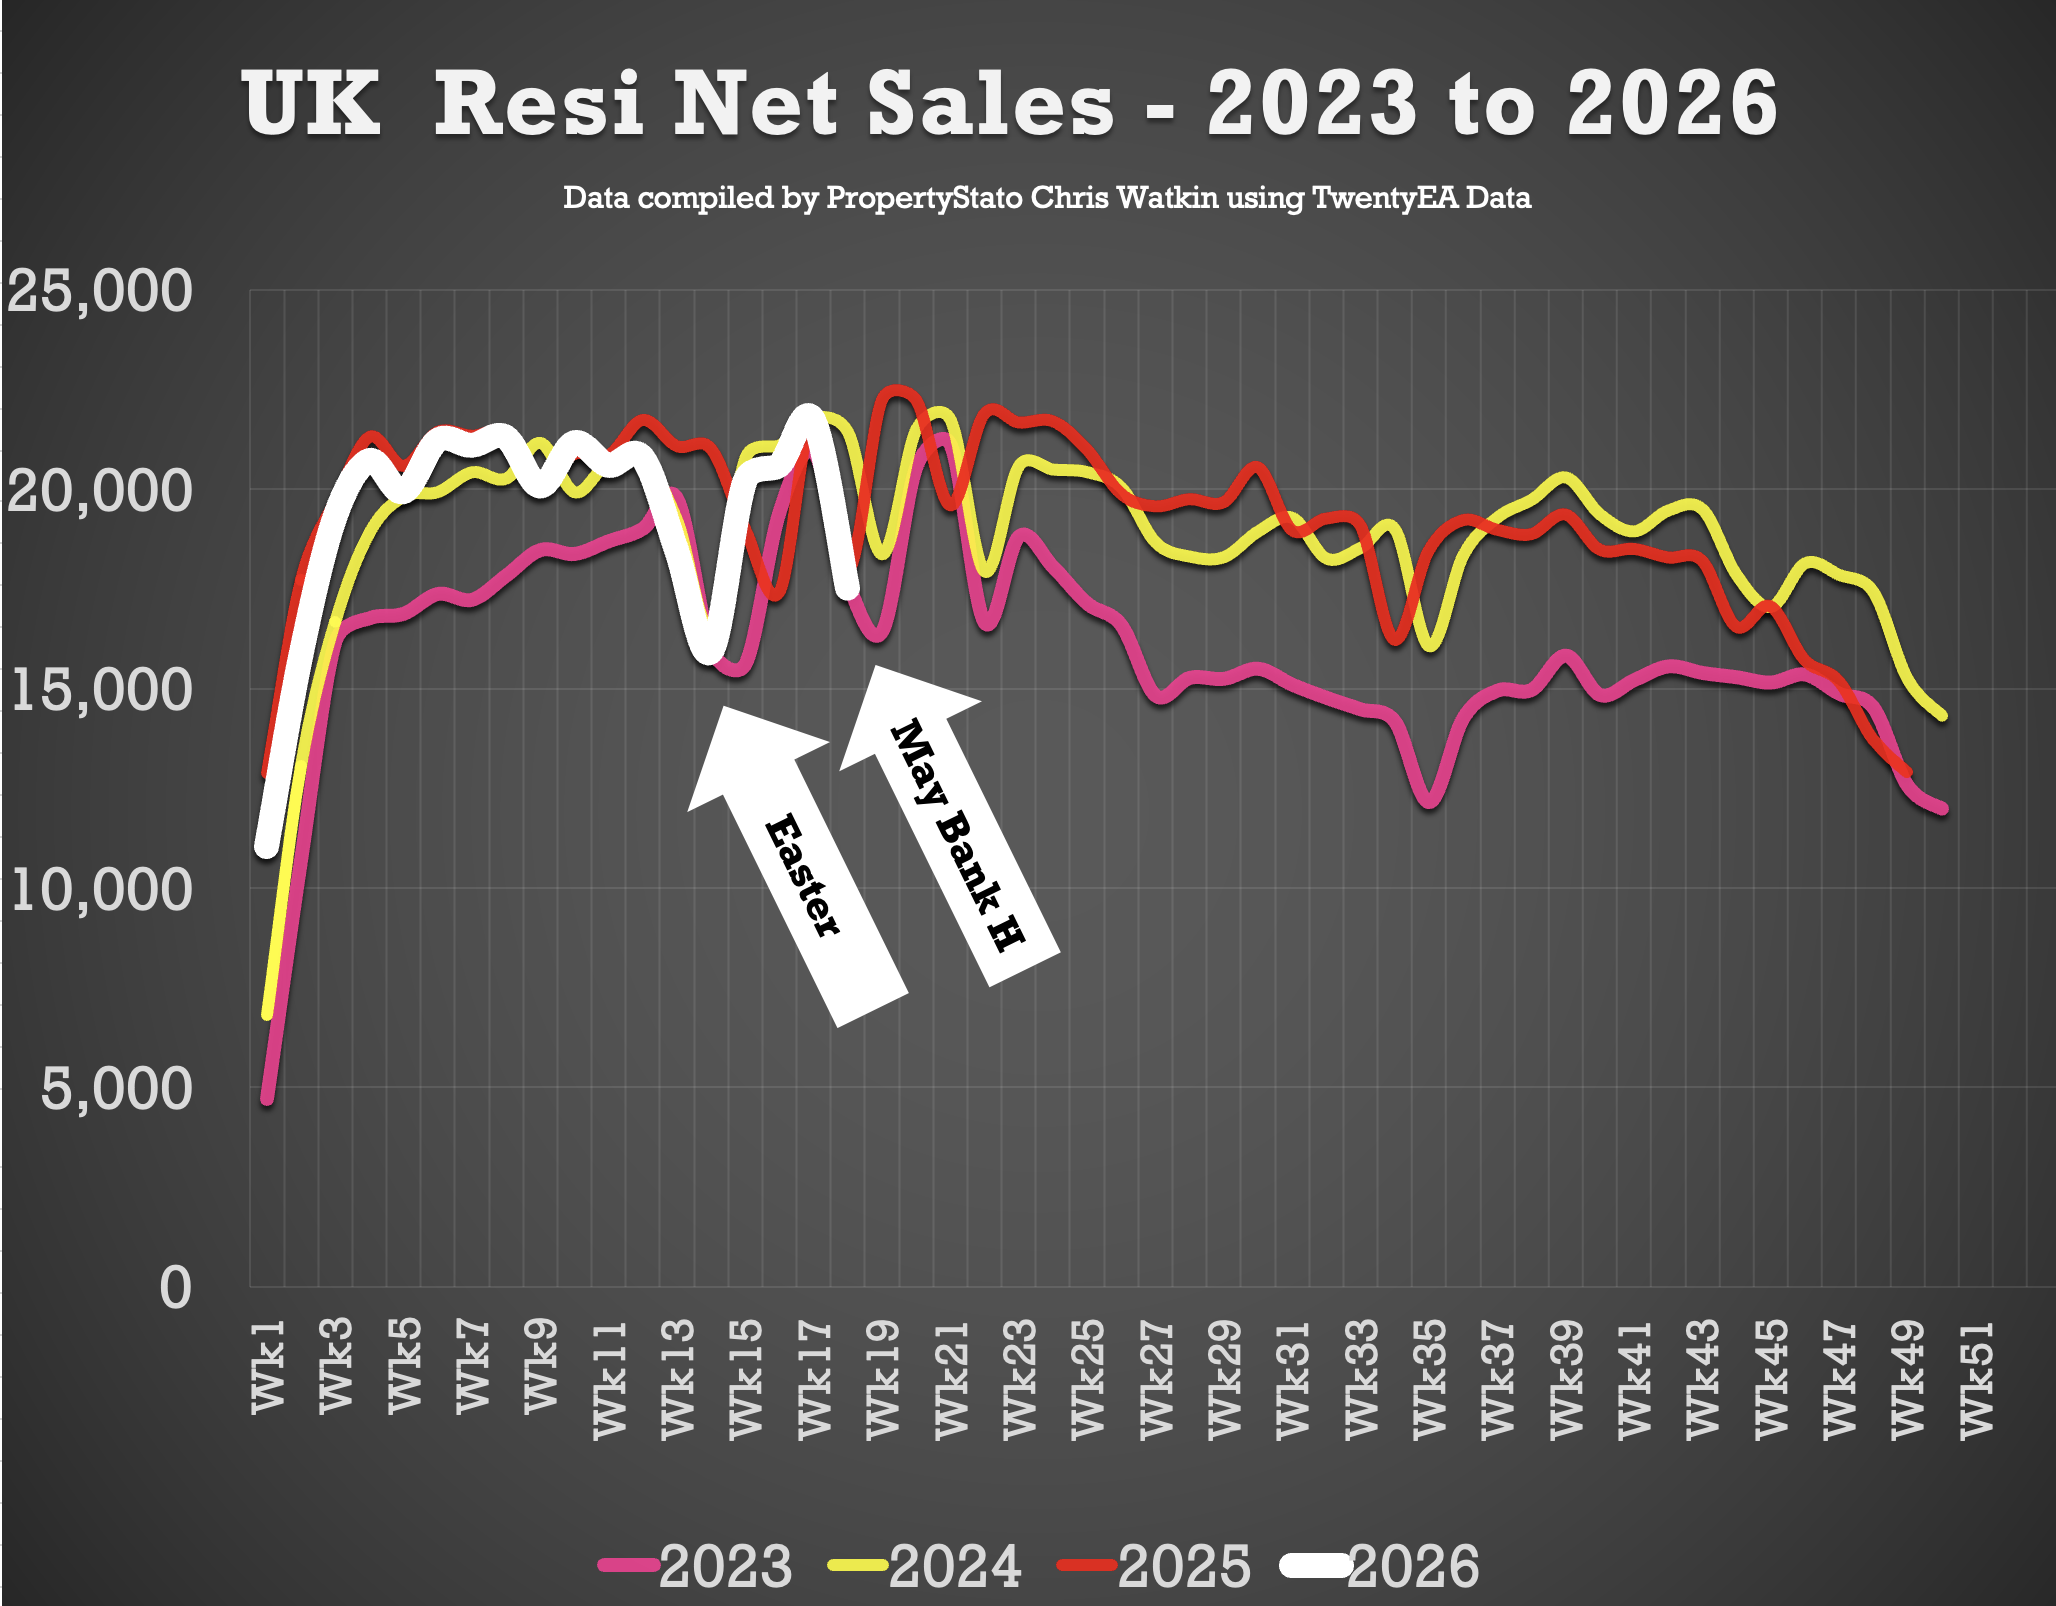
✅ Net Sales
• 21.7k Net Sales, up from 20.6k last week
• Ten-year Week 17 average: 19.8k.
• Weekly average for 2026: 19.4k.
• Weekly average for the whole of 2025: 18.8k.
✅ Probability of Selling (% that Exchange vs withdrawal)
• April 2026 Stats : 53.9% of homes that left agents’ books exchanged & completed in April. (Note this figure will change throughout the month as more April stats come in).
• 57.6% is the 7 year average (which includes the crazy years post lockdown 18 months)
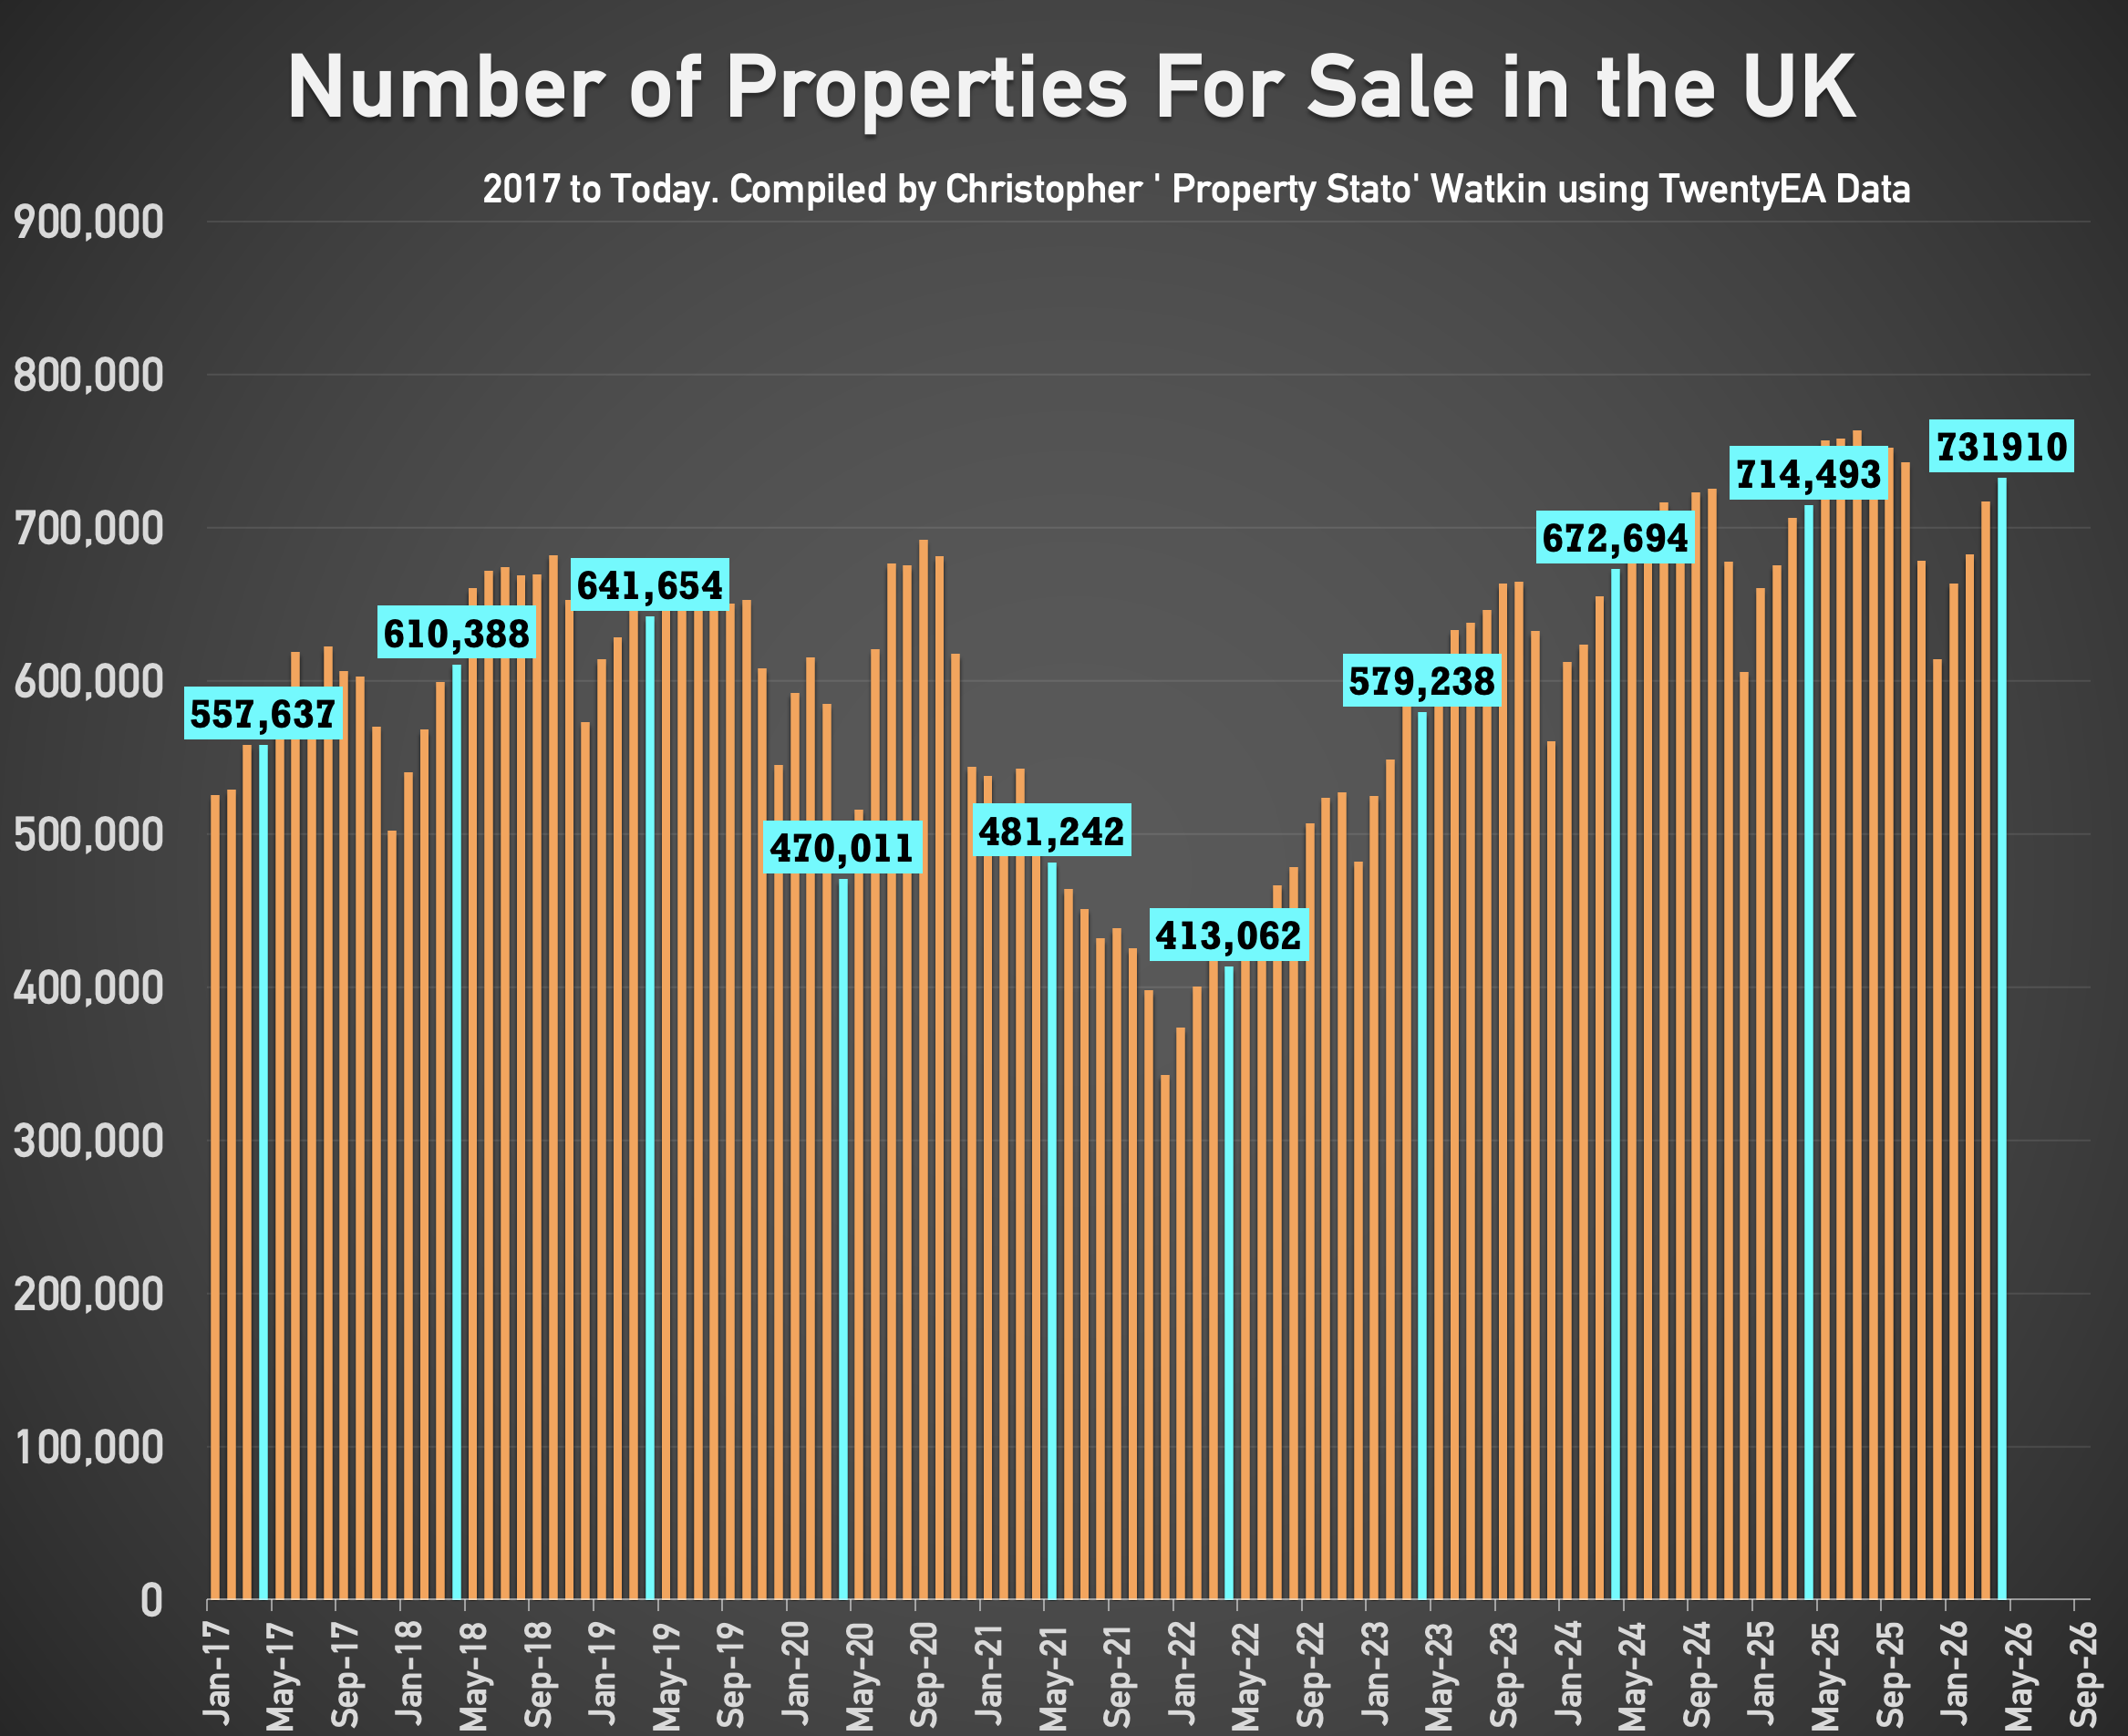
✅ Stock Levels
• 731k homes on the market on the 1st of May ’26. (714k – 1st May 25)
• 461k homes in agent’s sales pipeline on the 1st May 2026, slightly higher than 12 months ago on 1st May ’25 (447k).
✅ House Prices (£/sq.ft)
• April ’26 agreed sales averaged £345.18 per sq.ft. 1.8% higher than 12 months ago (£339.10) and 11.3% than 5 years ago (£310.18).
The £/sqft at sale agreed matches the HM Land Registry Index with a 98% accuracy, 5 months in advance. That is why it is so important.
✅ UK Rental Data
• Average Rent in Wk 18 – £1,748 pcm
• Average Rent in April 2026 – £1,778 pcm (£1,700 in April 25)
• Average Rent in YTD 2026 – £1,737 pcm
• 302k UK Rental Stock available to rent in April 26 (303k in April 2025)

 This week’s edition of the UK Property Market Stats examines the latest housing market trends across Britain, alongside a detailed look at estate agency performance in one of London’s most competitive markets.
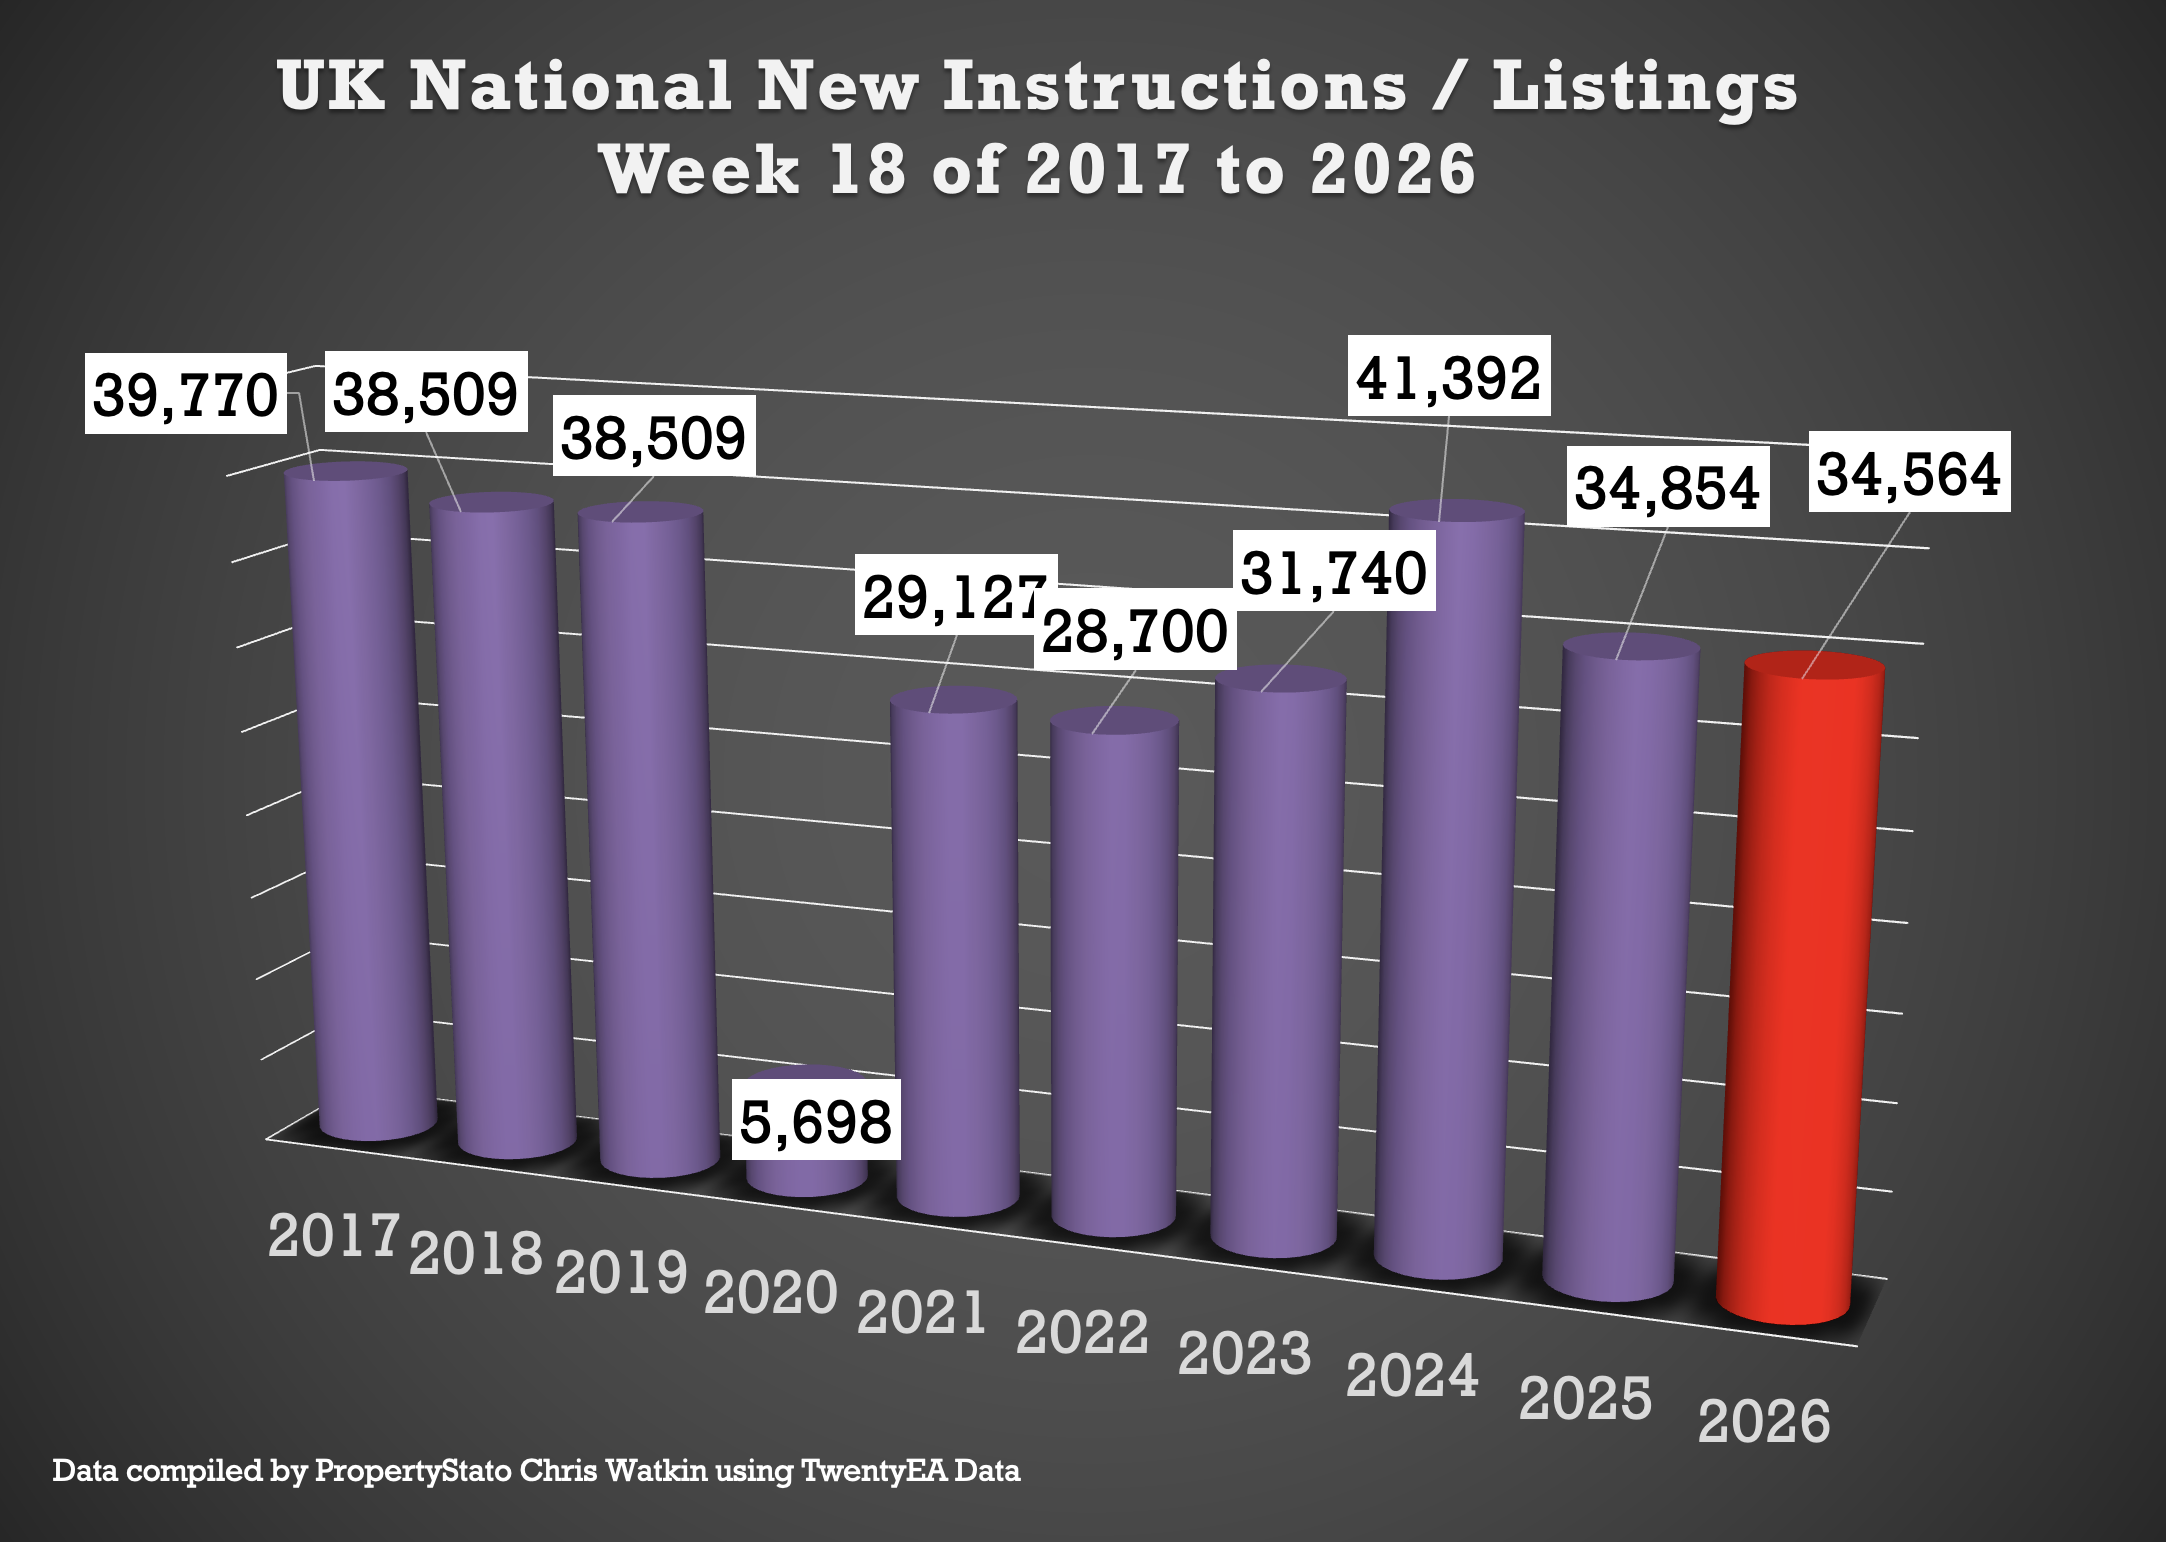


