


 In the latest episode of the UK Property Market Stats Show, I’m joined by Alice Bullard of Nested to examine the key housing market trends from the week ending Sunday 10 May 2026 (Week 18).
We begin by analysing the latest sales, listings and price movement data from across the UK property market, including why the market delivered its second-strongest week for sales so far this year despite ongoing economic and geopolitical uncertainty.
In the second half of the show, we turn our attention to Notting Hill, where we assess the performance of local estate and letting agents to determine who is leading the market.
While the case study focuses on one London hotspot, the methodology has relevance for agents everywhere. In a market where overvaluing and fee discounting remain common tactics, the analysis demonstrates how agents can use hard performance data to differentiate themselves from competitors, win more instructions and justify stronger fee levels.
UK Property Market Weekly Update for Week 20 of 2026
The 60 minute show is split into two parts.
Part 1 analyses live UK property market data from the last week, cutting through doom headlines and outdated indices.
Part 2 deep dives into a local market, this week Crystal Palace, examining estate agent performance, market share, overvaluing, exchanges, fall throughs and time to sell.
In essence, it combines national market insight with local analysis to reveal what is really happening behind the headlines. For estate agents, it is part market intelligence, part thought leadership and part uncomfortable truth.
🟥 Listings
Week 20 ..
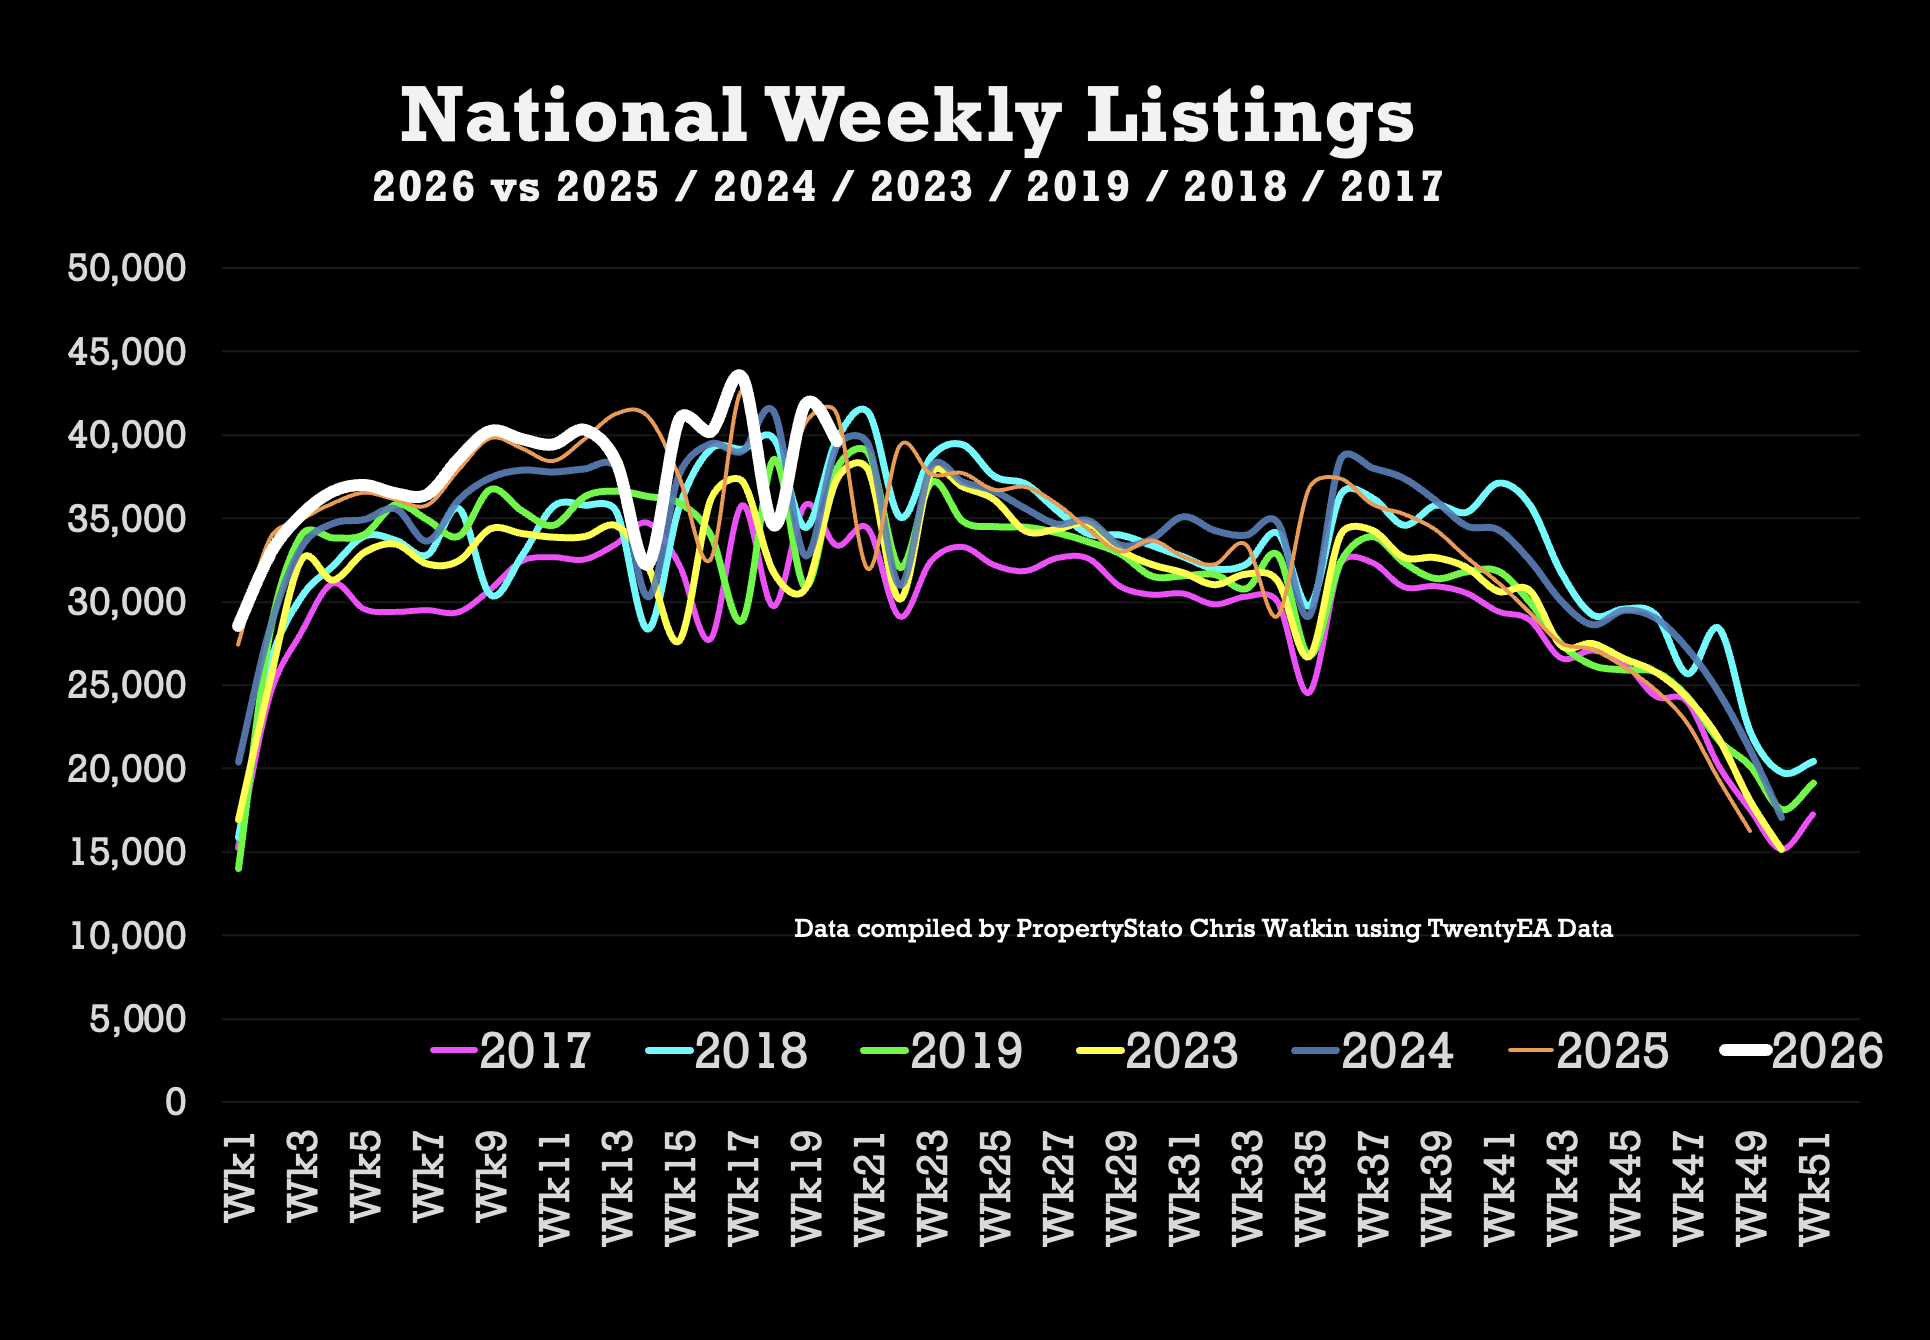
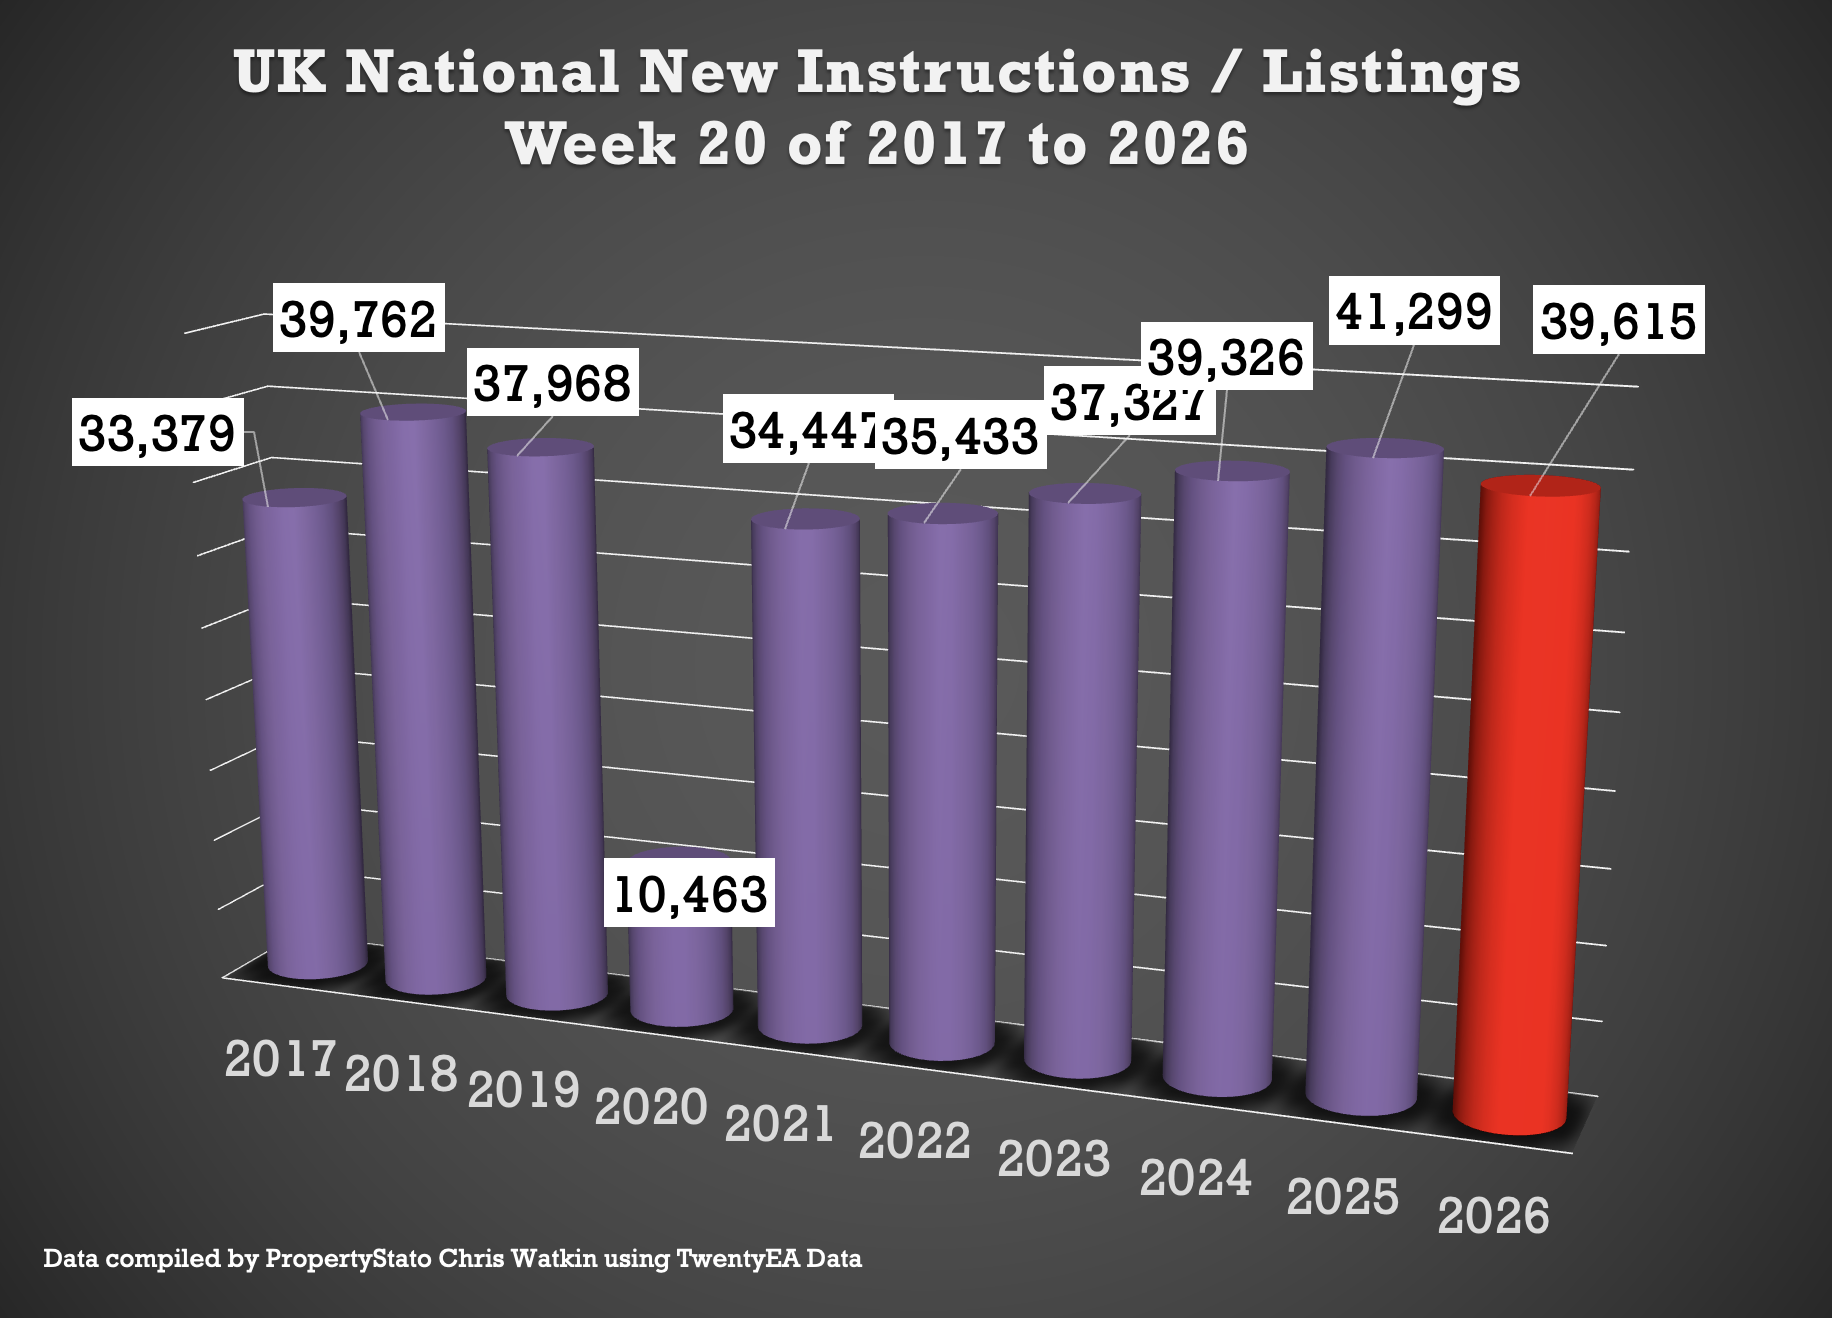
39.6k new listings this week, (41.8k last week).
Weekly 2026 average : 37.6k.
10 year week 20 average : 34.9k
Year to Date
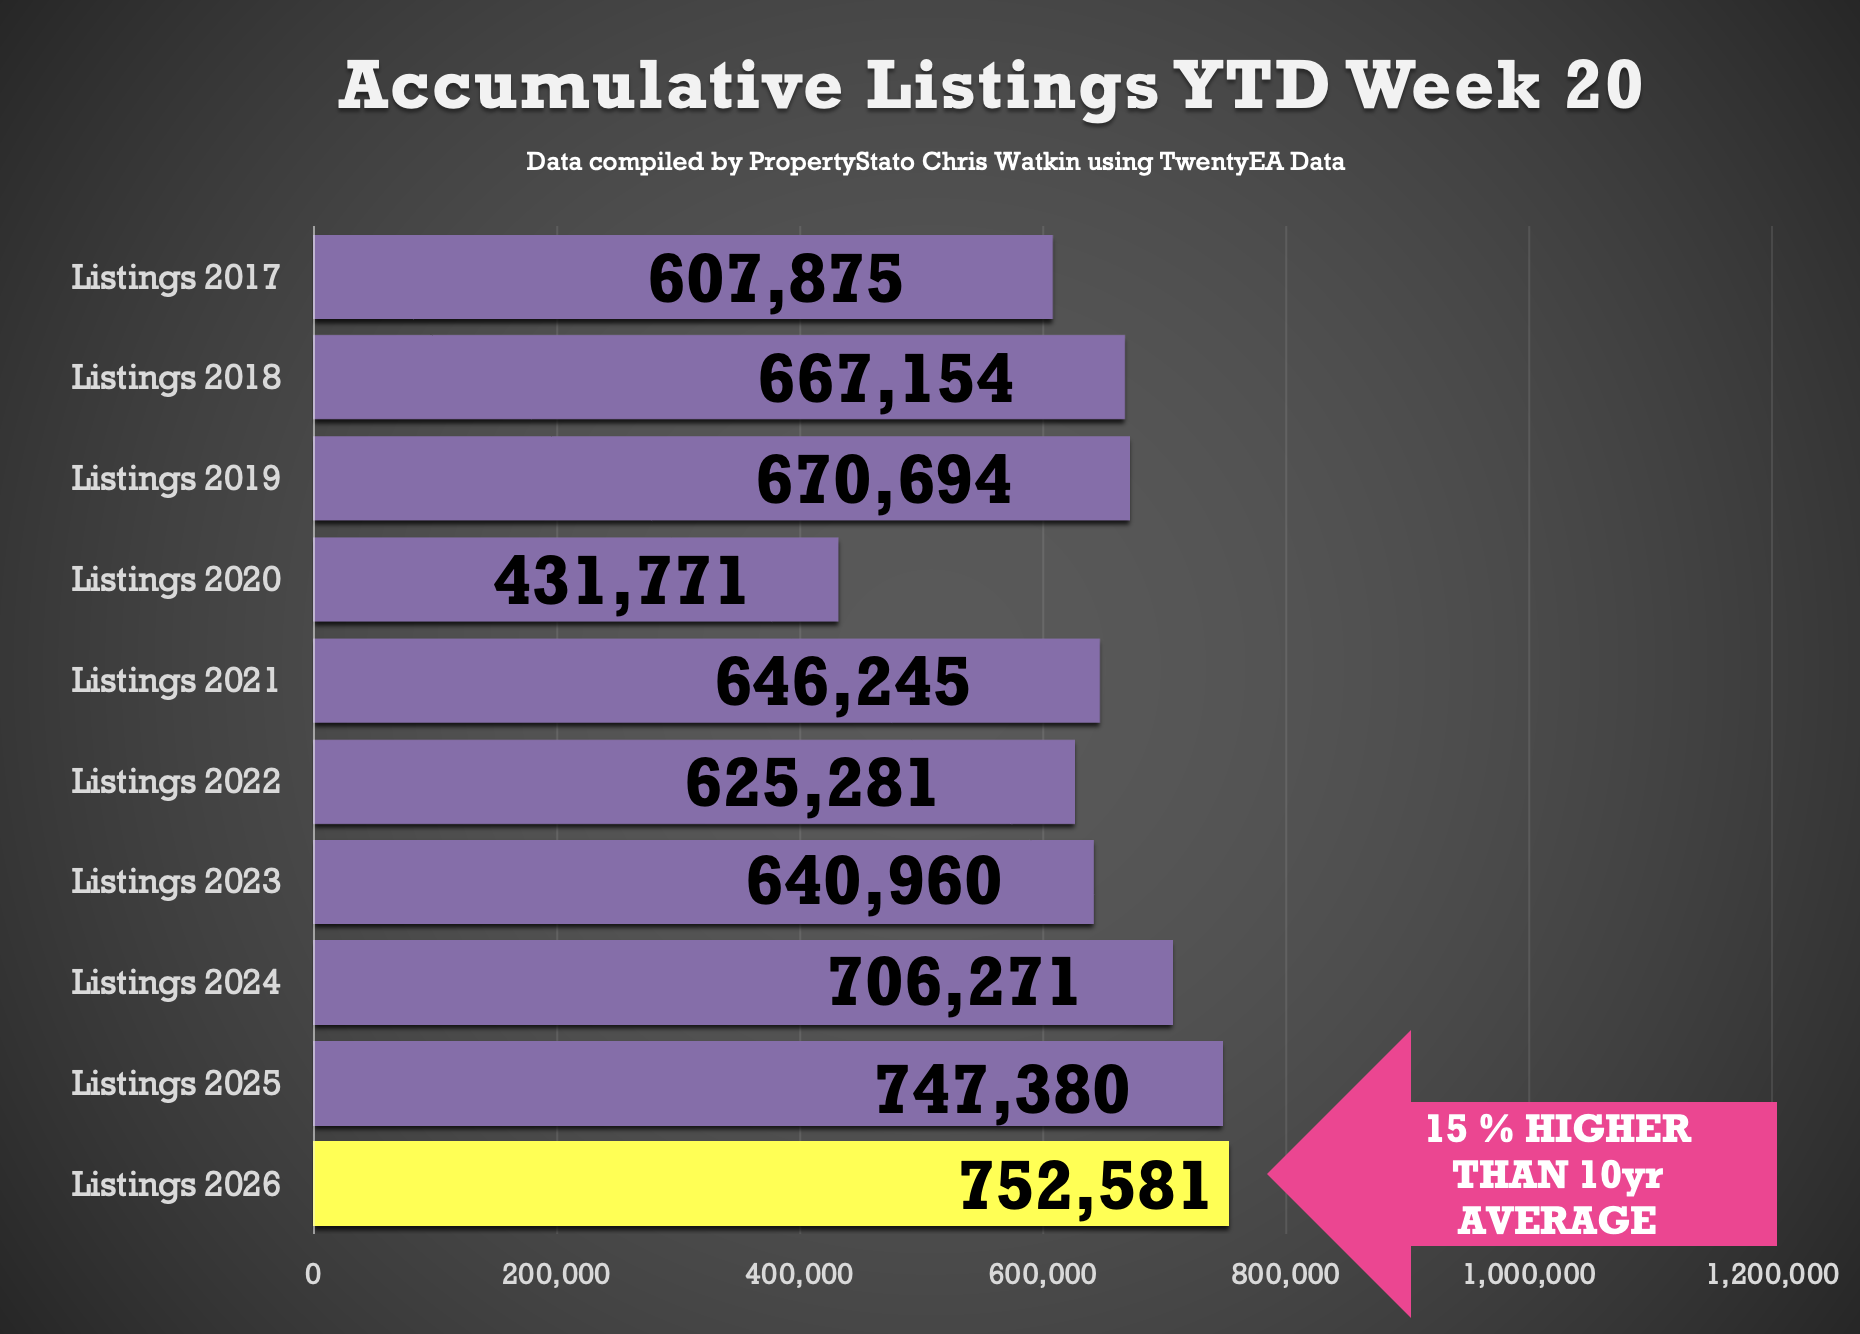
753k new listings YTD
0.7% ahead of 2025 YTD (747k)
6.6% ahead of 2024 YTD (706k)
16% higher than the 2017–19 average YTD (649k).
🟩 Price Reductions
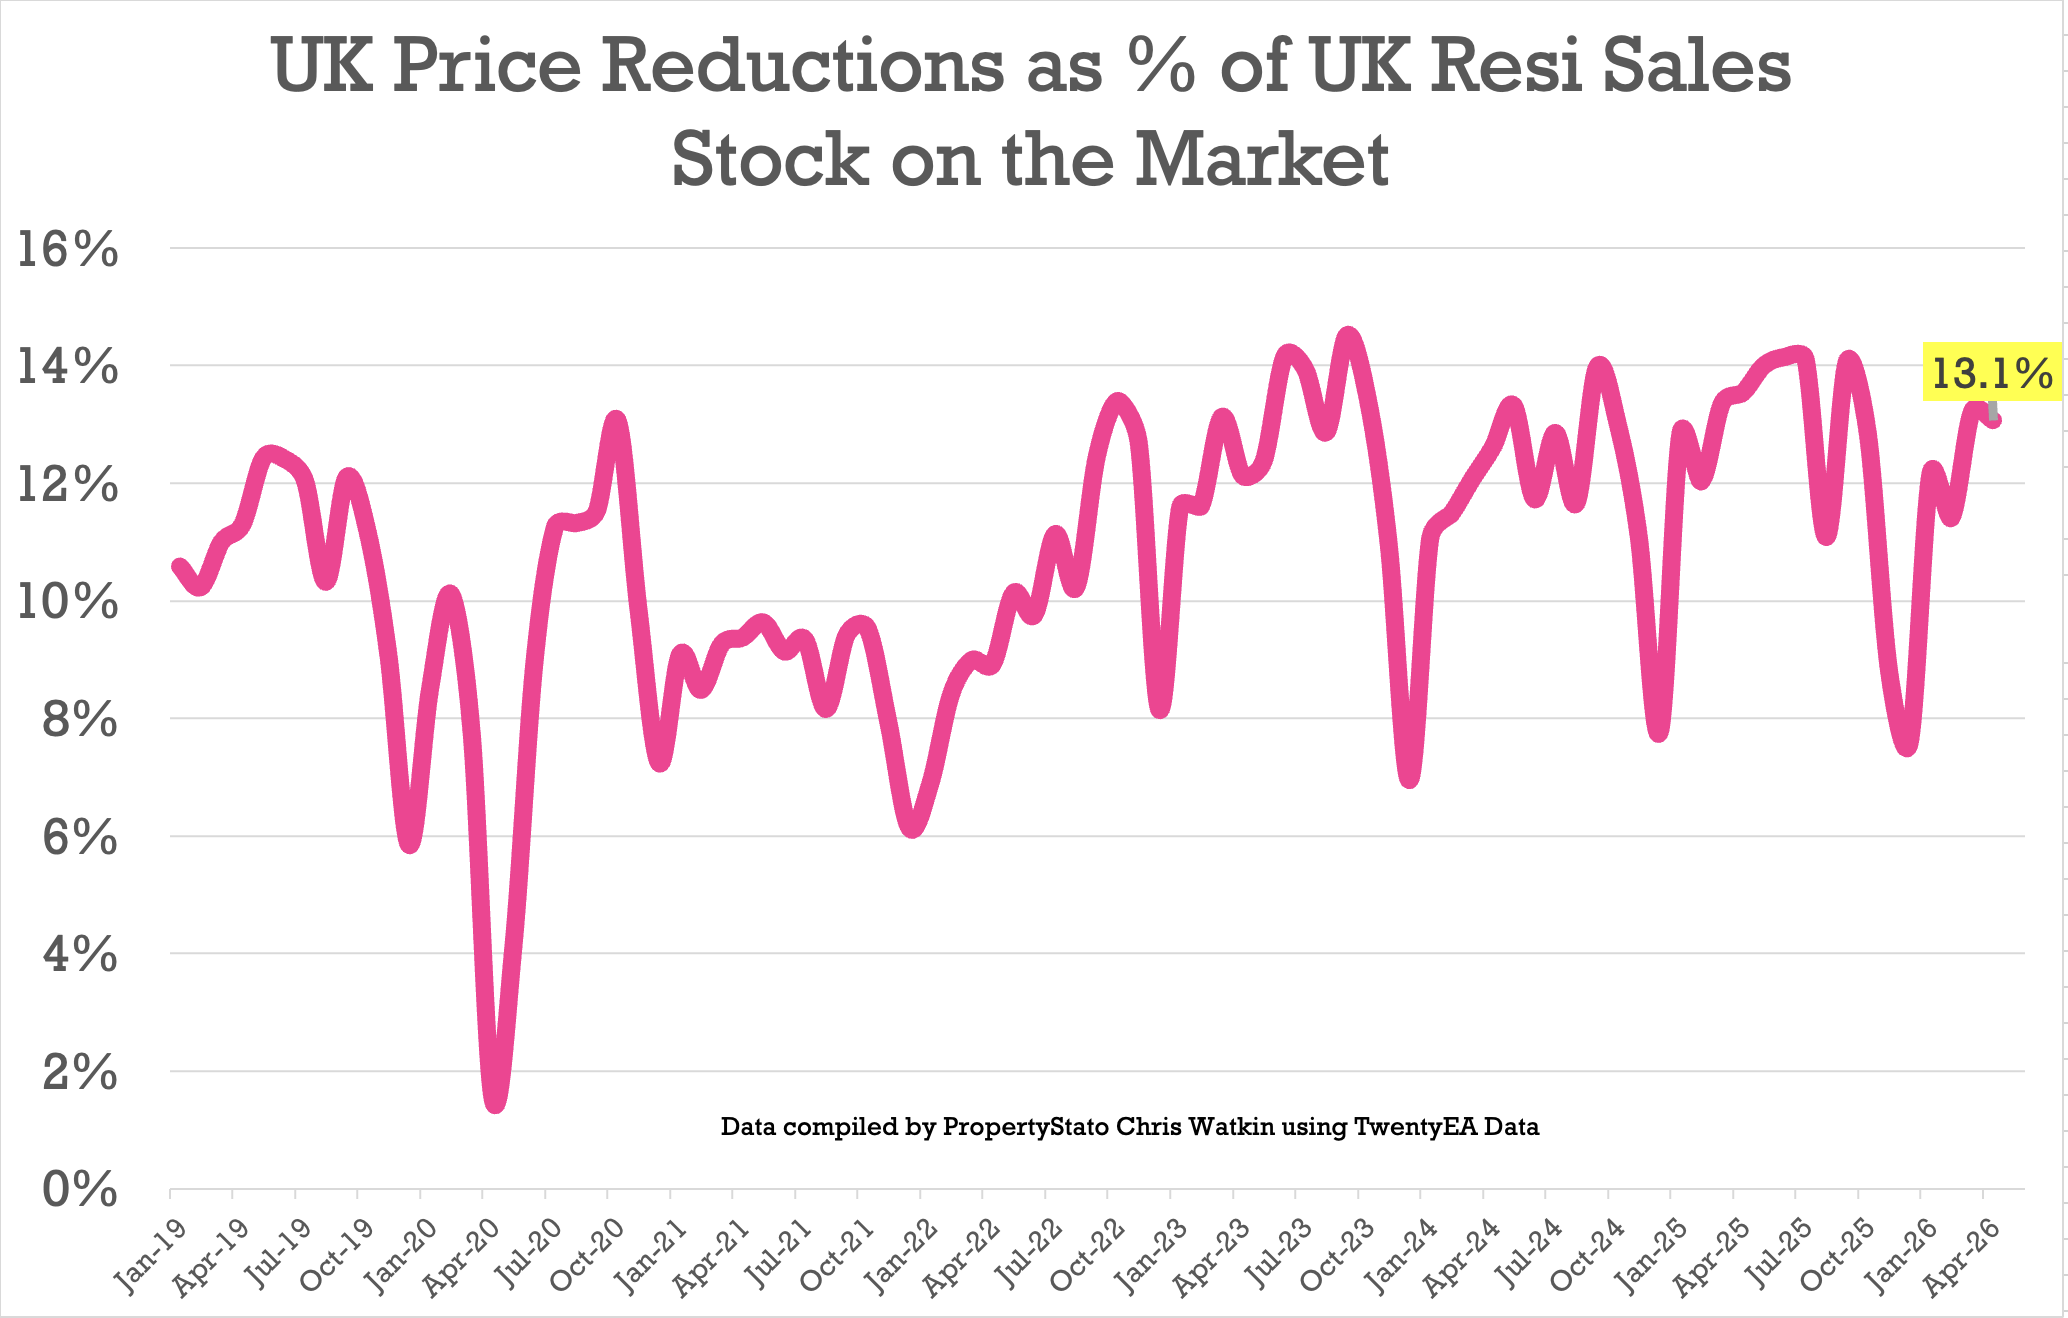
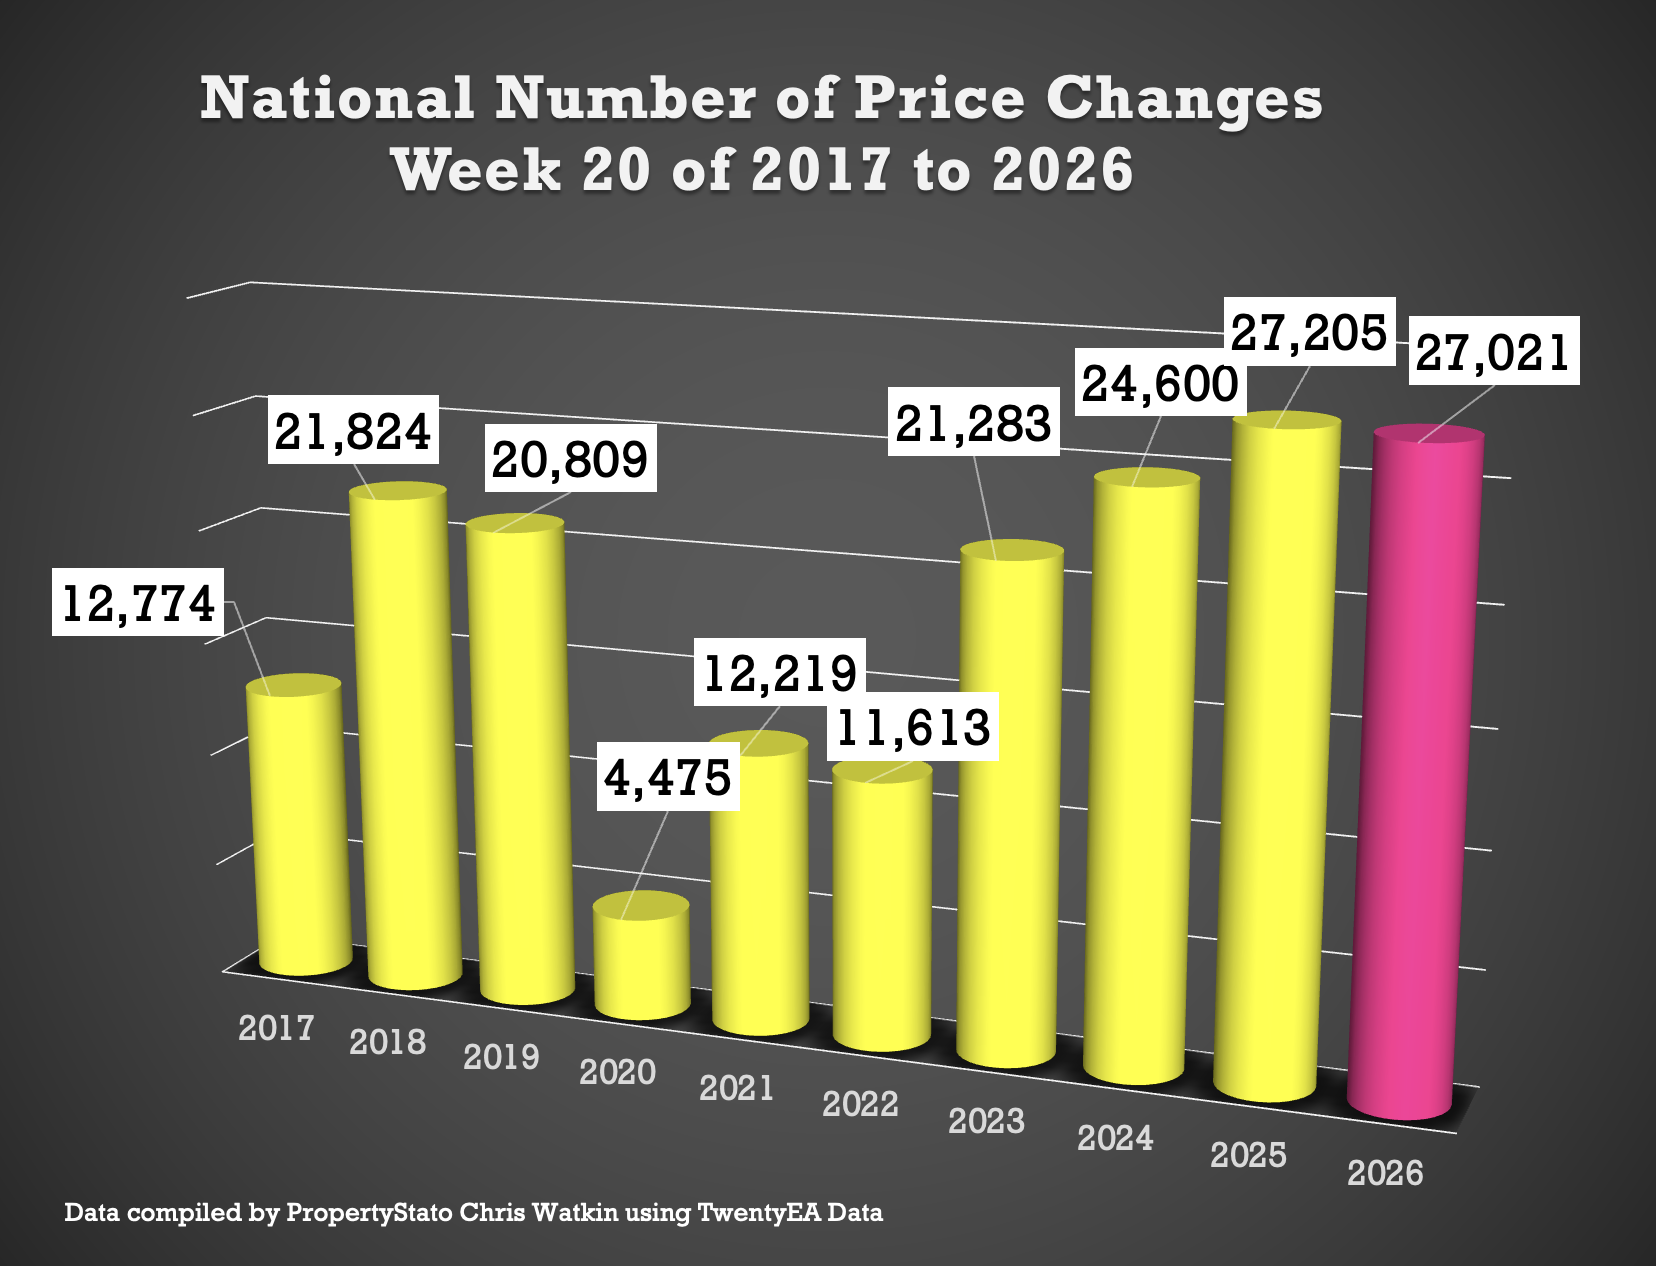
• 27.2k reductions this week on a 731k UK homes for sale
• 13.1% of UK homes for sale were reduced in April. Mar 26 was 13.2%.
• 2025 average 12.8%, versus the 6-year long-term average of 10.7%.
🟥 UK Gross Resi Sales
Week 20
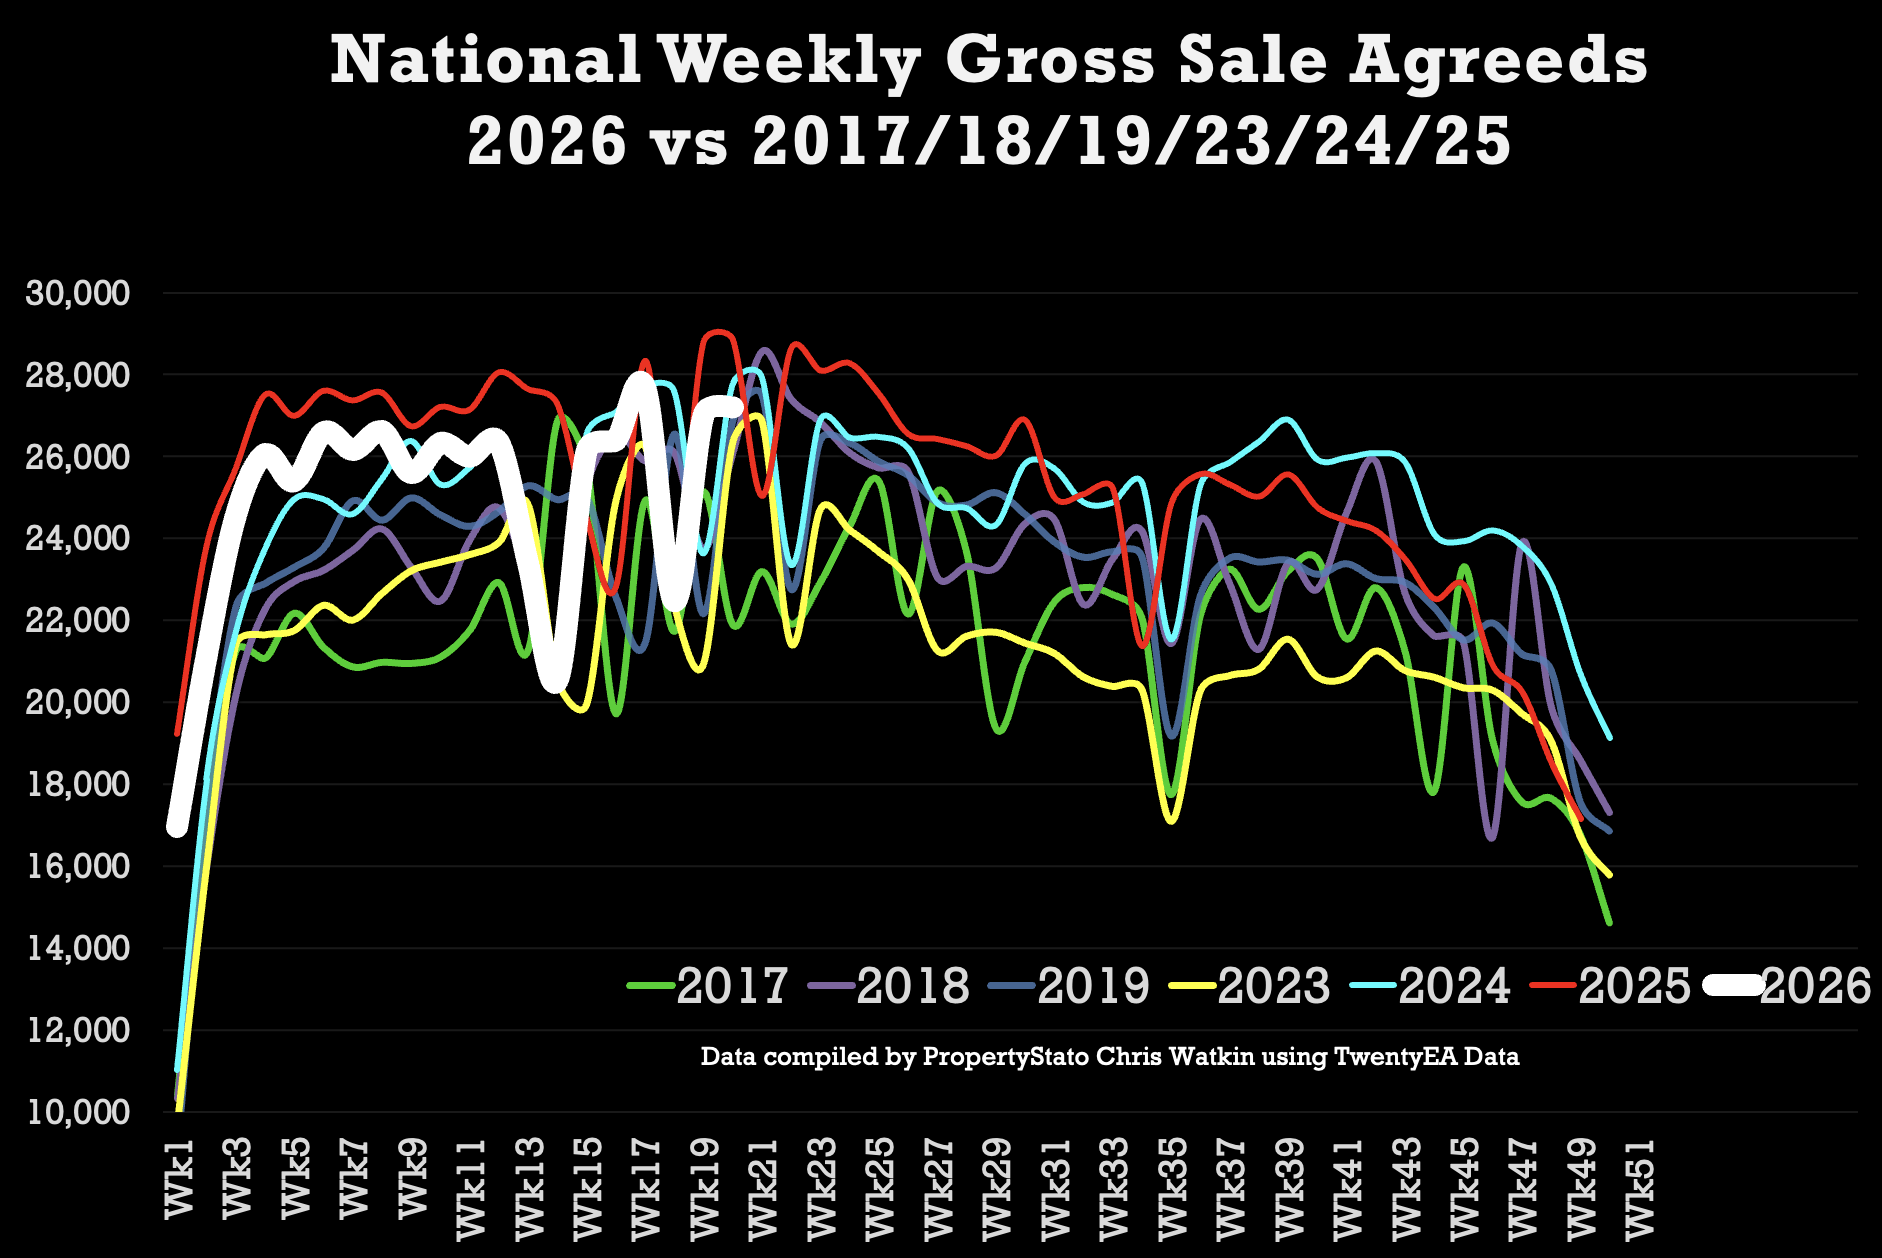
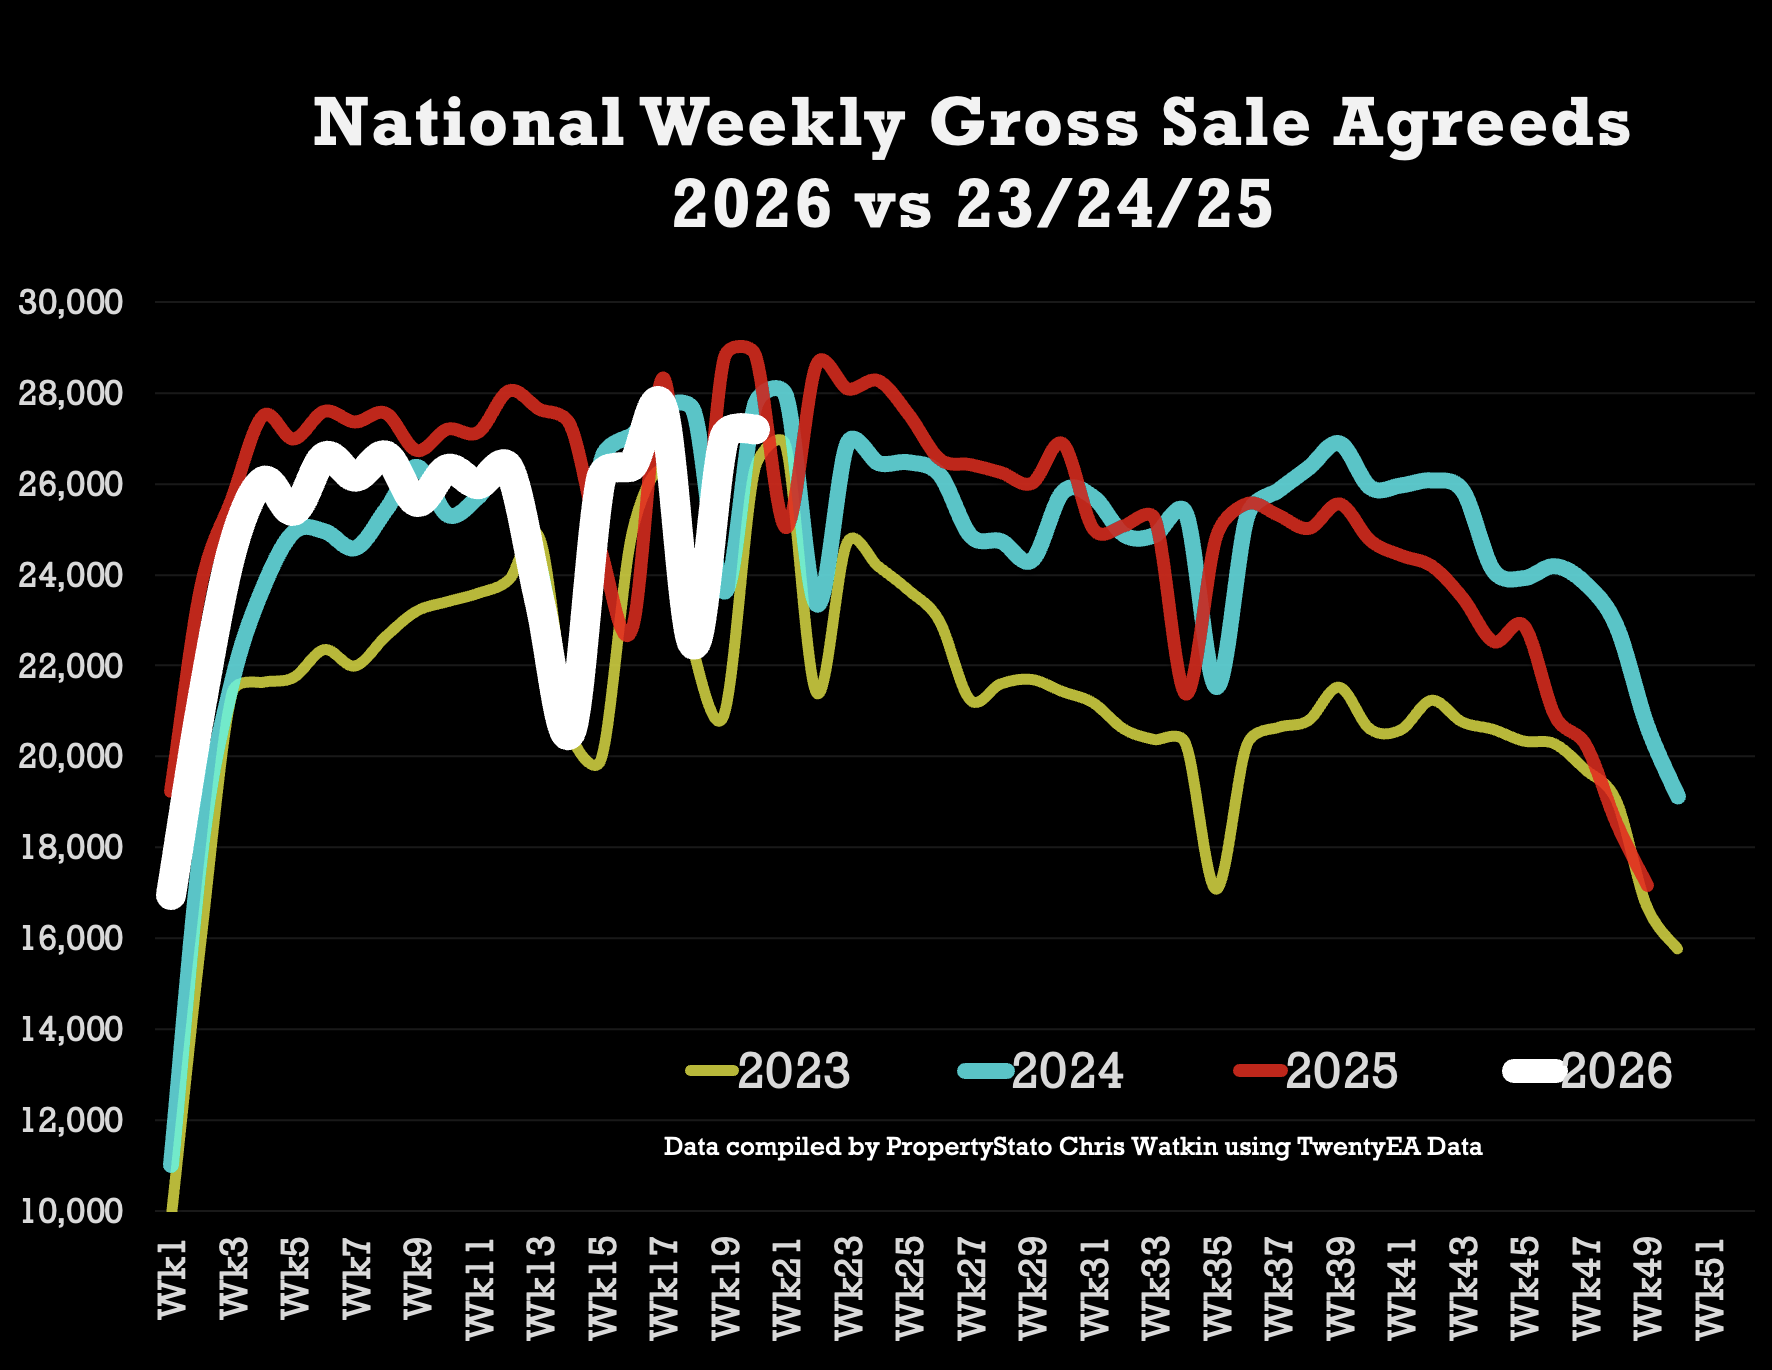
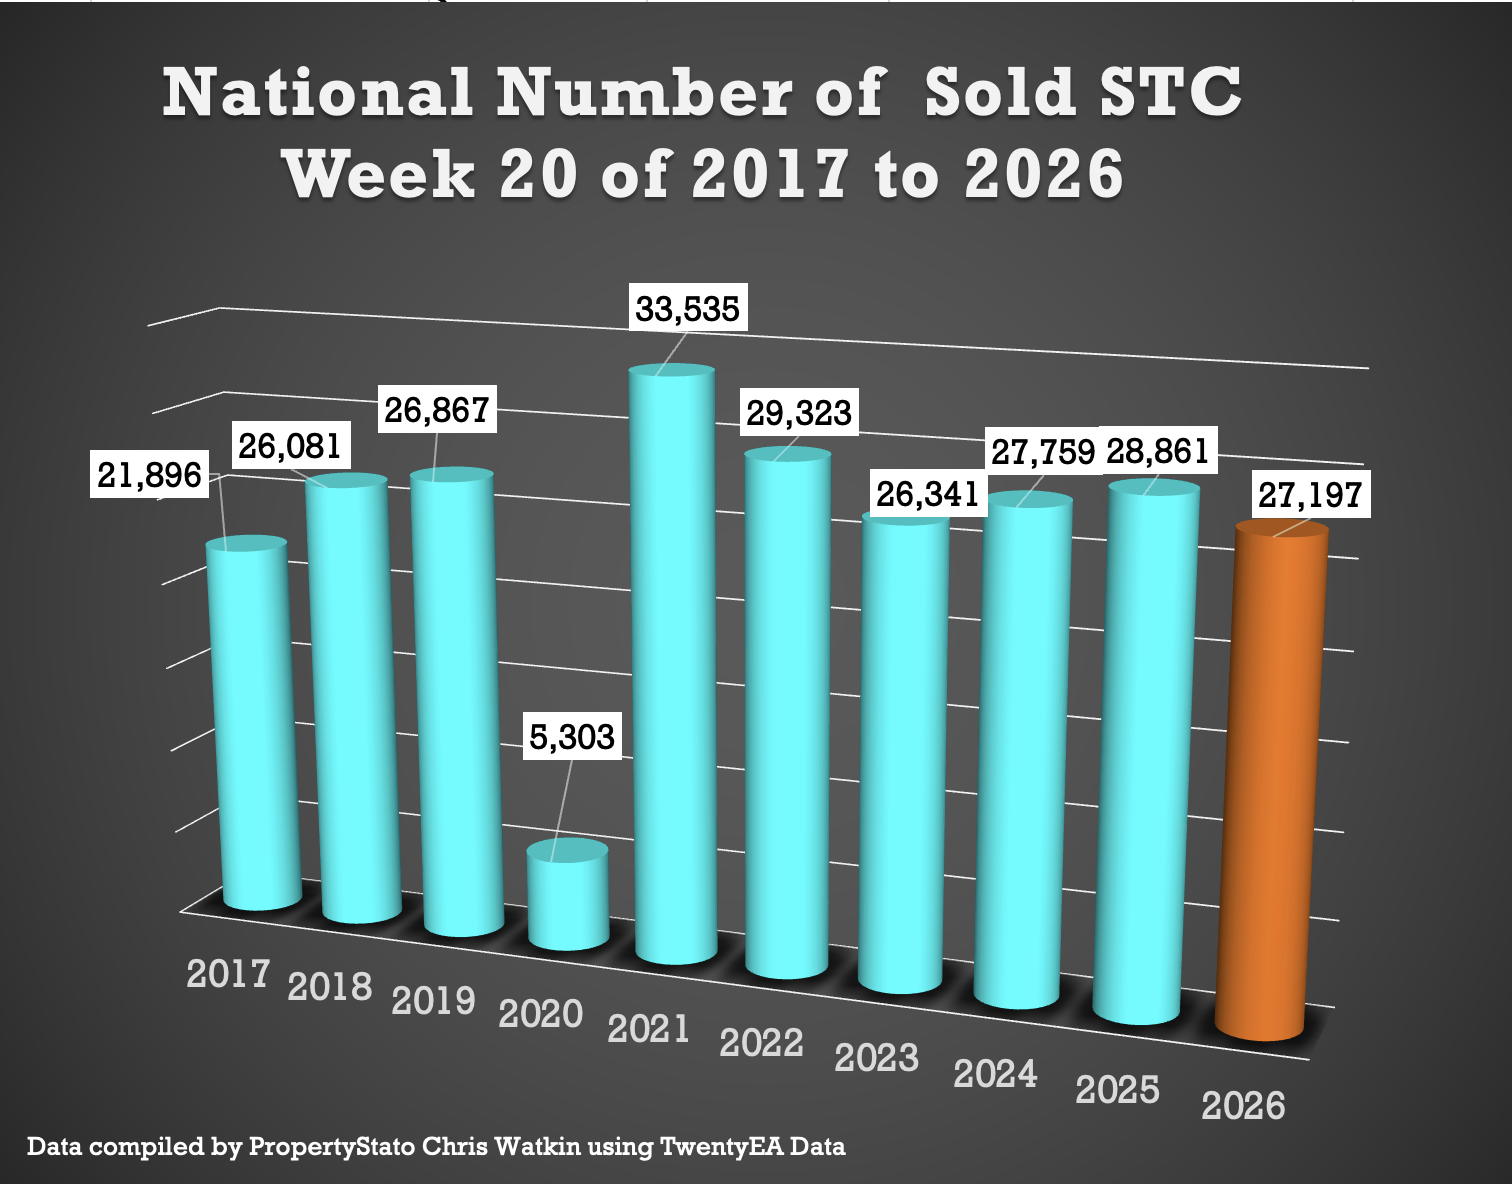
27.2k homes sold stc this week 20 (27k last week)
10 year week 20 average : 25.3k
2026 weekly average : 24.9k.
Year to Date
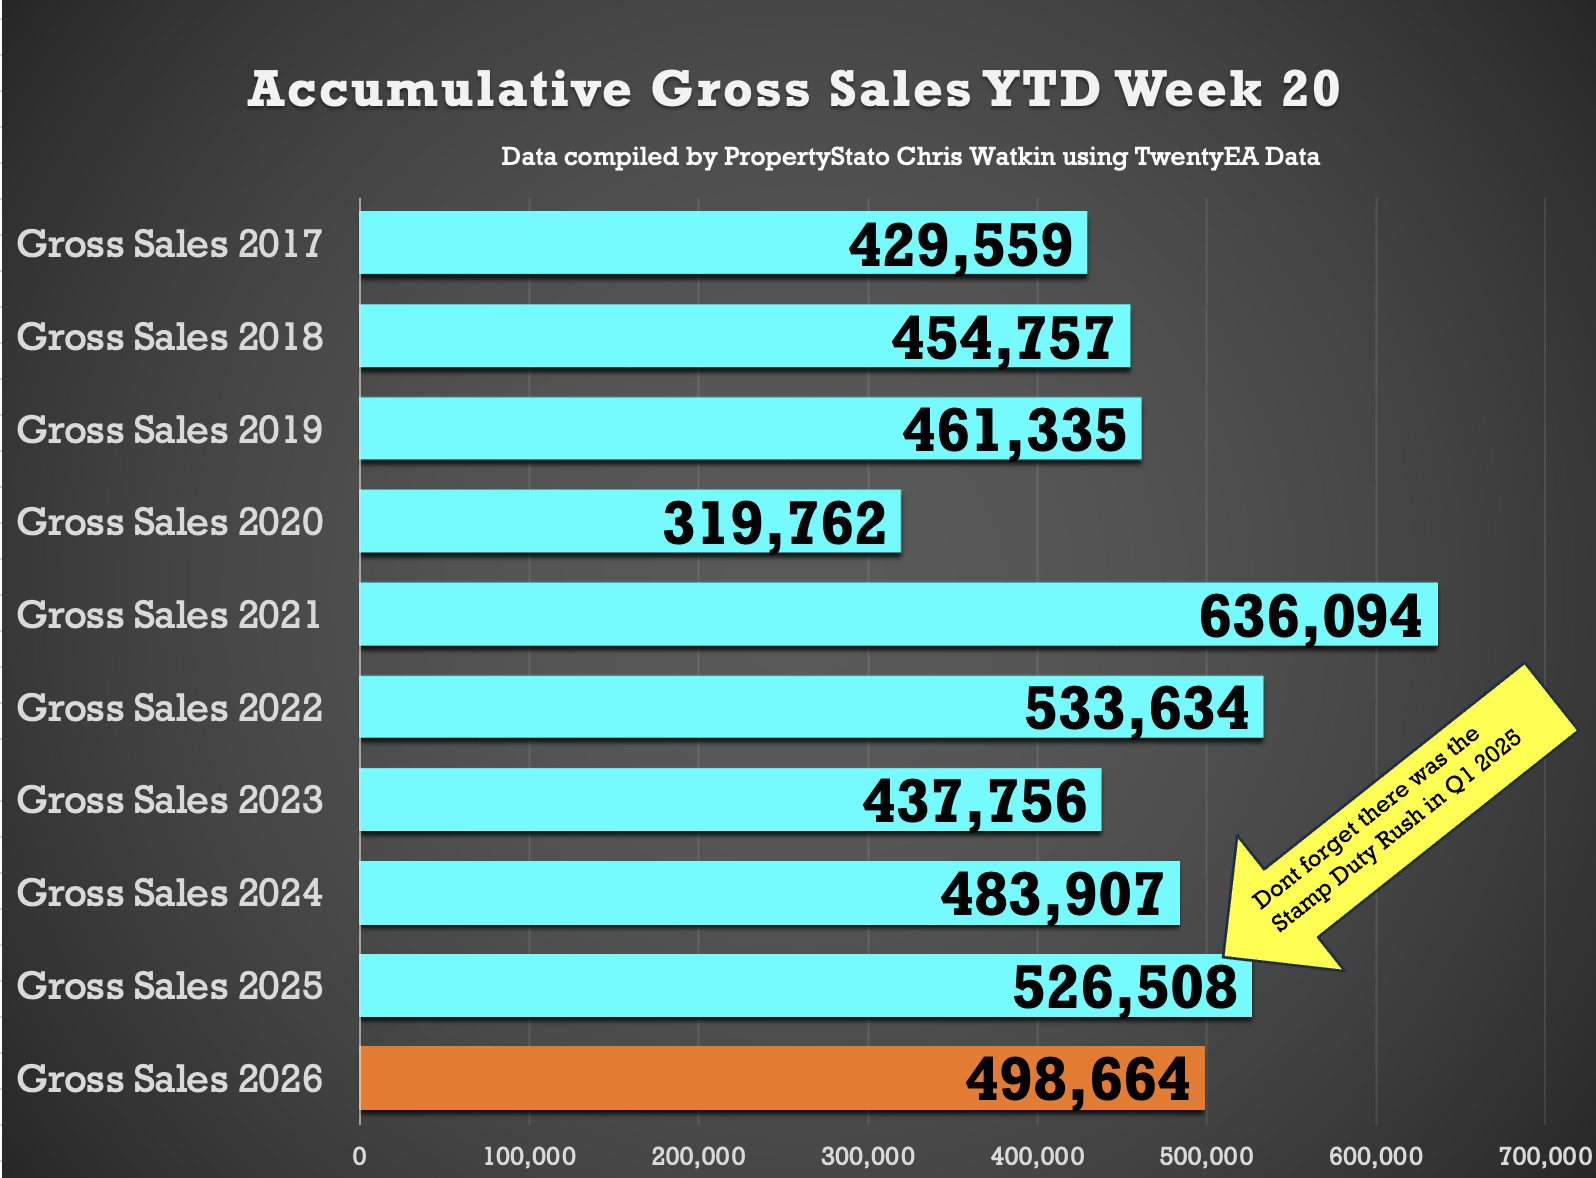
499k UK homes sold stc YTD
5.3% lower than 2025 YTD (527k)
3% higher than 2024 YTD(484k)
13.9% higher than 2023 YTD(438k)
11.2% higher above pre Covid 2017-19 years(449k).
🟩 Price Difference between Asking Price of Listings & Asking Price of those Homes that go Sold stc
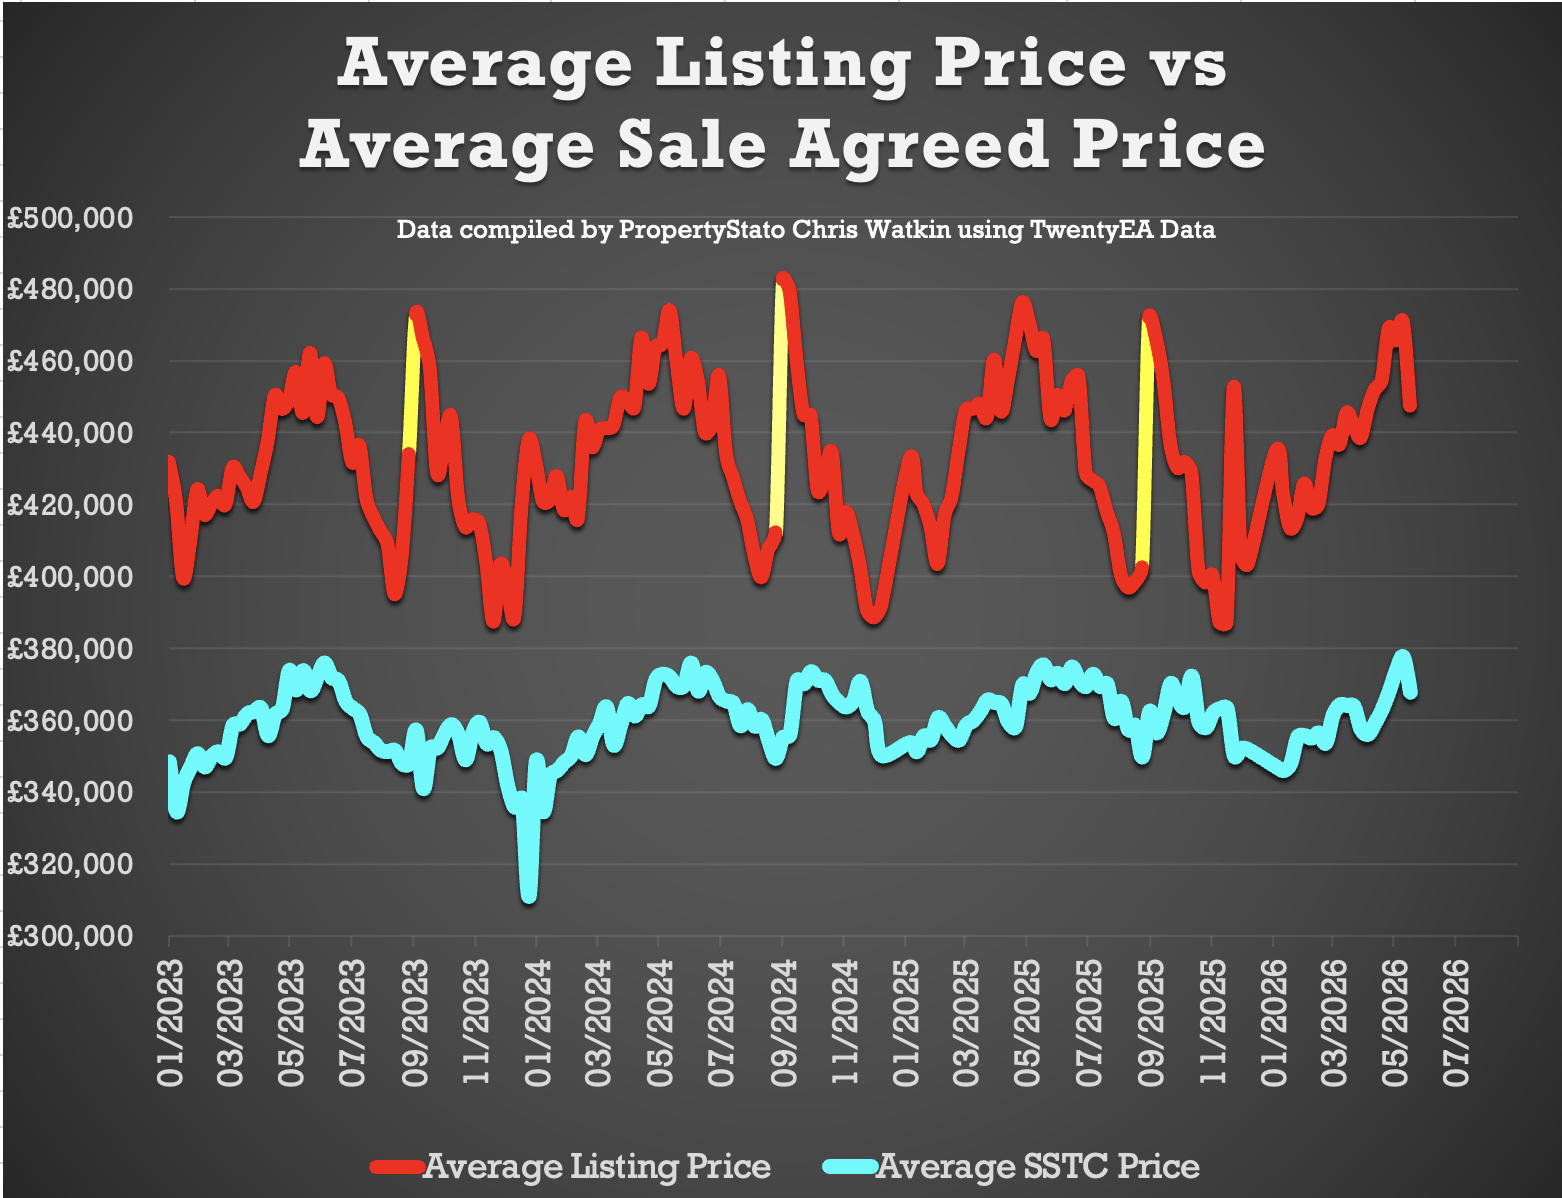
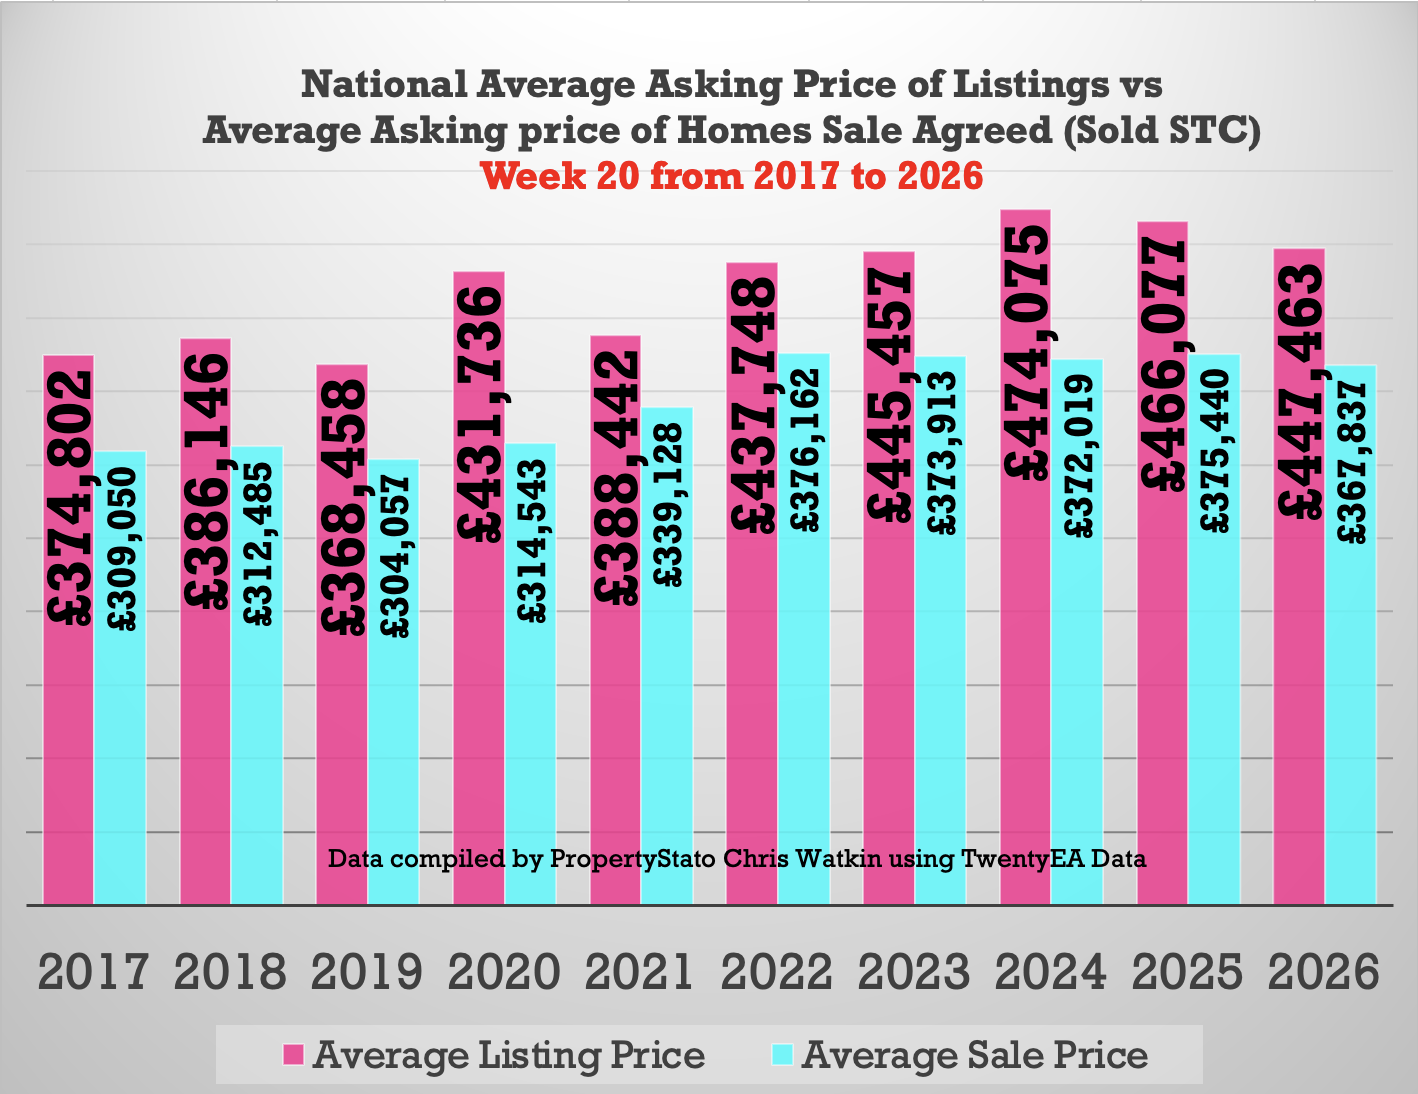
• 21.6% difference (long term 10 year average is 16% to 17%). (£447k ave Listing Ave Asking price vs £368k Sale Agreed ave Asking price).
🟥 Sell-Through Rate
• 14.6% of homes on agents’ books went SSTC in April ’26. Down from March ’26 – 15.5%
• Pre-Covid average: 15.5%. Graph 16
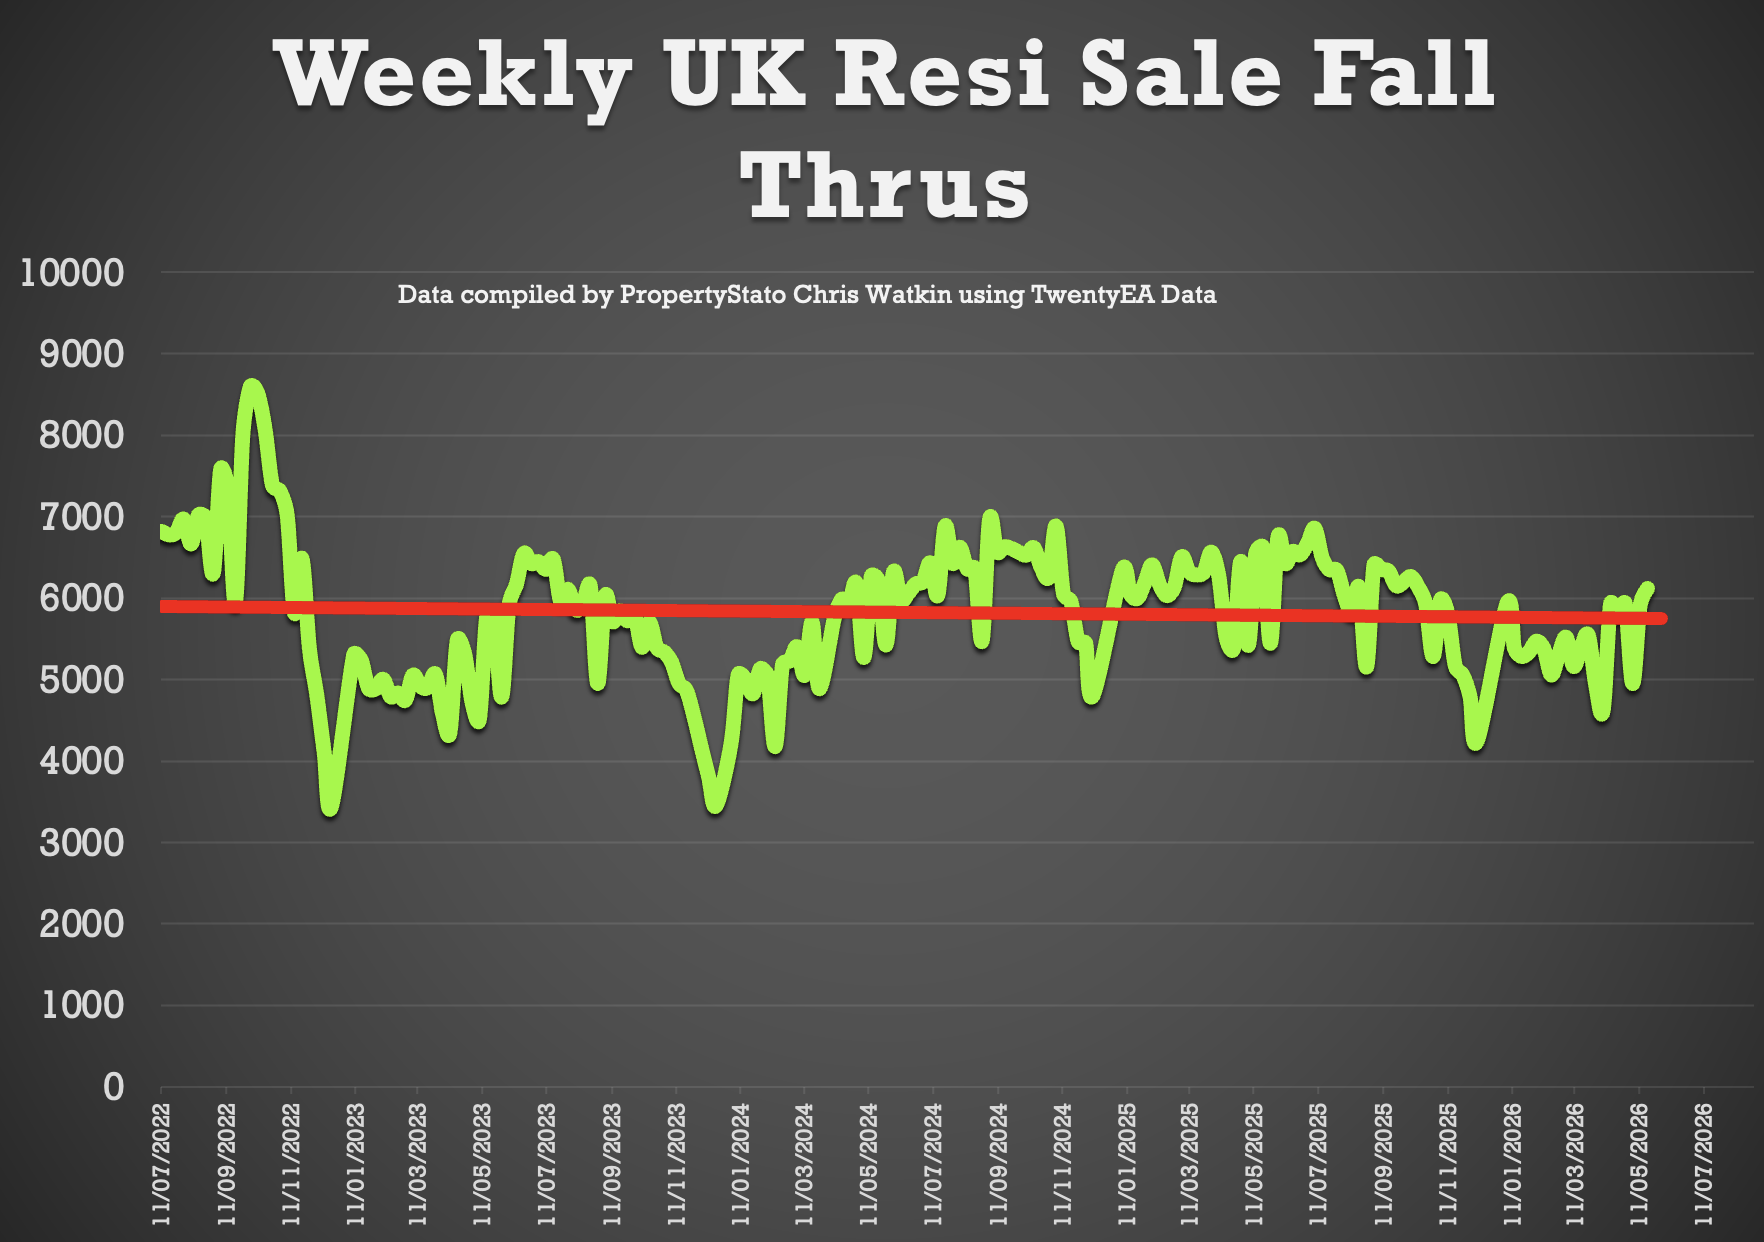
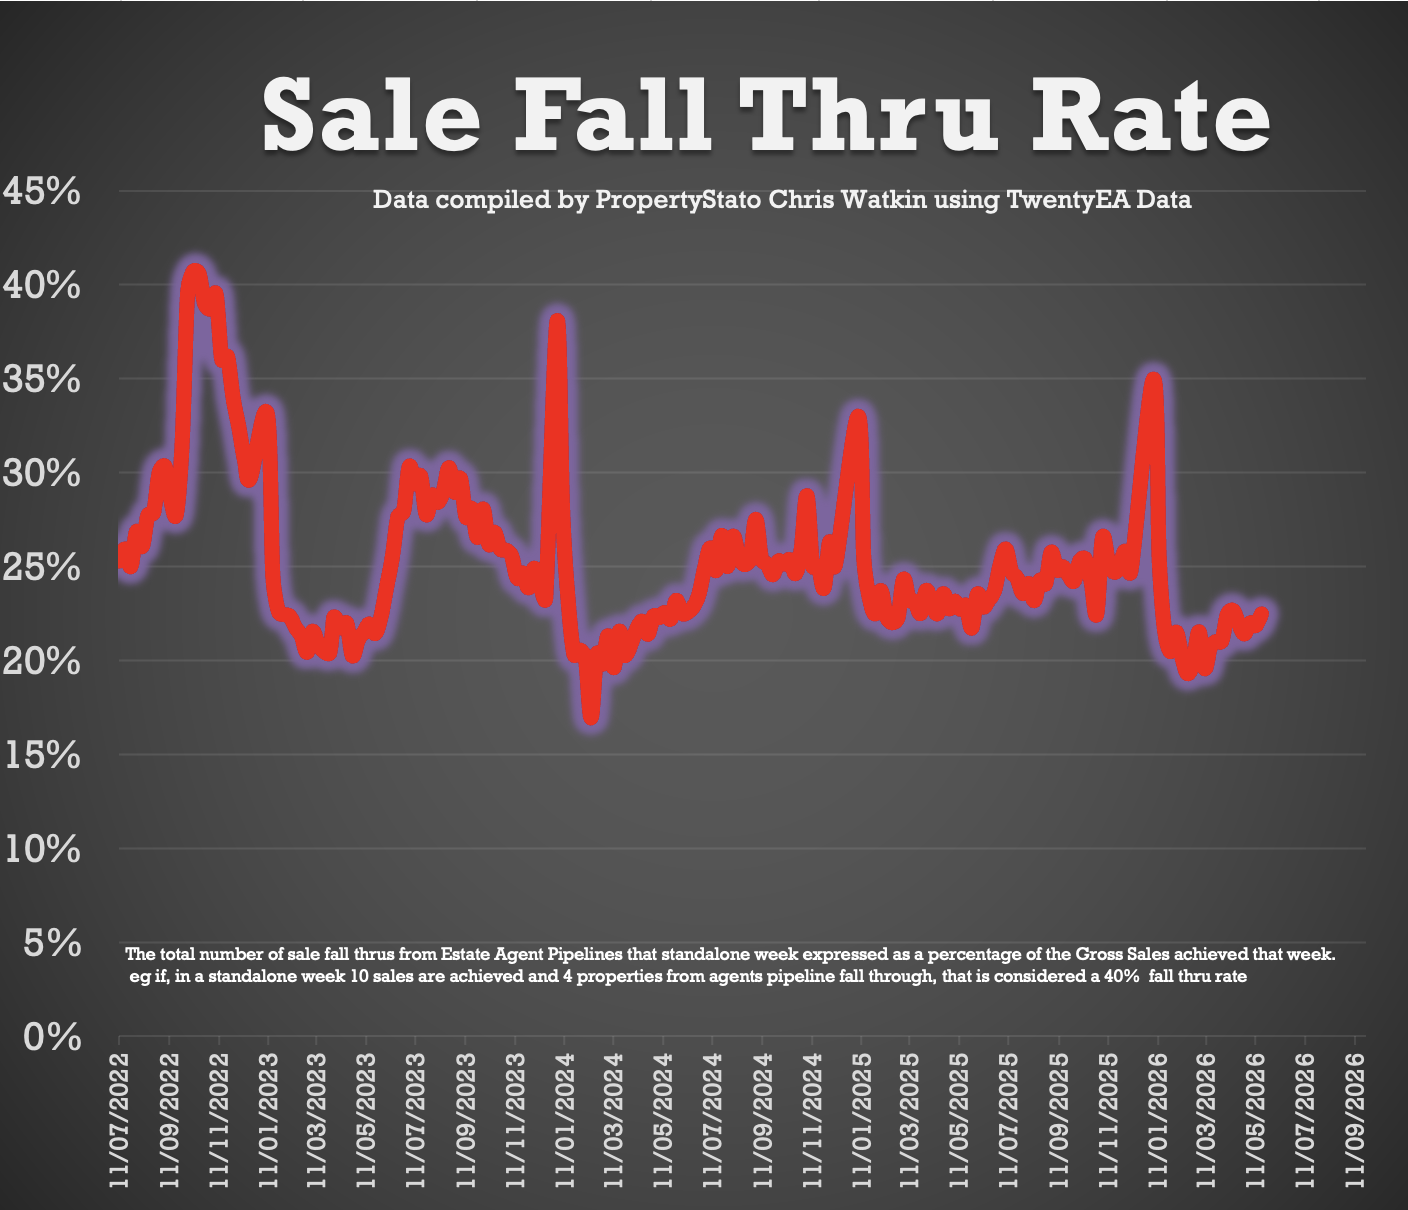
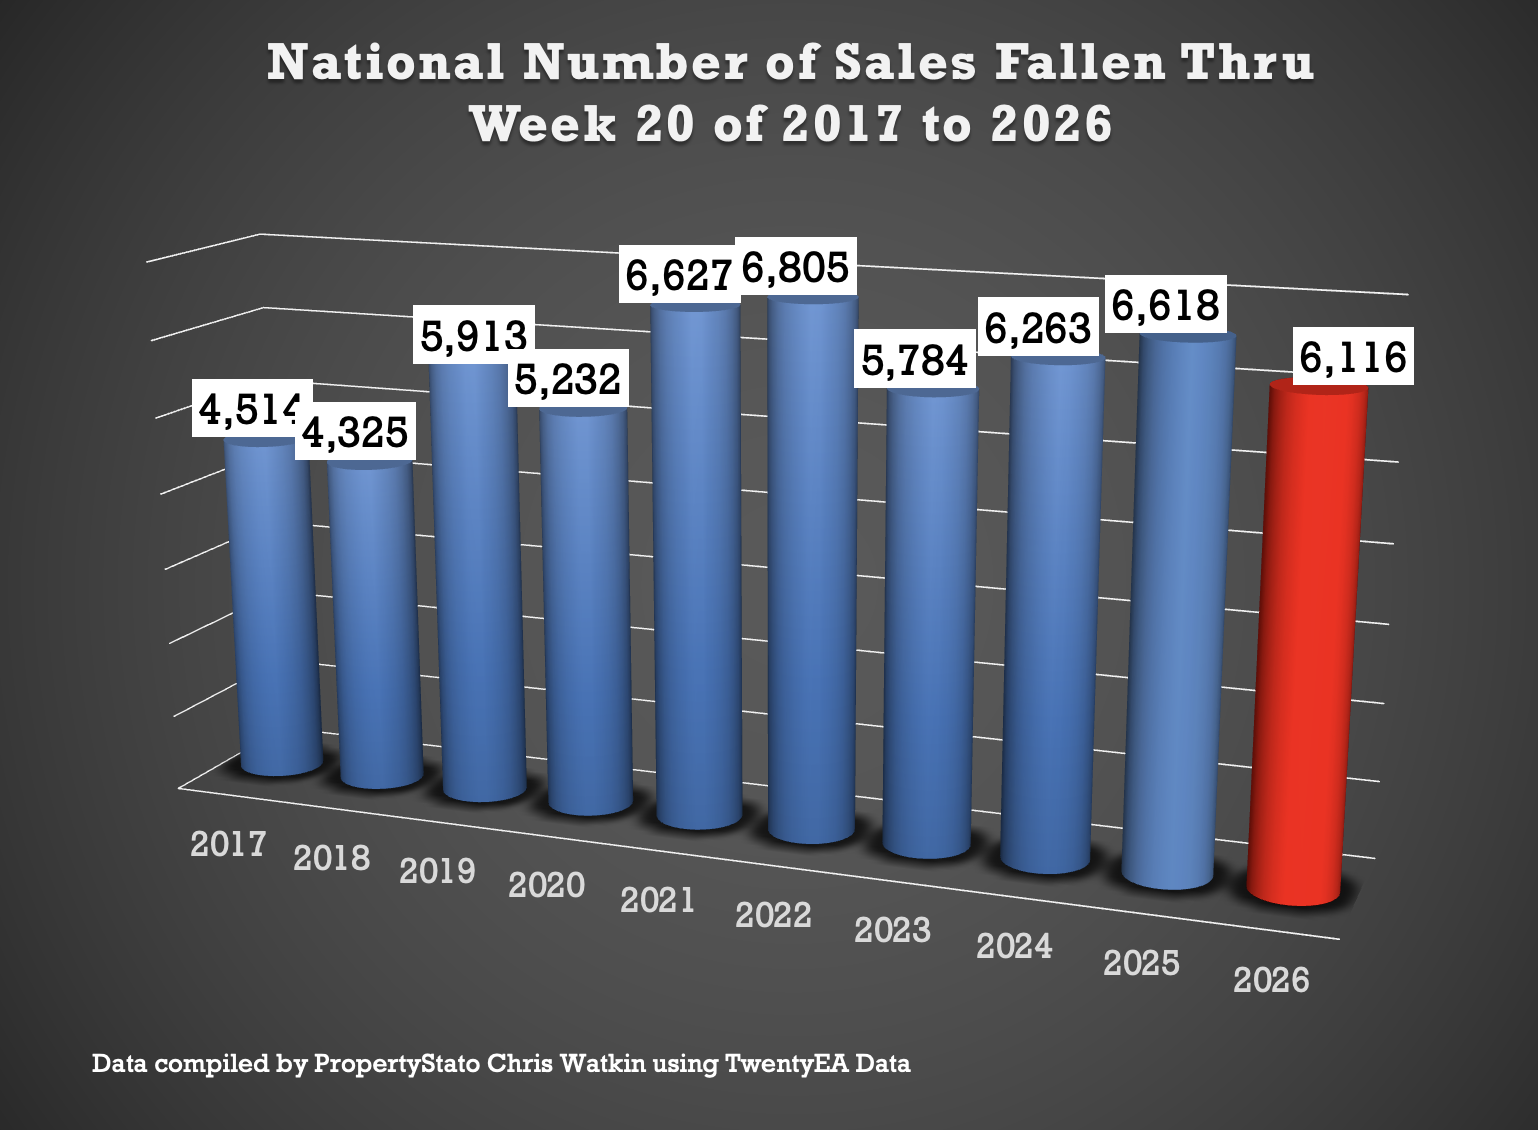
🟩 Sale Fall-Thrus
• Fall-thru rate 22.5%
• Decade average: 24.5%
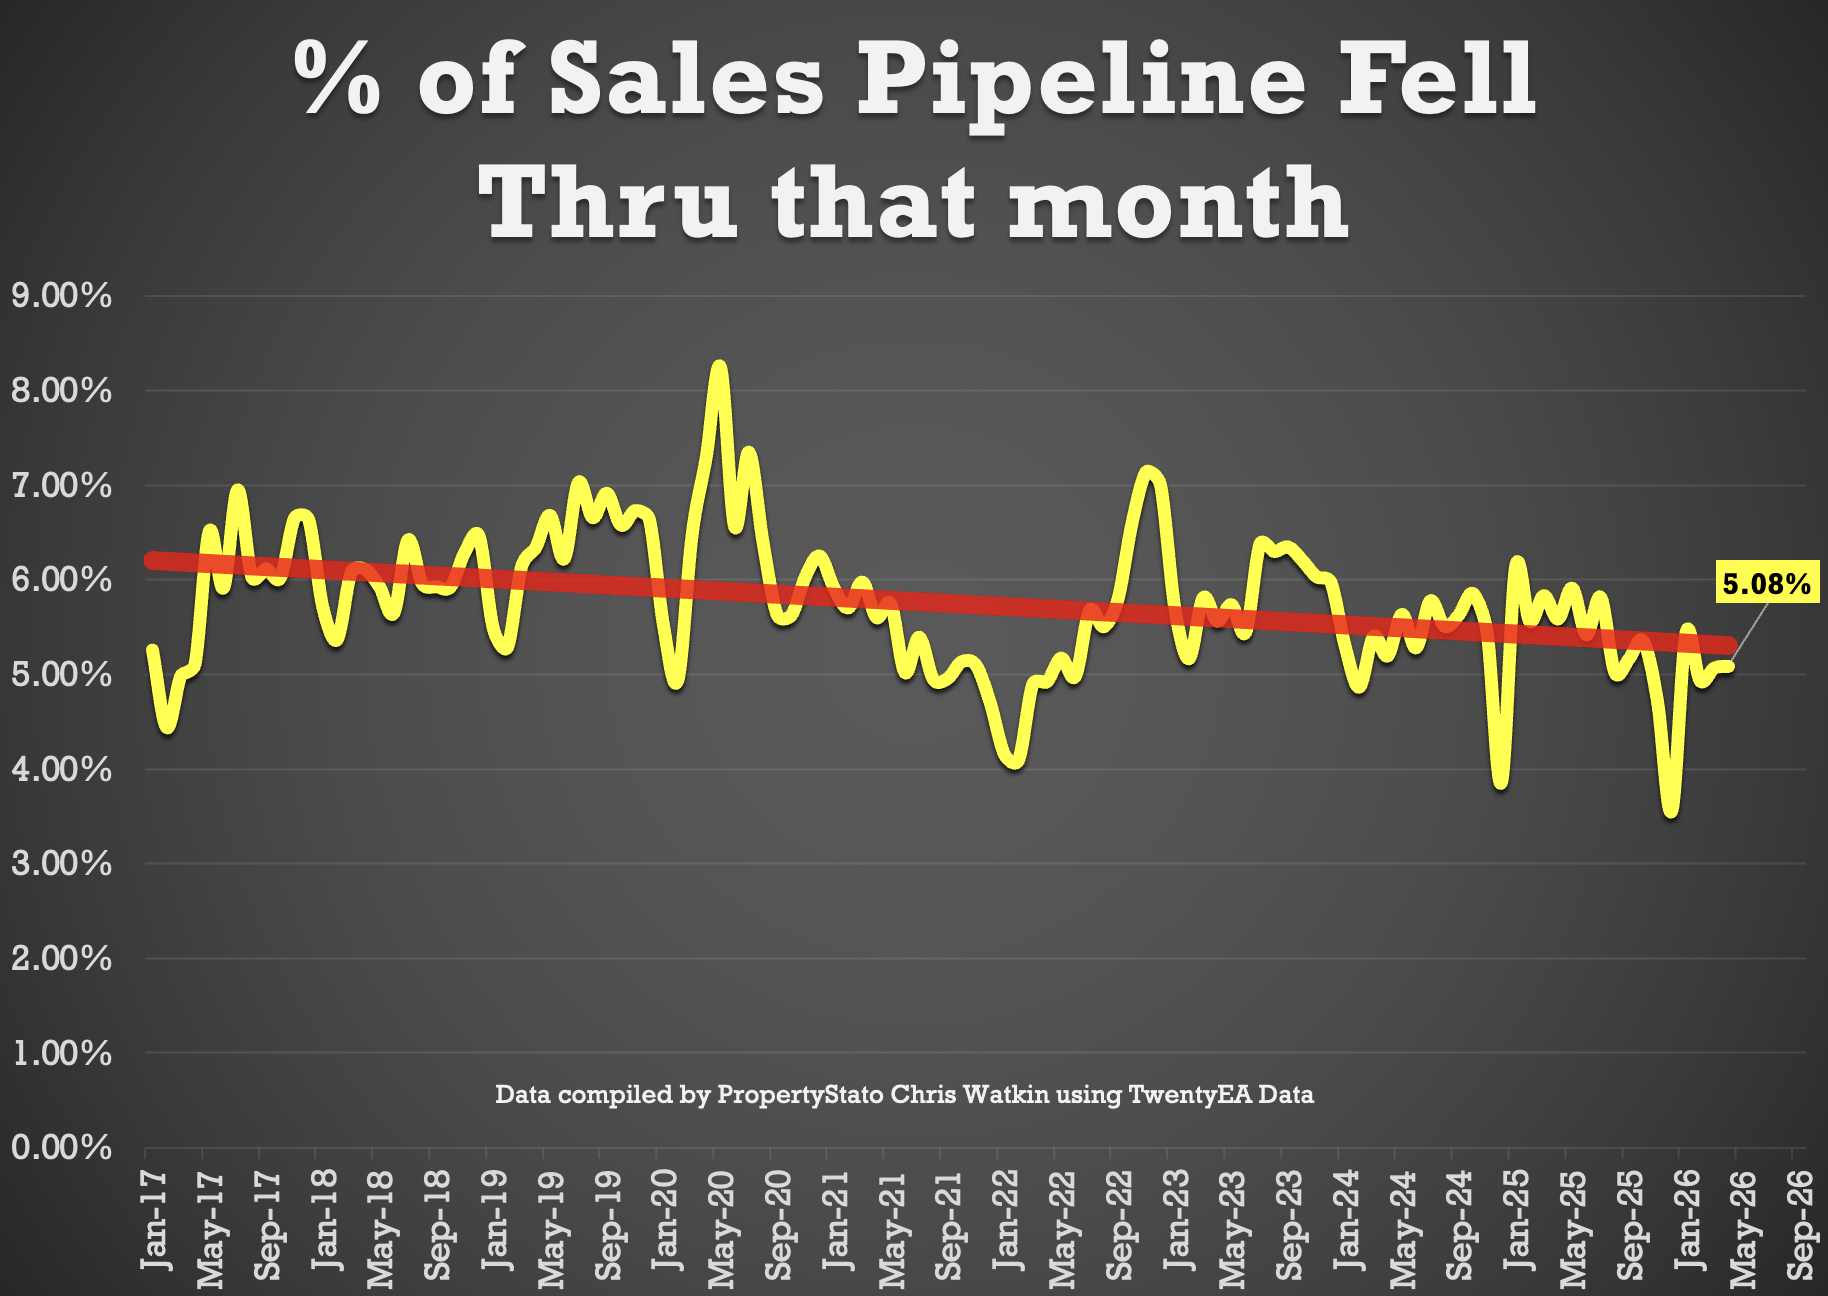
• 5.1% of homes sold STC fell thru in April 2026, below both the 2025 average of 5.3% and the 10 year average of 5.8%.
🟥 Probability of Selling (% that Exchange vs withdrawal)
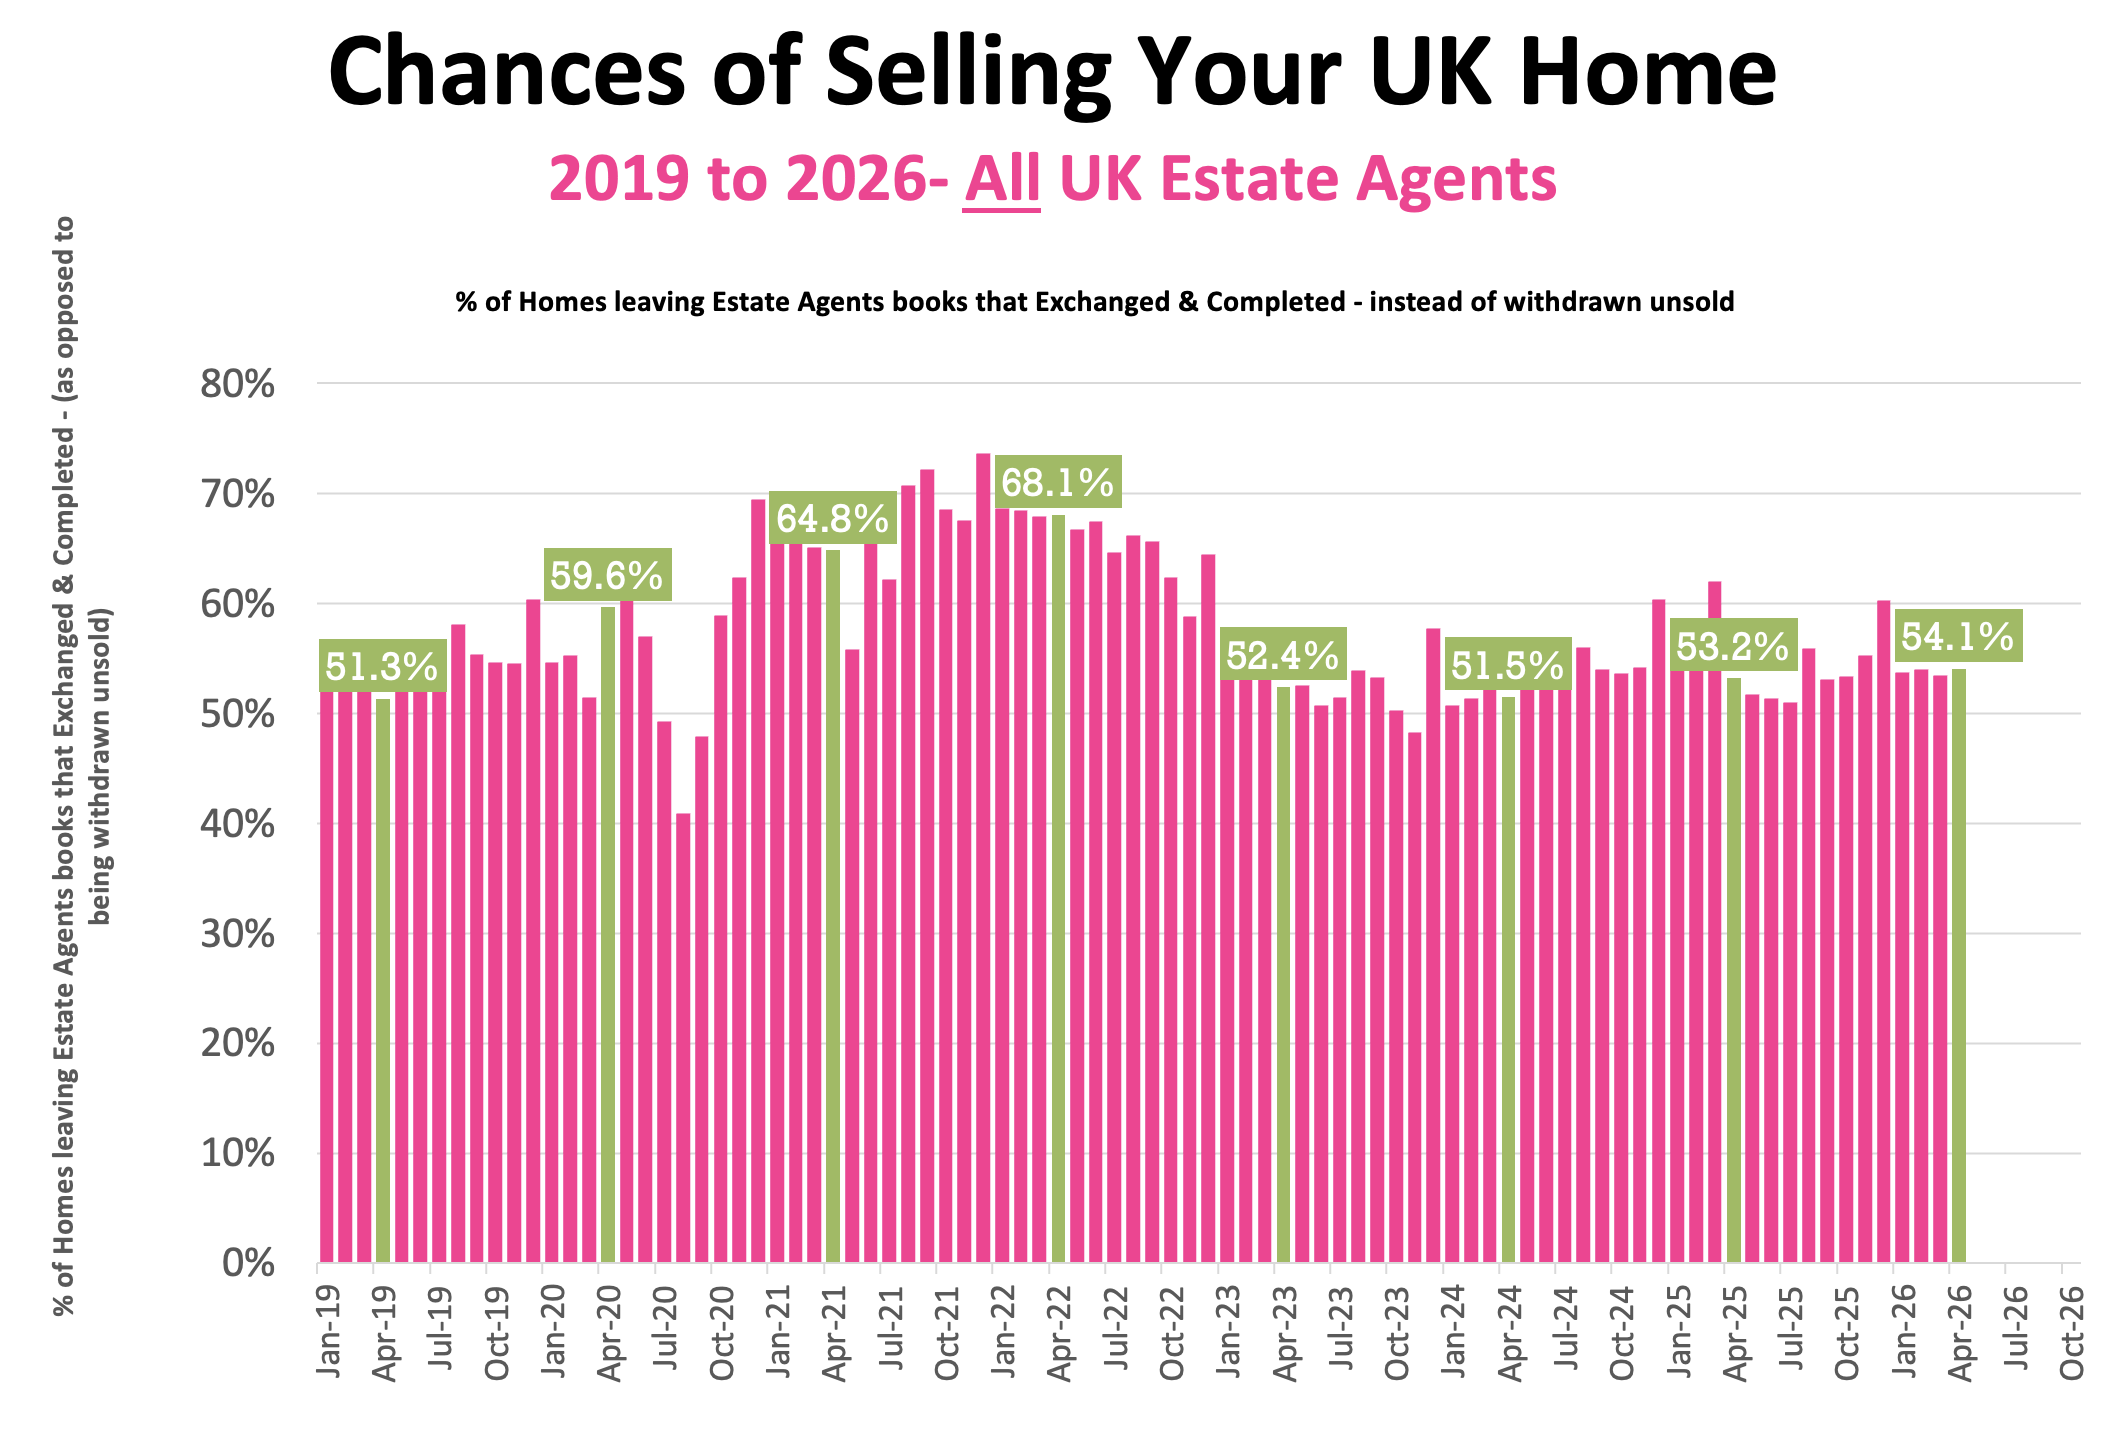
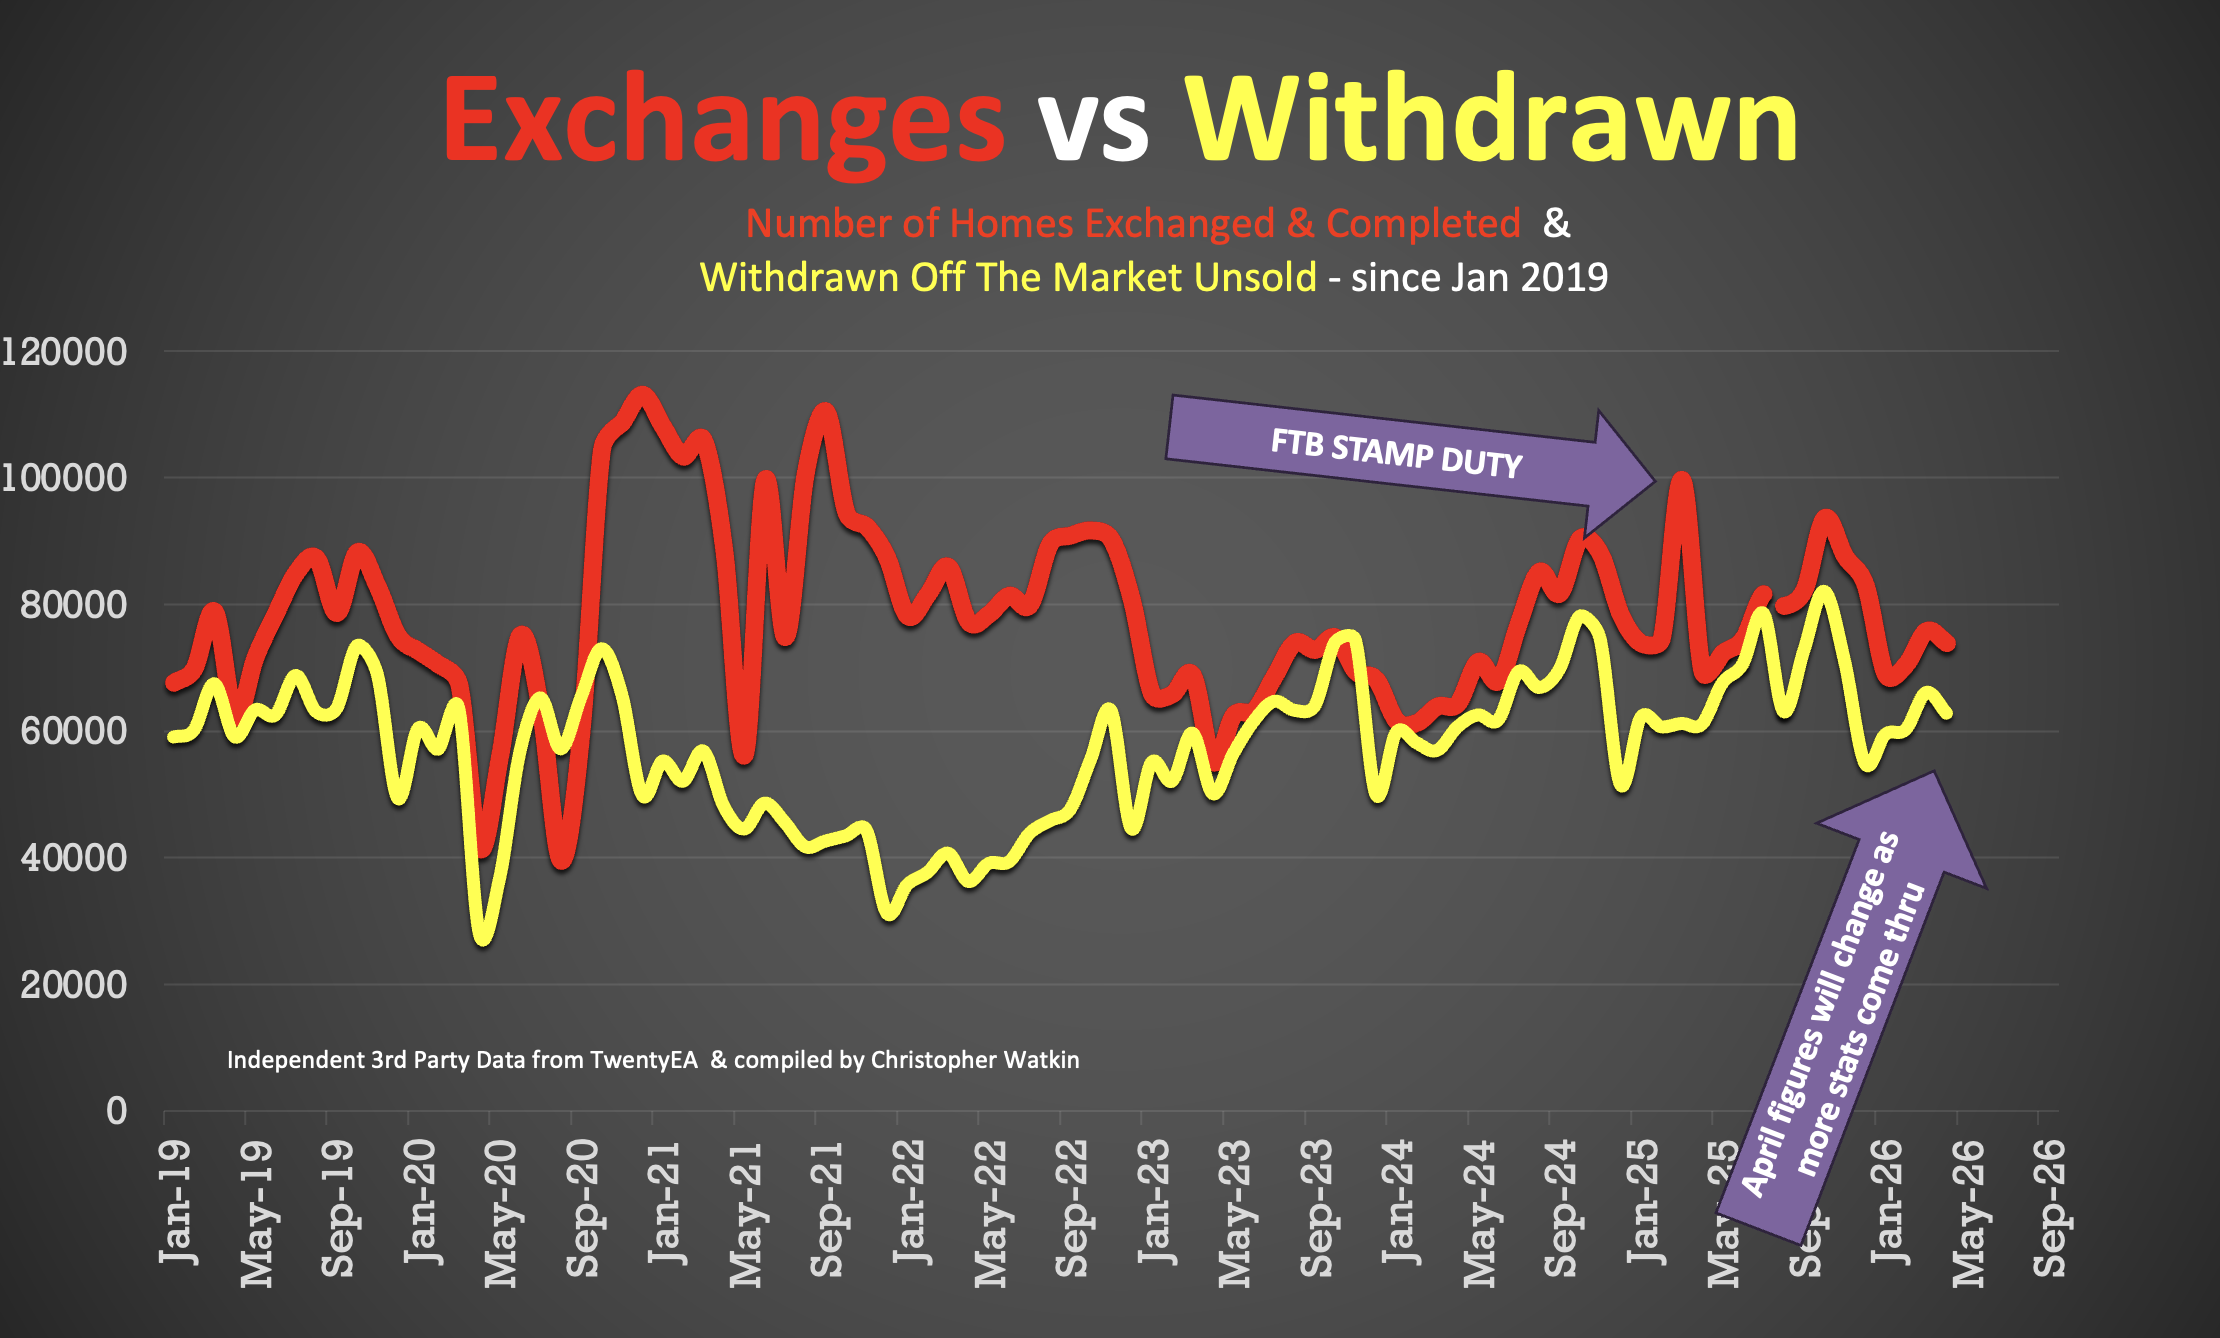
• April 2026 Stats : 54.1% of homes that left agents’ books exchanged & completed in April. (Note this figure will change throughout the month as more April stats come in).
• 57.6% is the 7 year average (which includes the crazy years post lockdown 18 months).
🟩 UK Net Resi Sales YTD
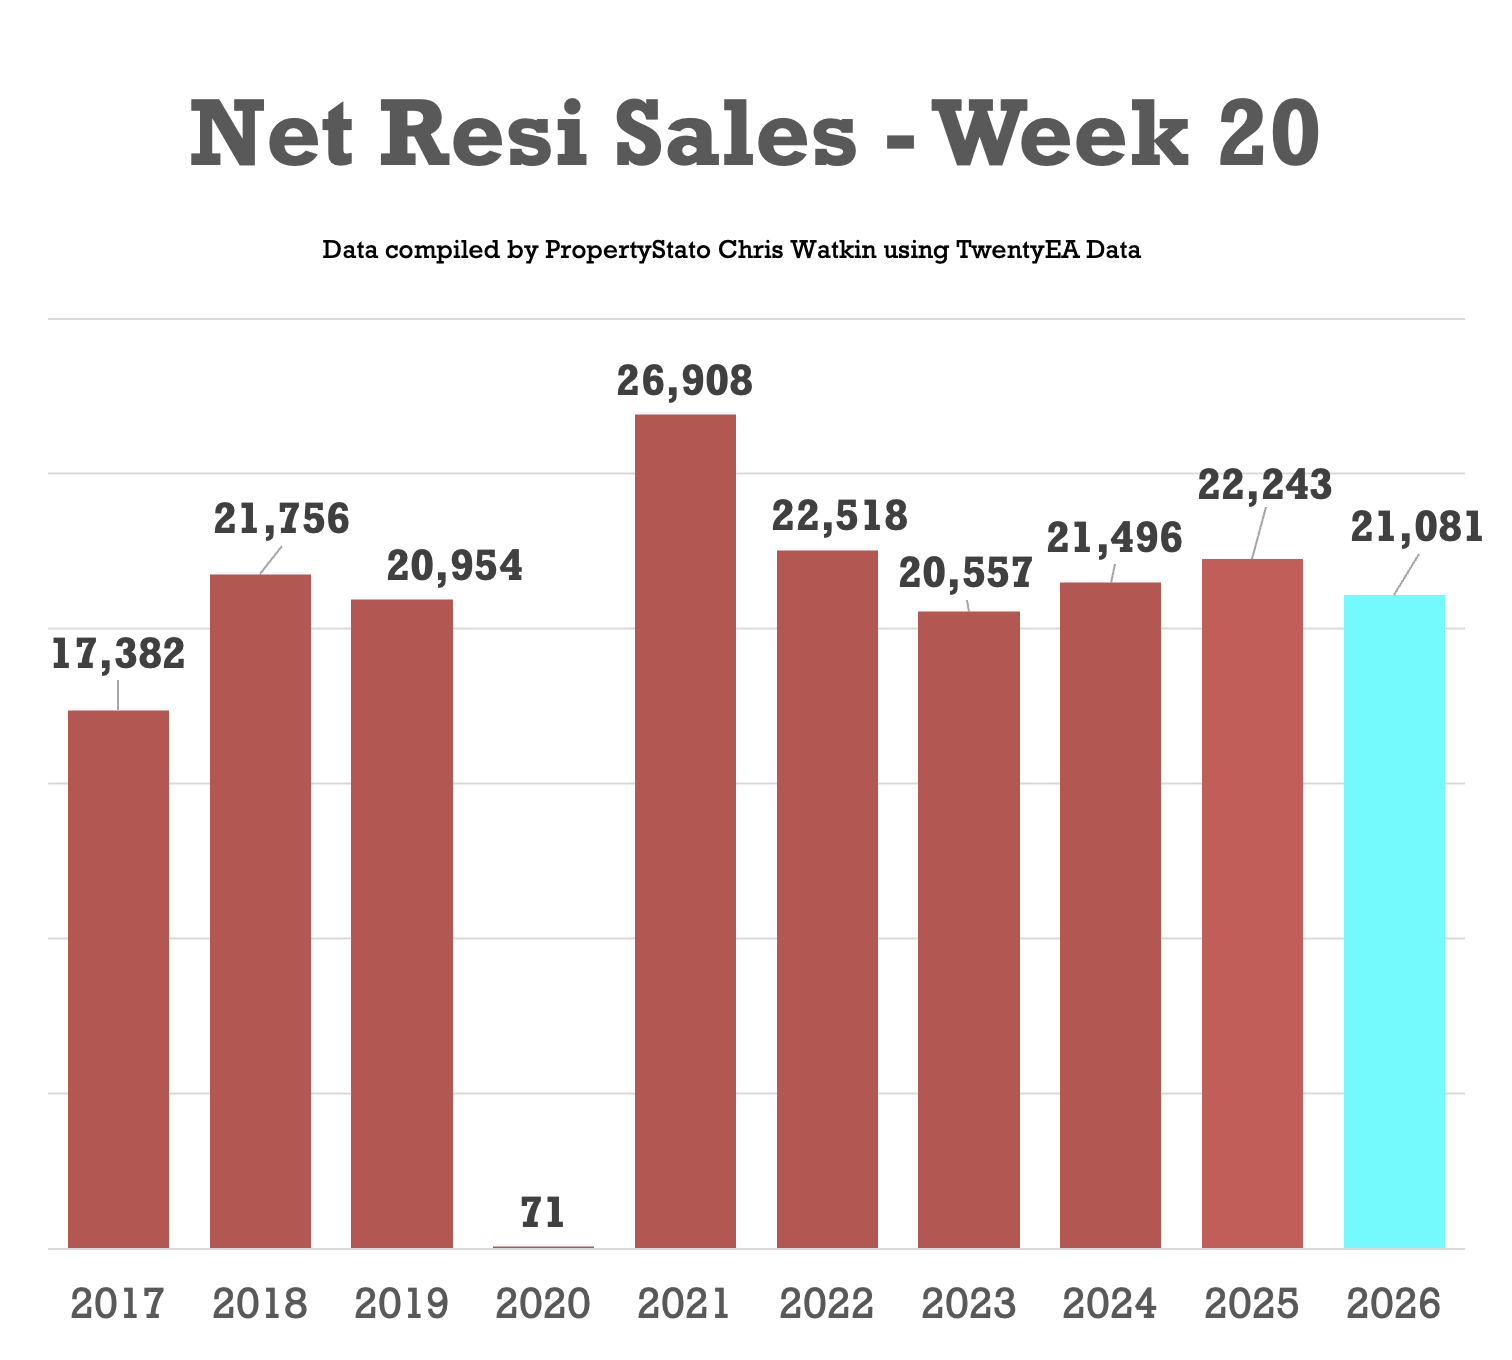
Week 20
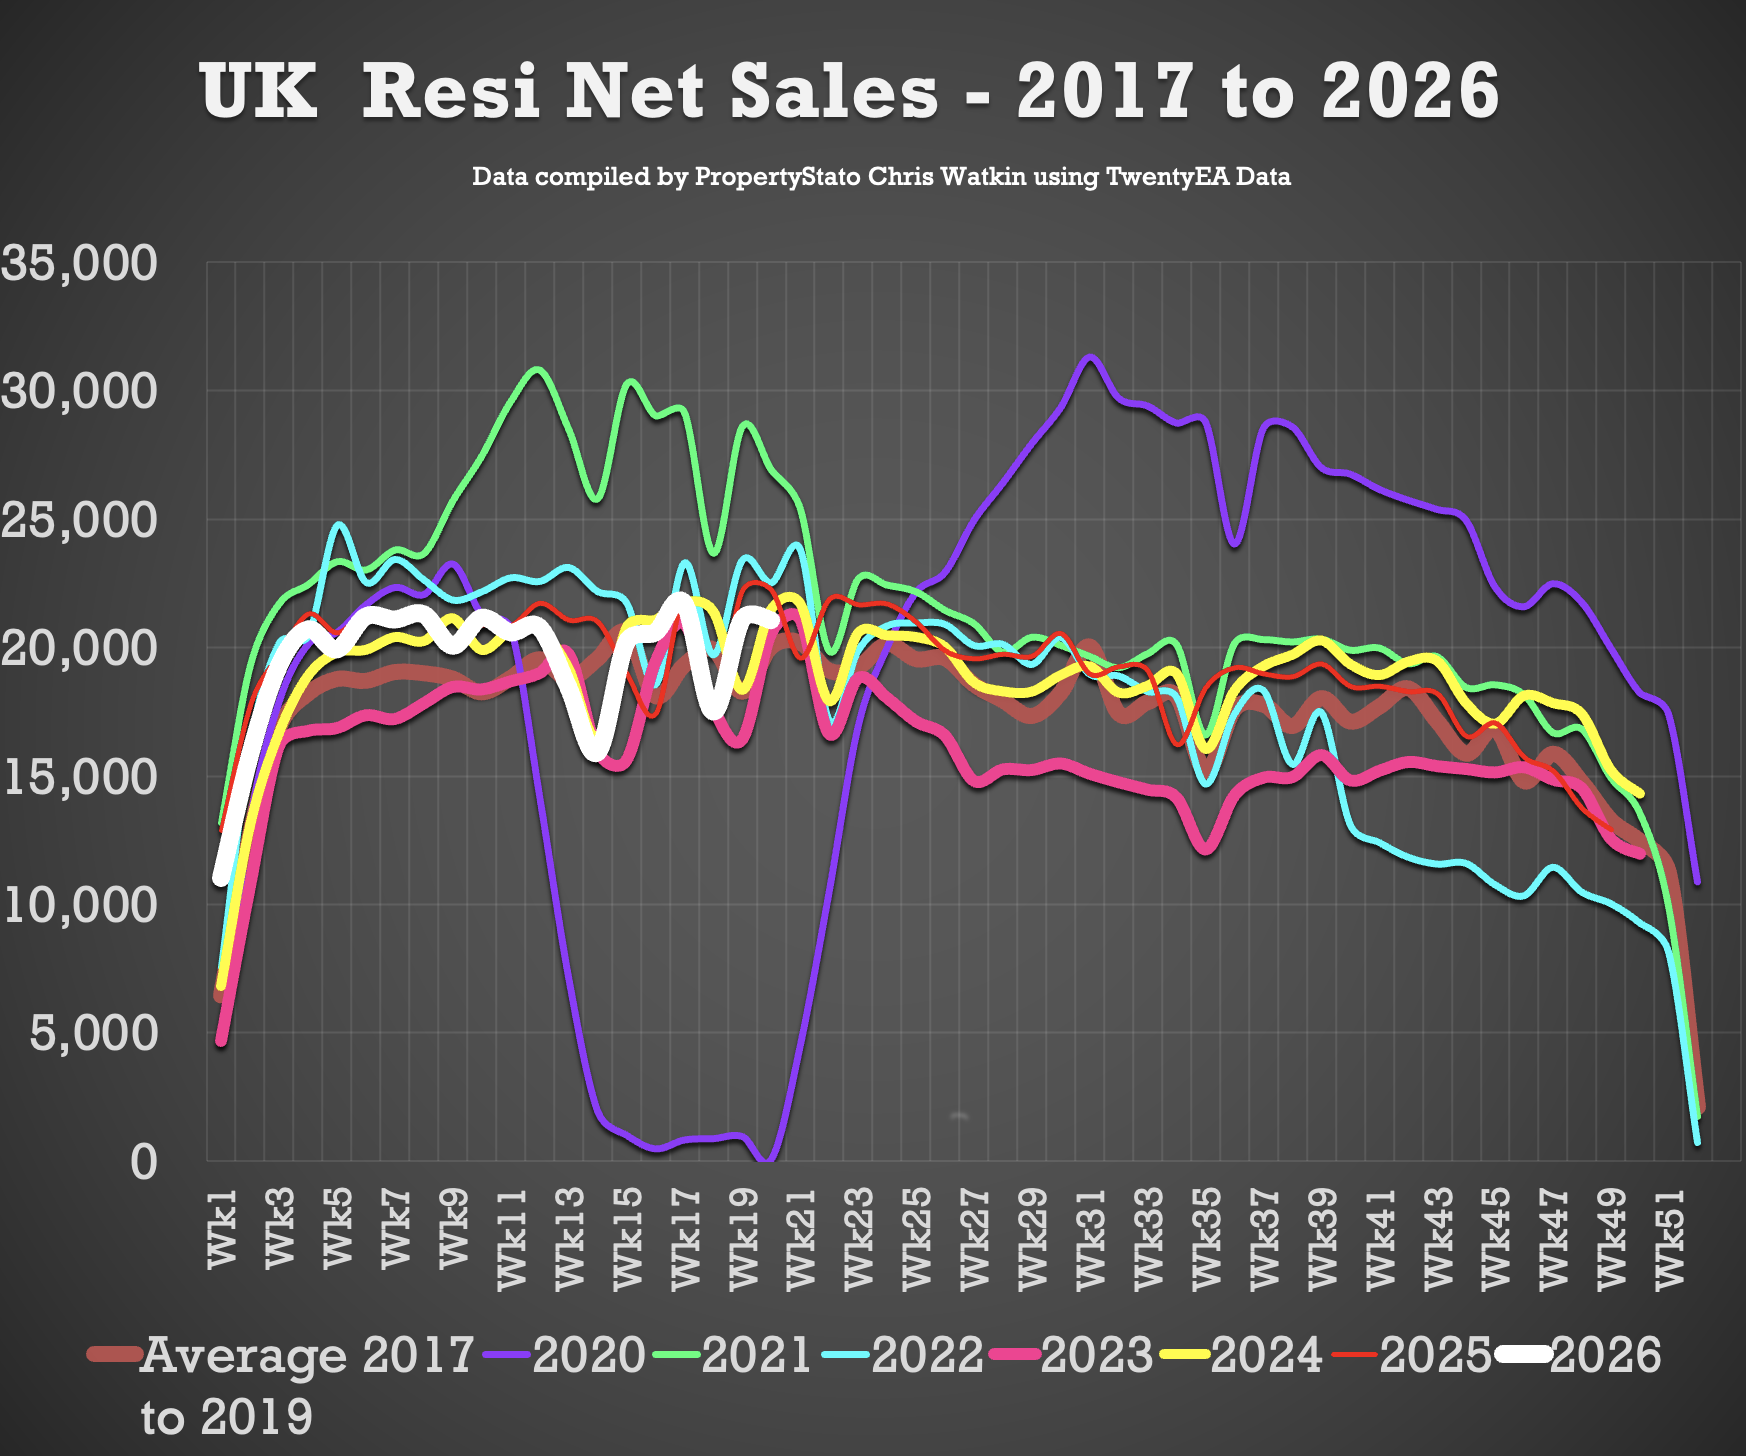
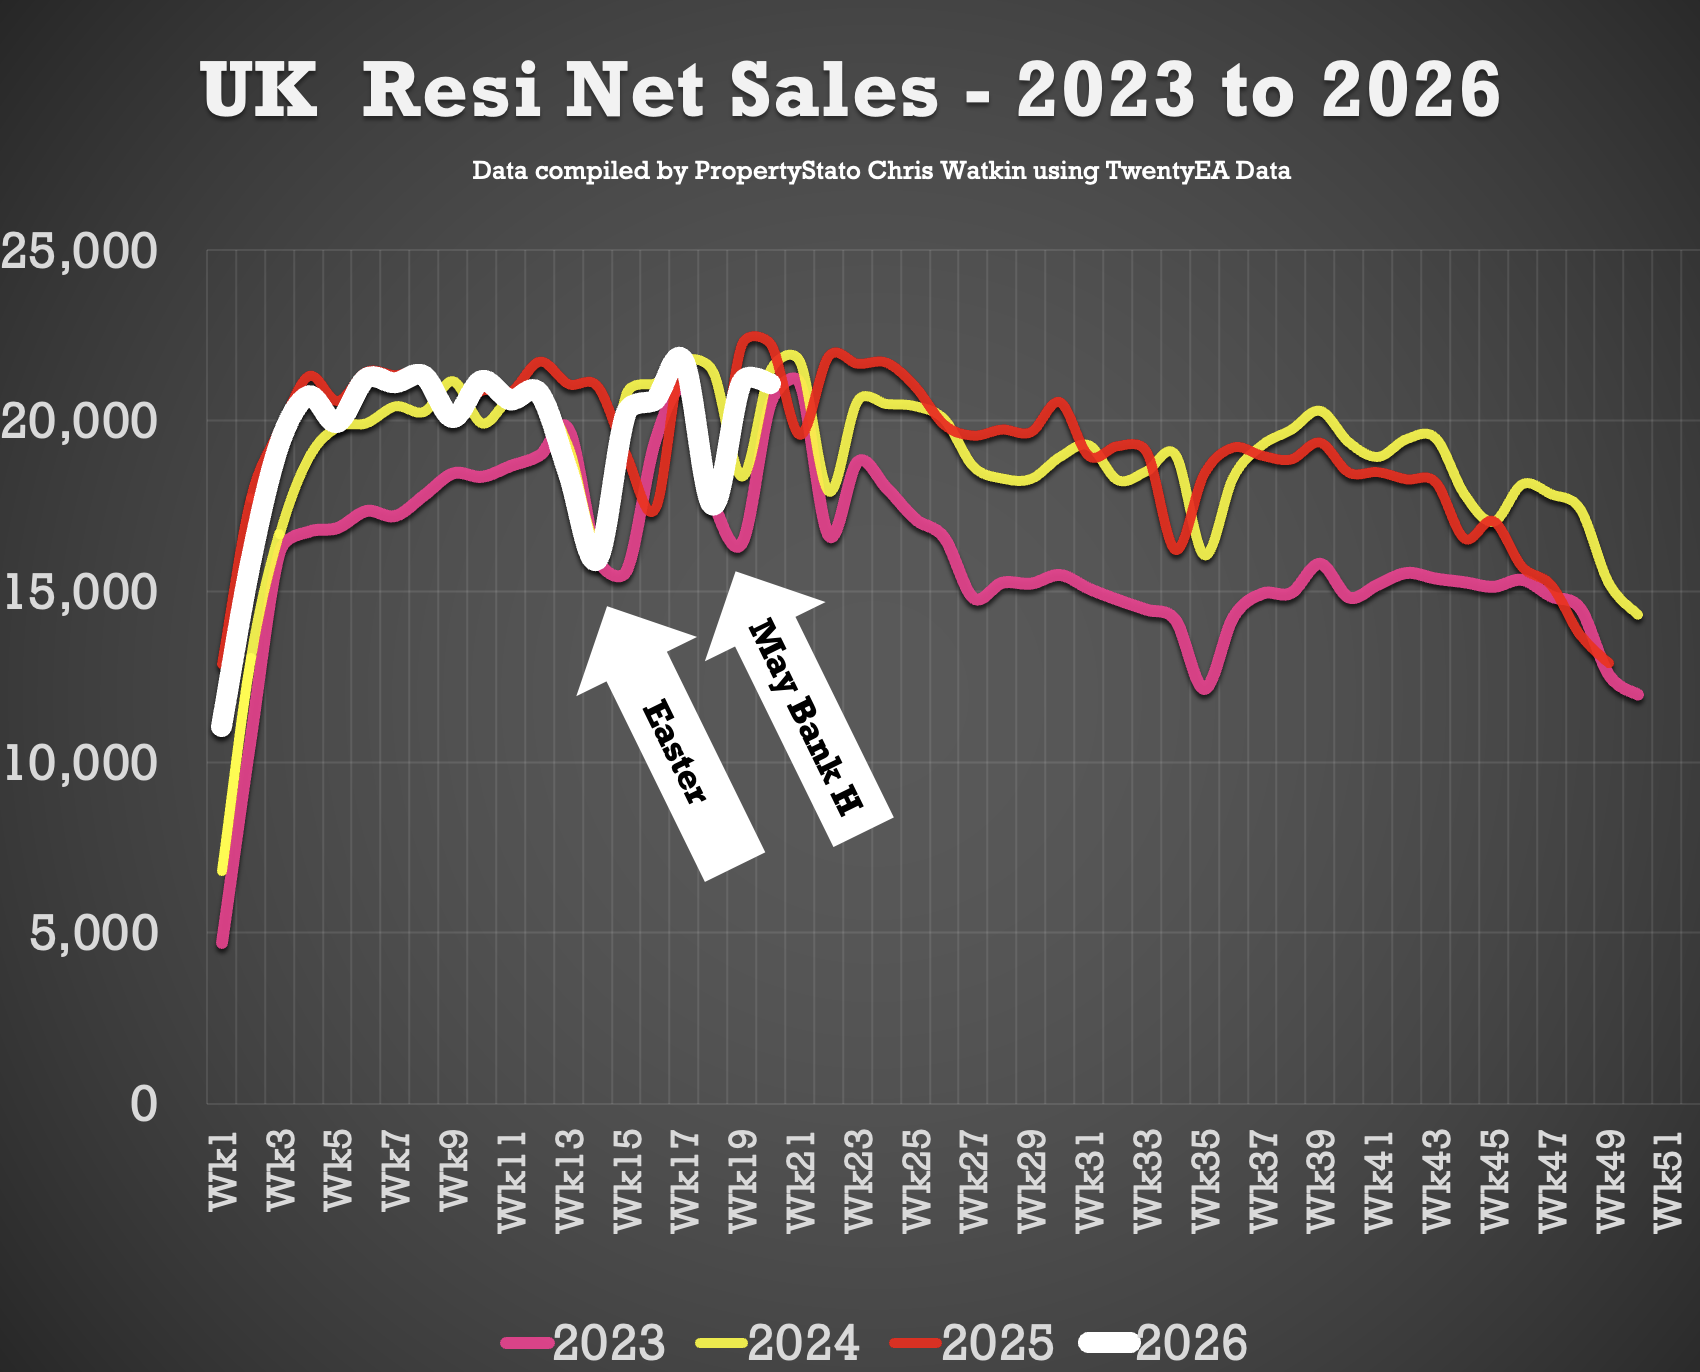
21k Net Sales (21.8k last week)
10 year Week 20 average: 19.5k.
Weekly average for 2026: 19.5k.
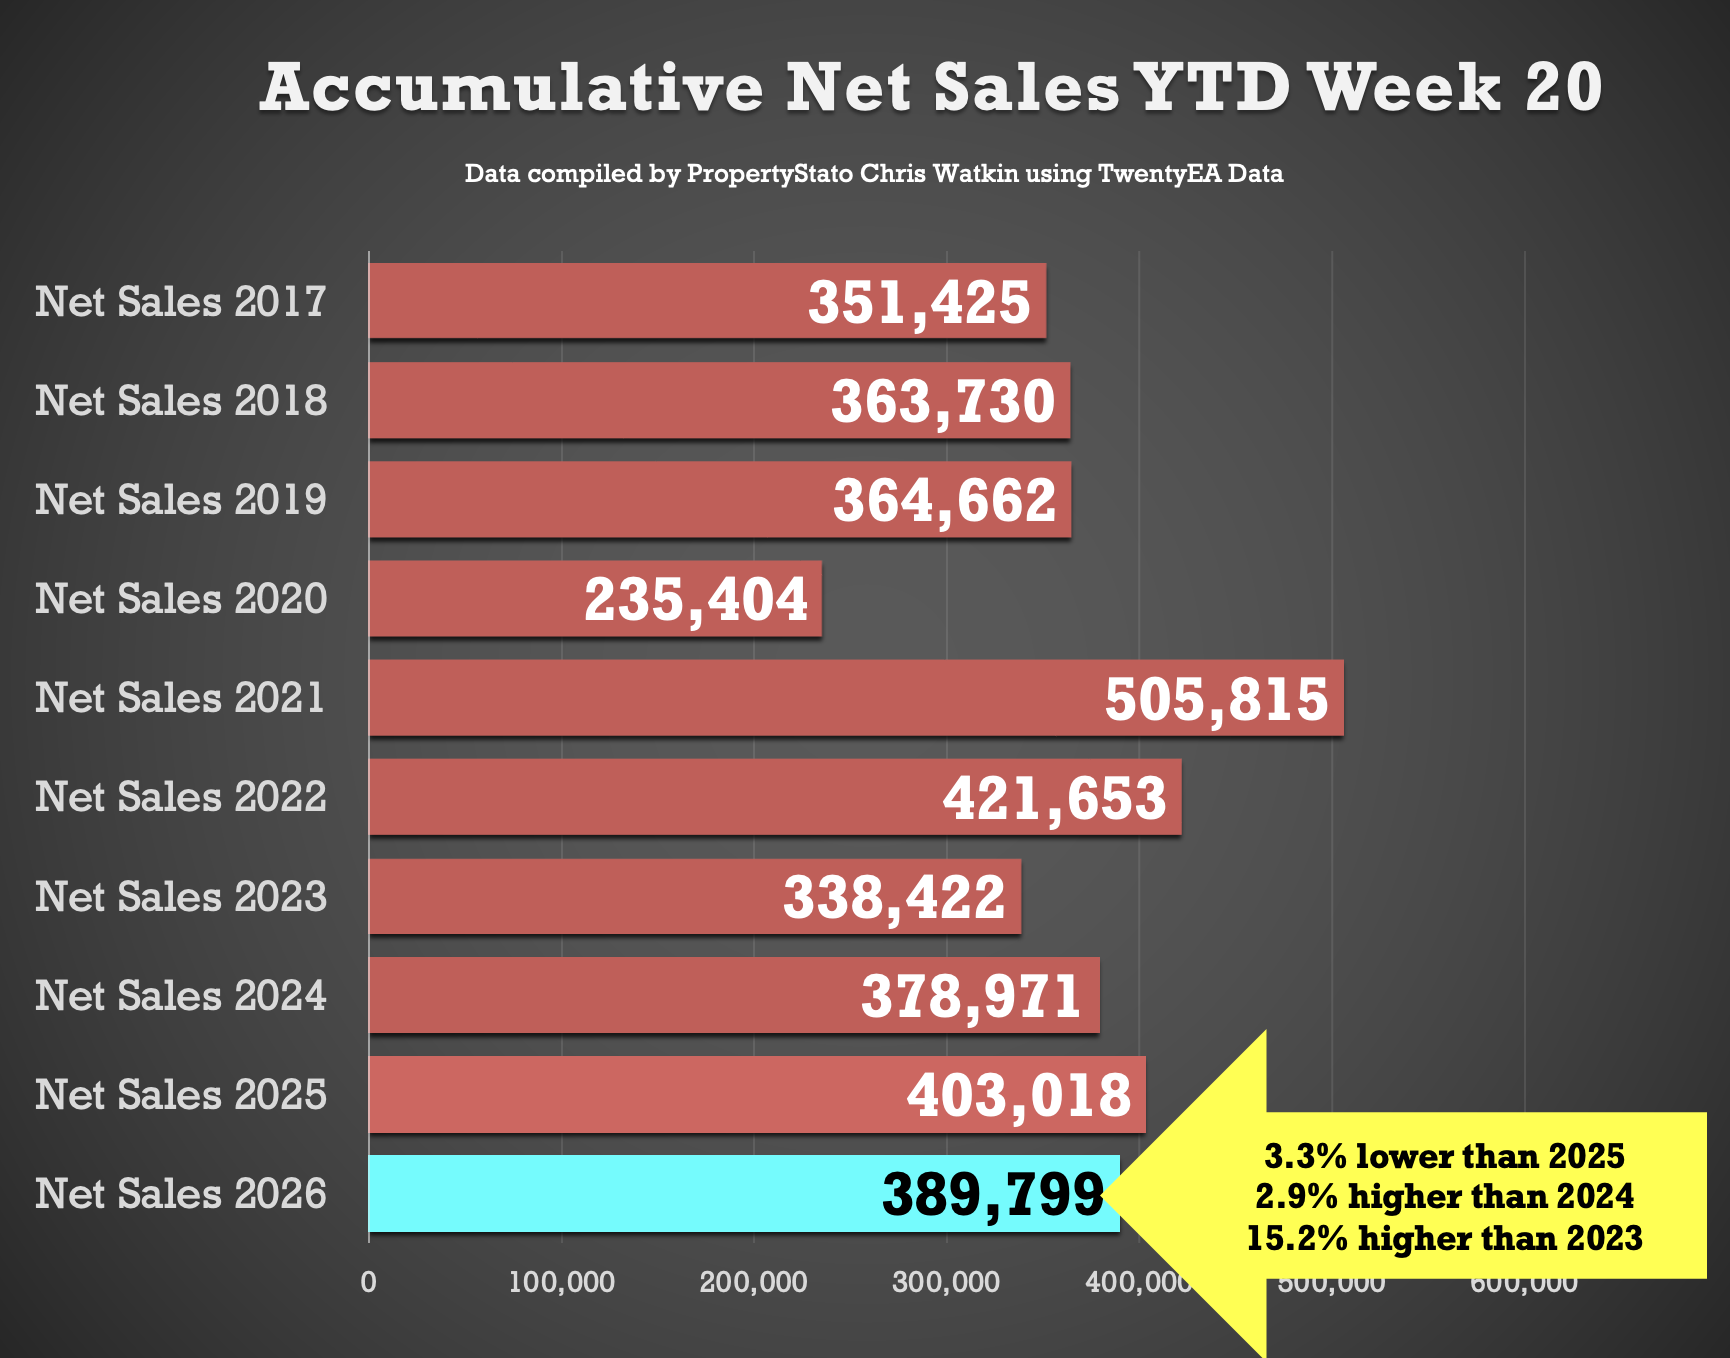
Year to Date
390k UK net home sales YTD
3.3% lower than 2025 (403k),
2.9% ahead of 2024 (379k),
15.2% ahead of 2023 (338k)
8.3% above the 2017–19 average (360k).
(Net Sales being Gross Sales less Sale Fall Thrus).
🟥 Exchanges
• April 2026 – 73.9k Exchanges (compared to 69.4k in April 2025)
• 288k UK Exchanges YTD to end of April 2026. 8% lower than Jan to April 2025, when it was 314k.NB. There were more exchanges in Q1 2025 because of the stamp duty holiday which finished in April 2025.
🟩 Withdrawals
• April 2026 – 62.8k Withdrawals (compared to 61k in April 2025).
• That means that 45.9% of all homes that left UK Estate Agent books ion April went unsold.
🟥 Stock Levels
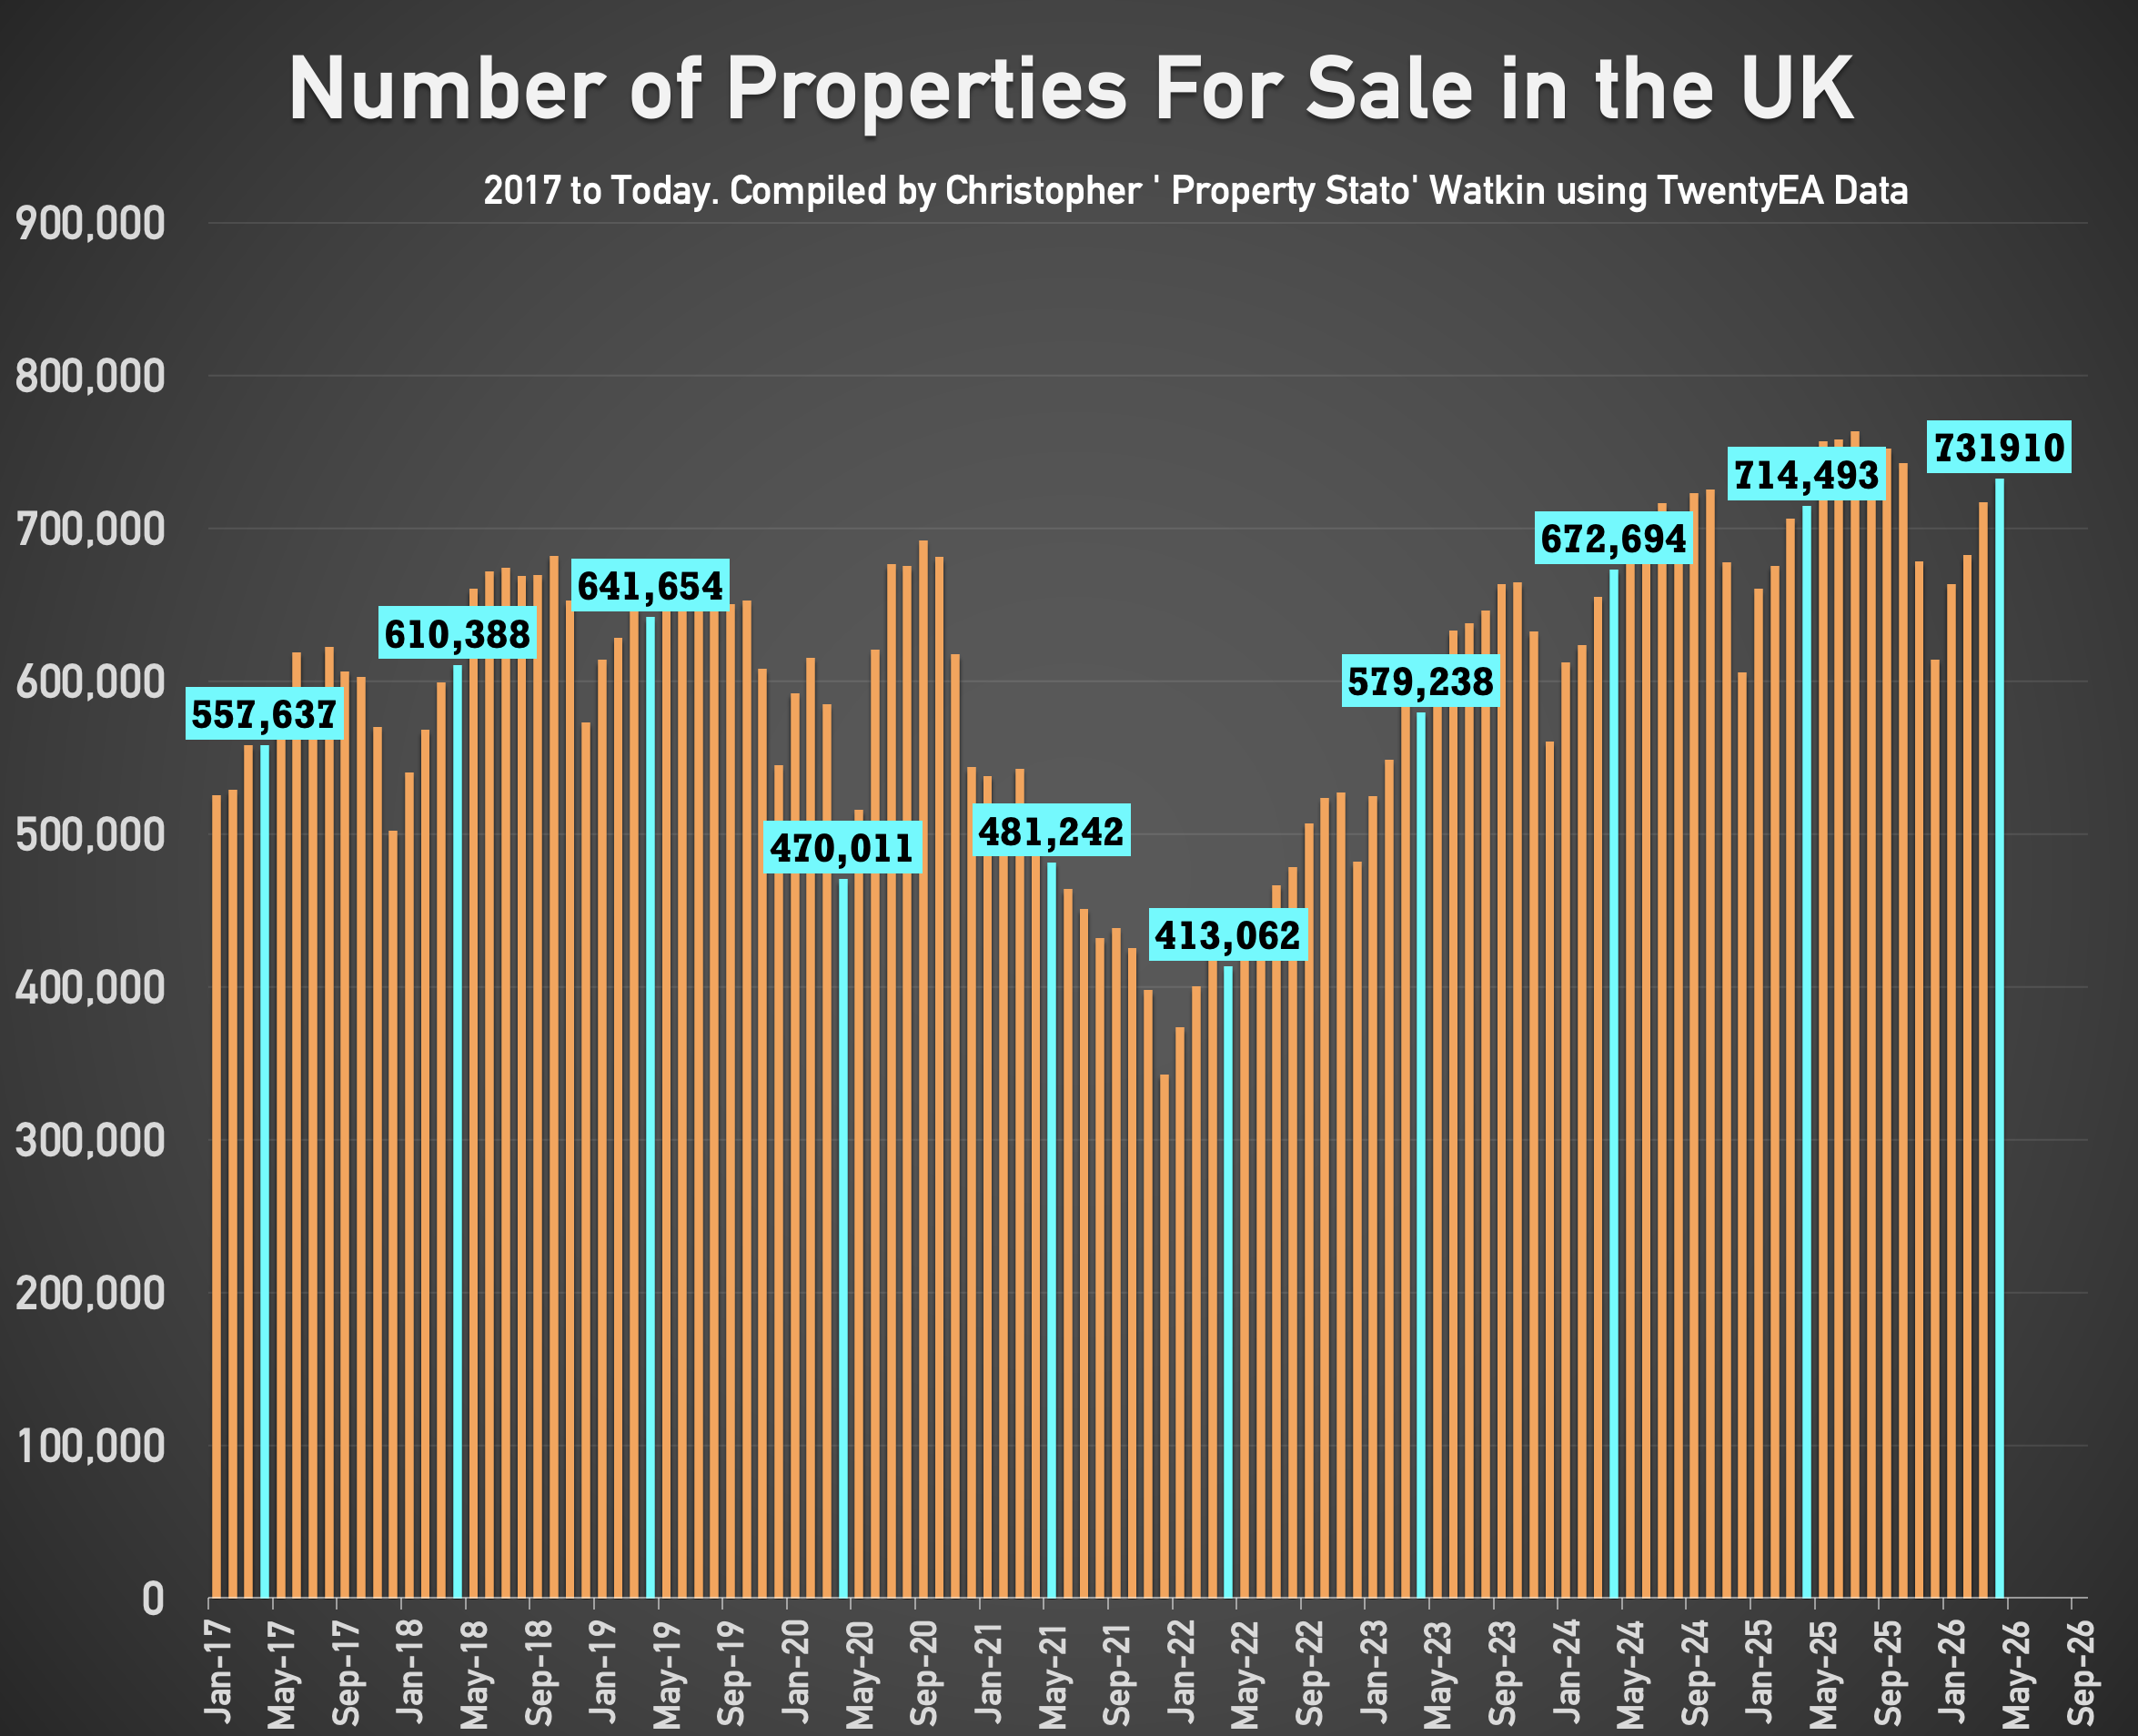
• 731k homes on the market on the 1st of May ’26. (714k – 1st May 25)
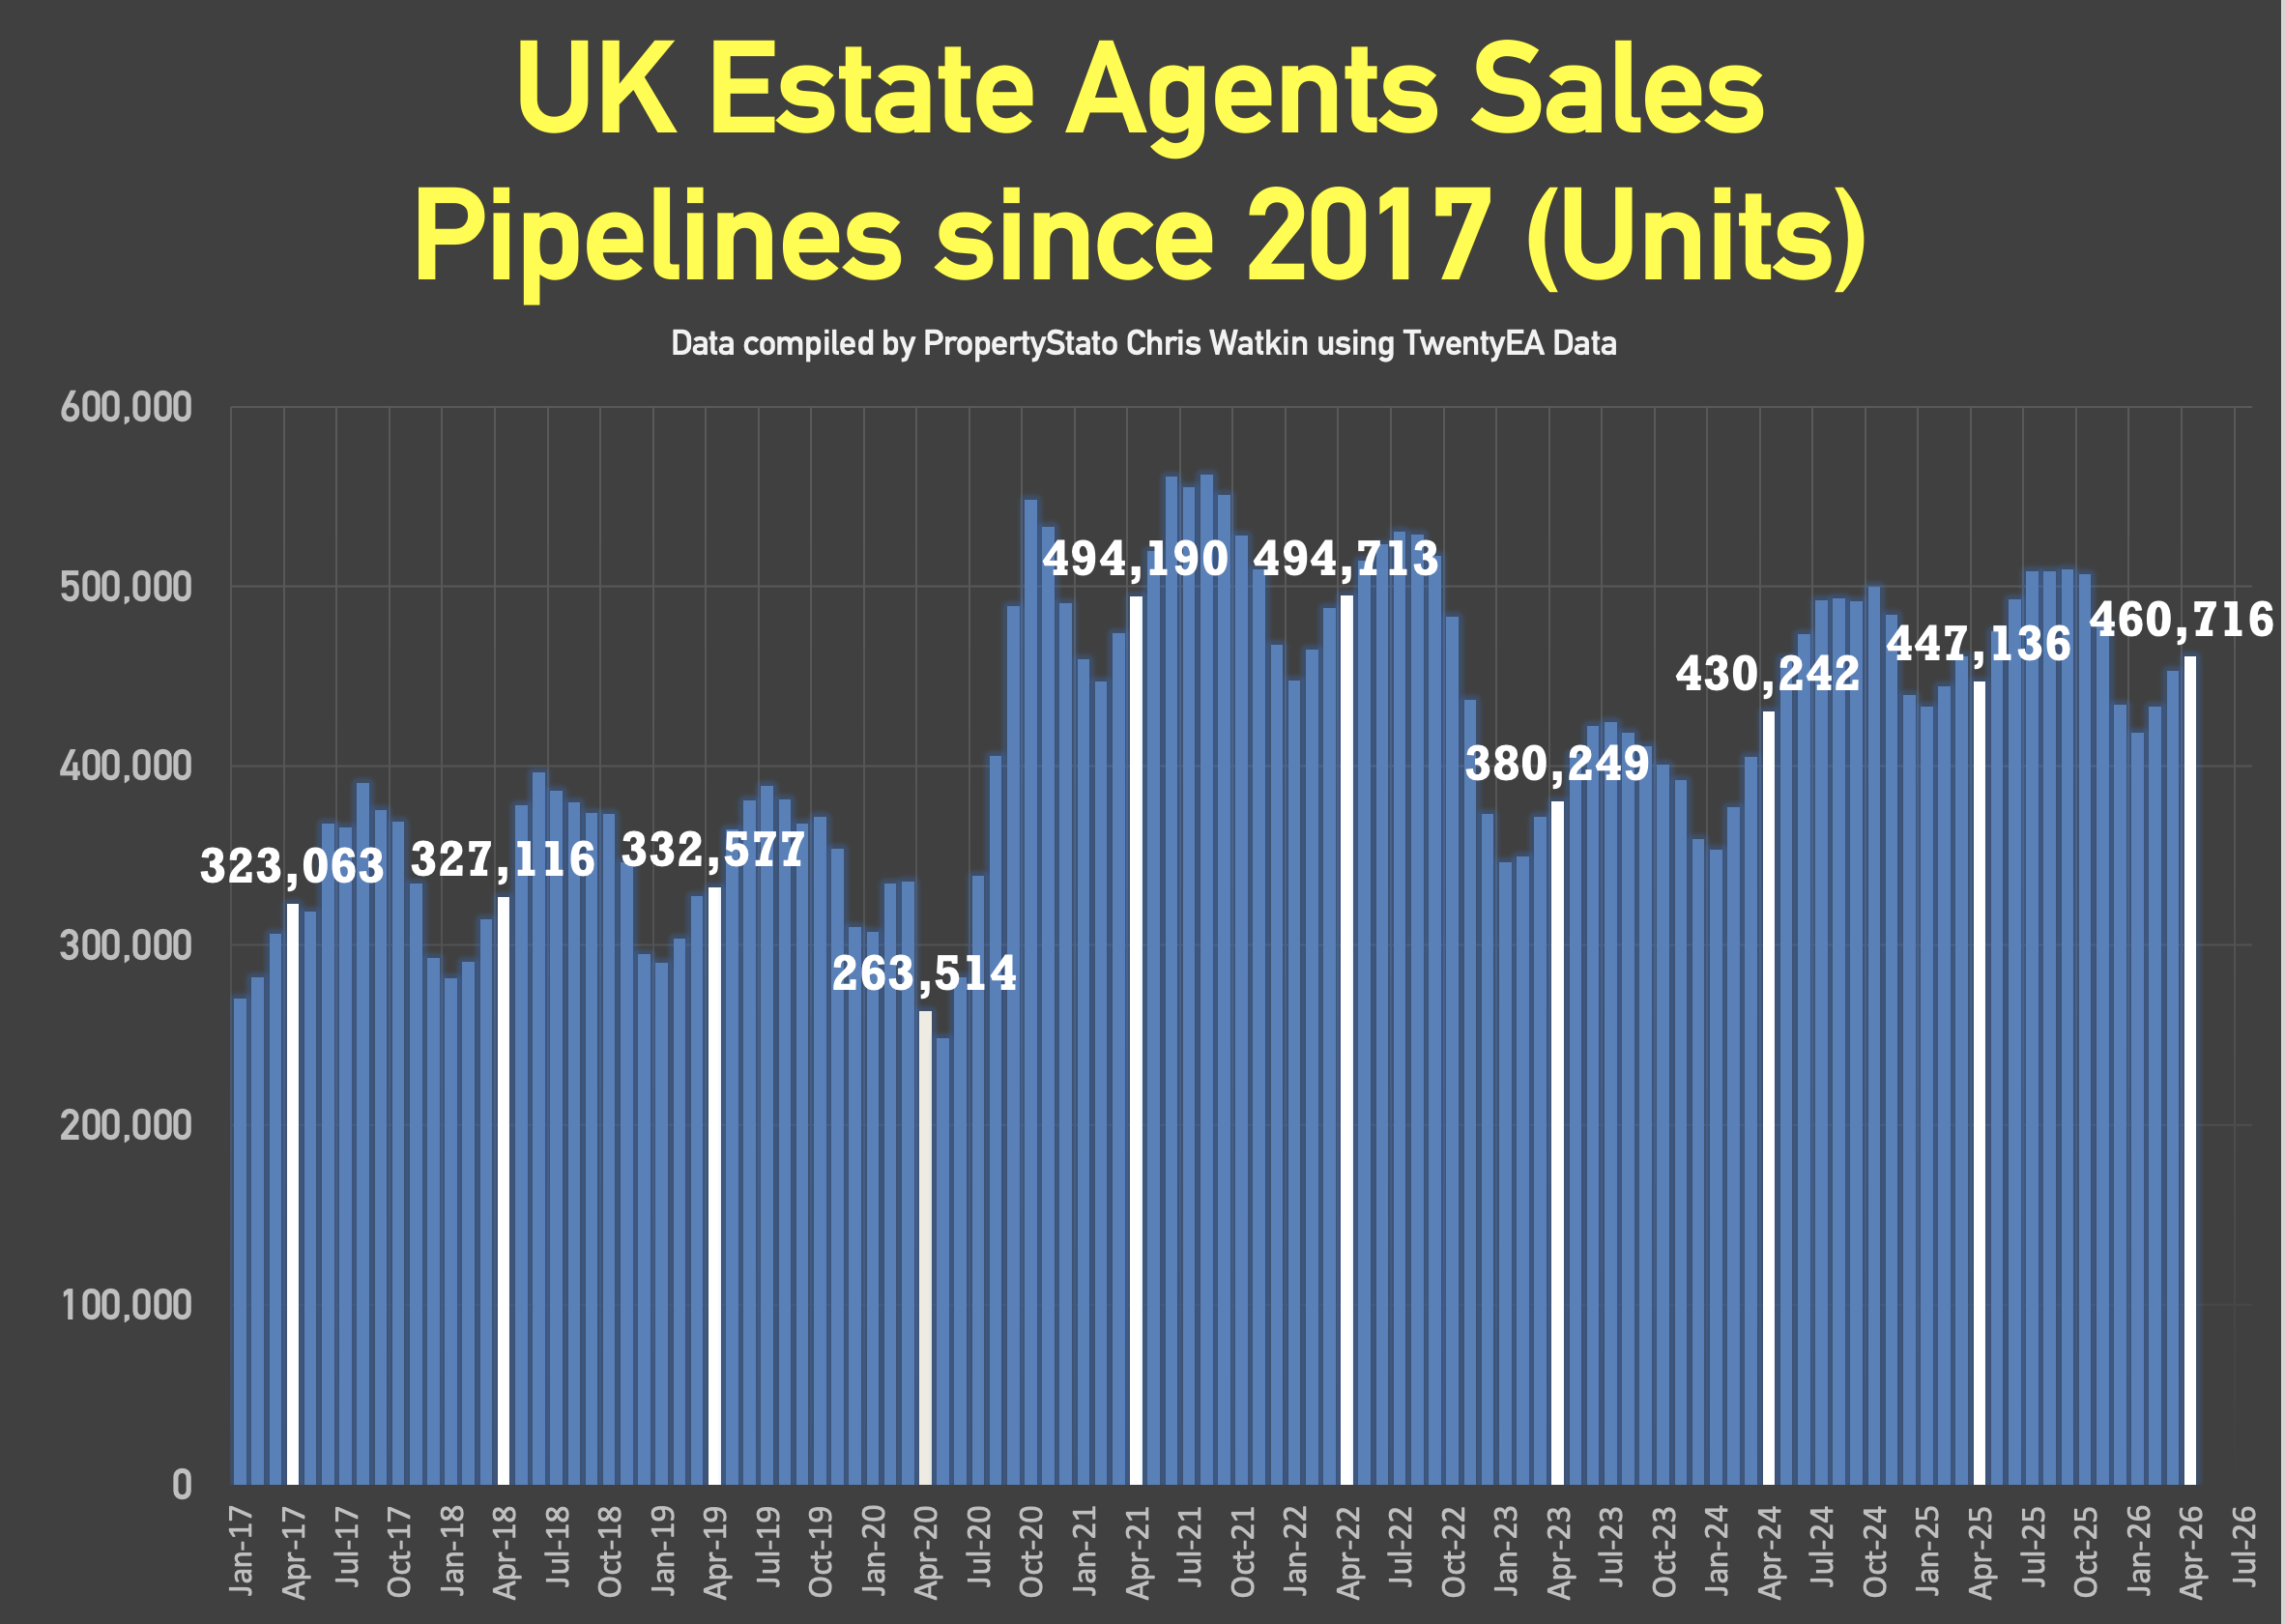
• 461k homes in agent’s sales pipeline on the 1st May 2026, slightly higher than 12 months ago on 1st May ’25 (447k).
🟩 House Prices (£/sq.ft)
• April ’26 agreed sales averaged £345.18 per sq.ft. 1.8% higher than 12 months ago (£339.10) and 11.3% than 5 years ago (£310.18).
The £/sqft at sale agreed matches the HM Land Registry Index with a 98% accuracy, 5 months in advance. That is why it is so important.
🟥 UK Rental Data
• Average Rent in Wk 19 – £1,797 pcm
• Average Rent in May 2026 – £1,780 pcm (£1,779 in May 25)
• Average Rent in YTD 2026 – £1,742 pcm
• 302k UK Rental Stock available to rent in April 26 (303k in April 2025)
🟩 Local Focus
Crystal Palace
Read the orginal article: https://propertyindustryeye.com/what-is-currently-happening-in-the-uk-property-market-97/?utm_source=rss&utm_medium=rss&utm_campaign=what-is-currently-happening-in-the-uk-property-market-97


