

Welcome to the 42nd UK Property Market Stats Update of 2025, your weekly catch up on the UK housing market.
There is no stats show video this week as I have been in Italy – the show and video will return next week
Week 42 is the week ending Sunday 26th October 2025.
✅ New Listings
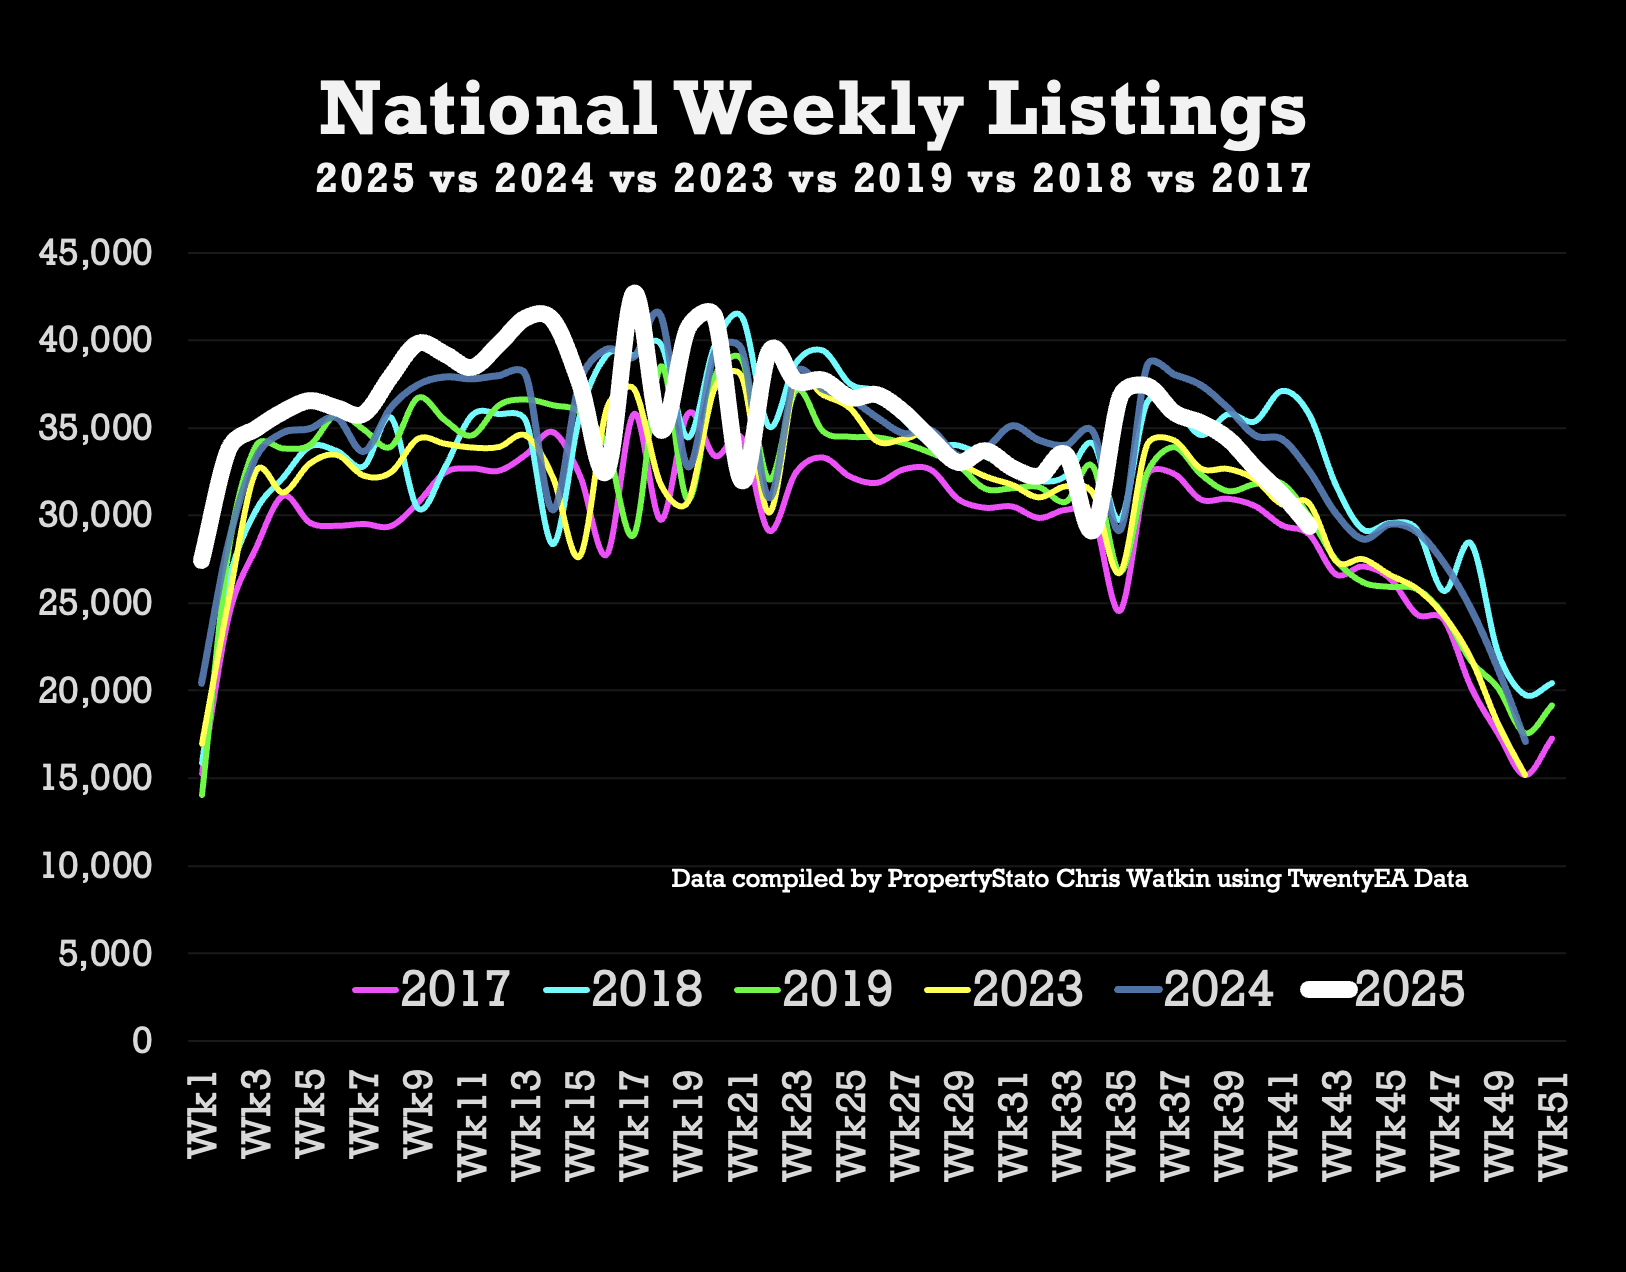
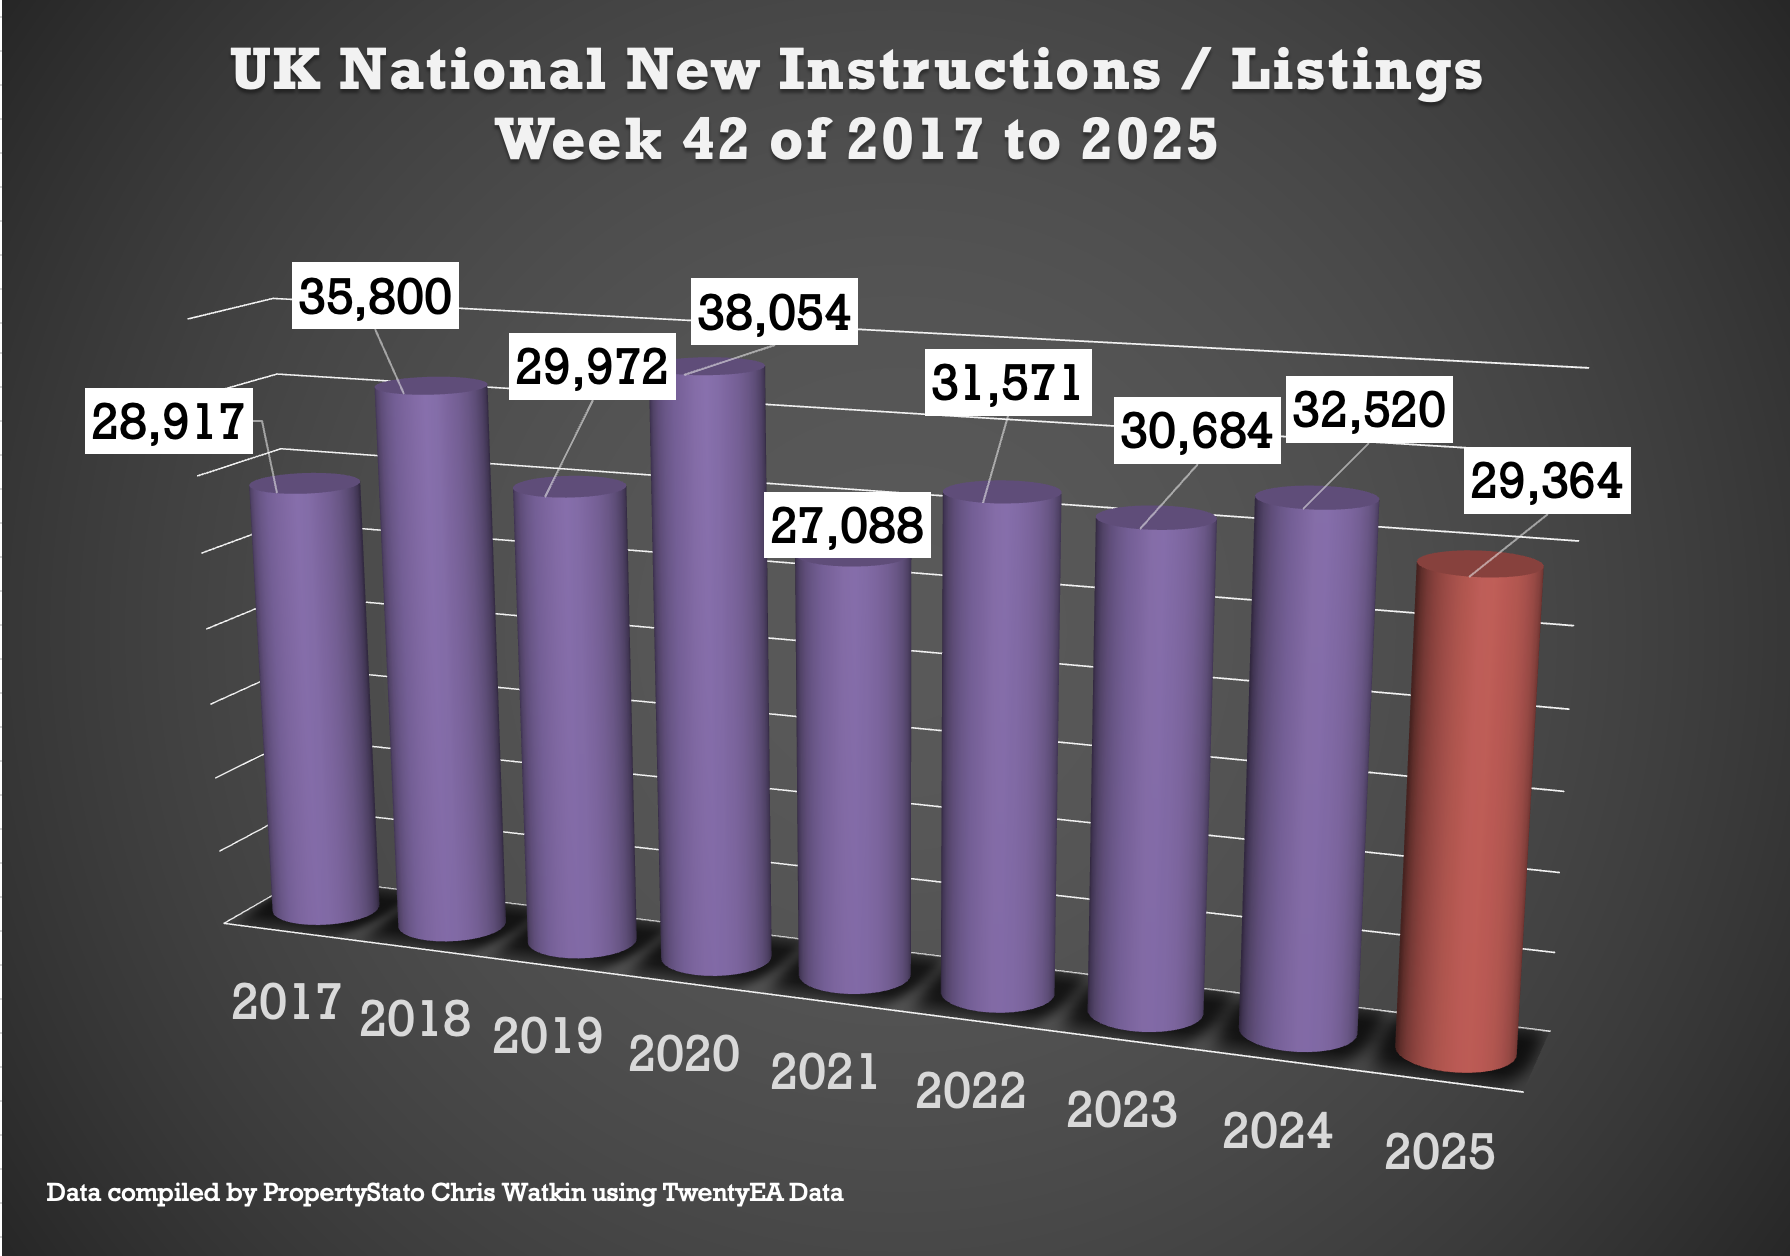
+ 29.3k new properties came to market this week, down as expected from 31.2k last week.
+ 2025 weekly average: 35.8k.
+ Nine year week 42 average :31.5k
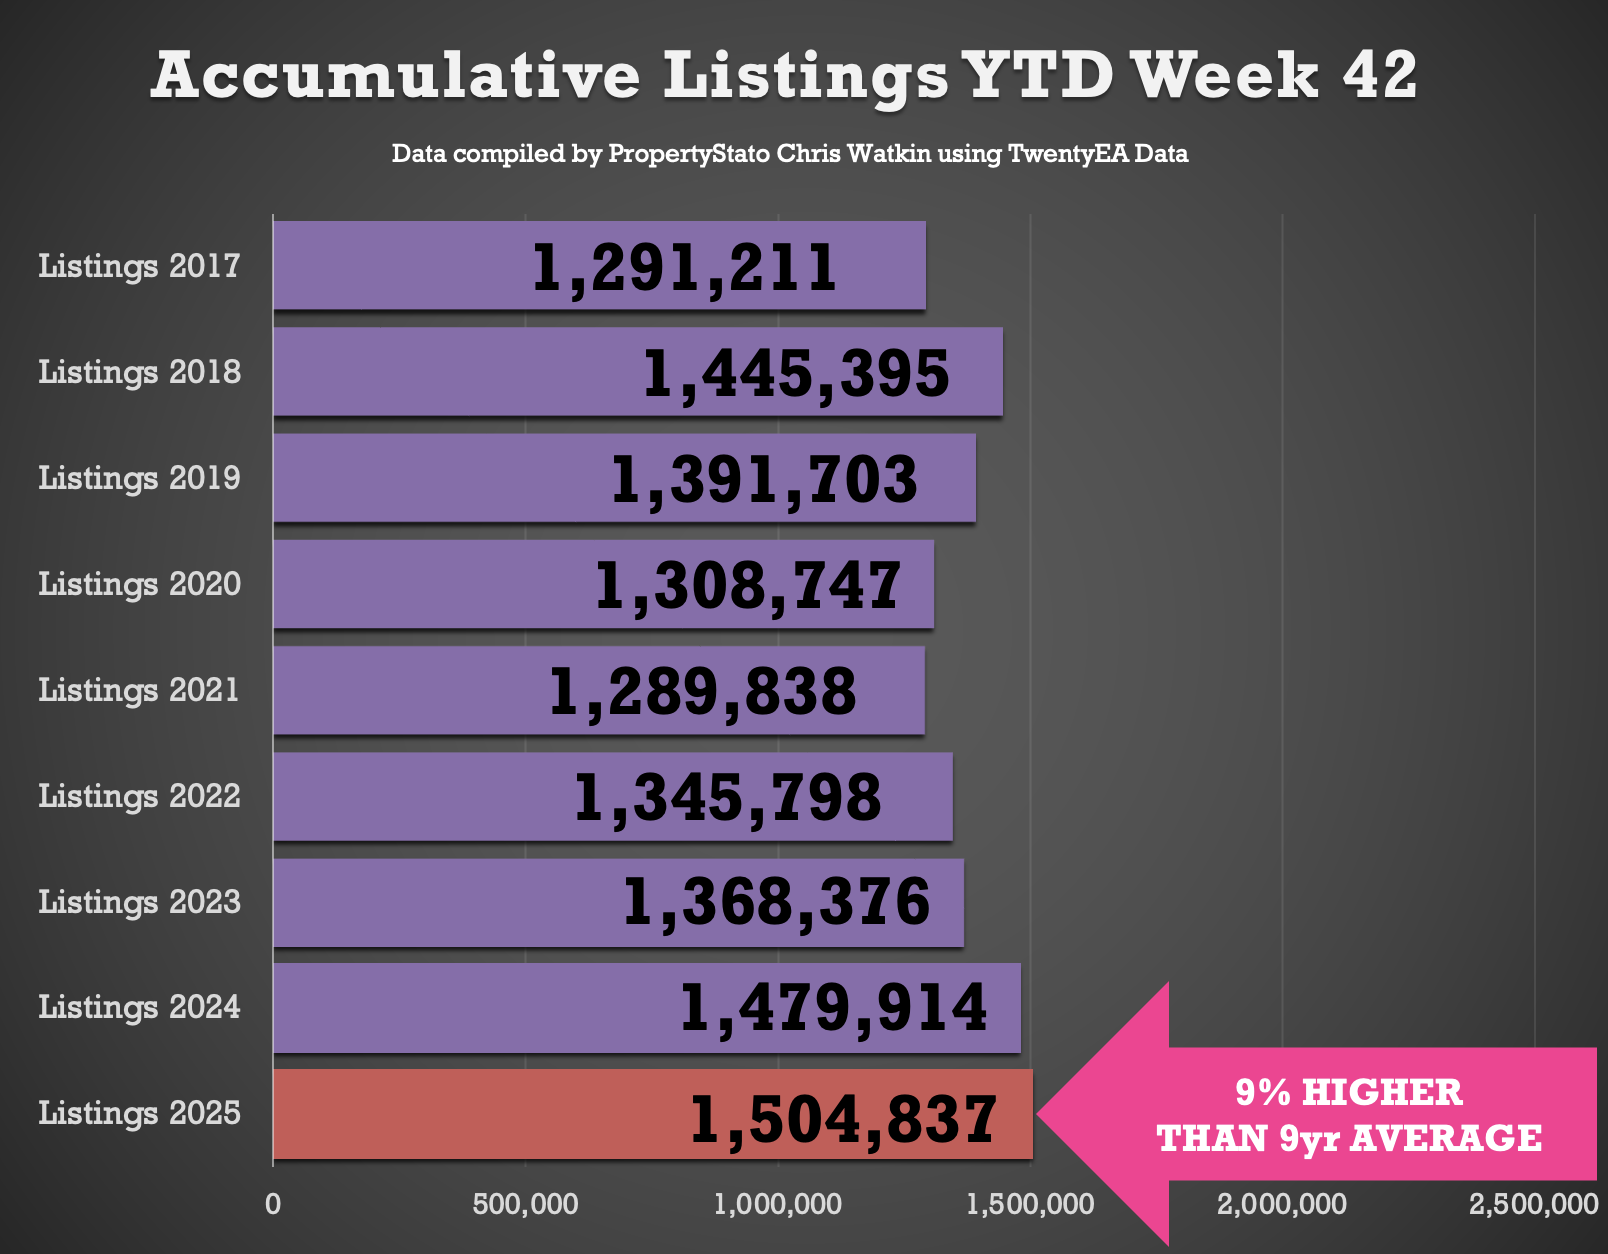
+ Year-to-date (YTD): 1.50m new listings, 1.7% higher than 2024 YTD (1.48m) and 9% above the 2017–19 average (1.38m).
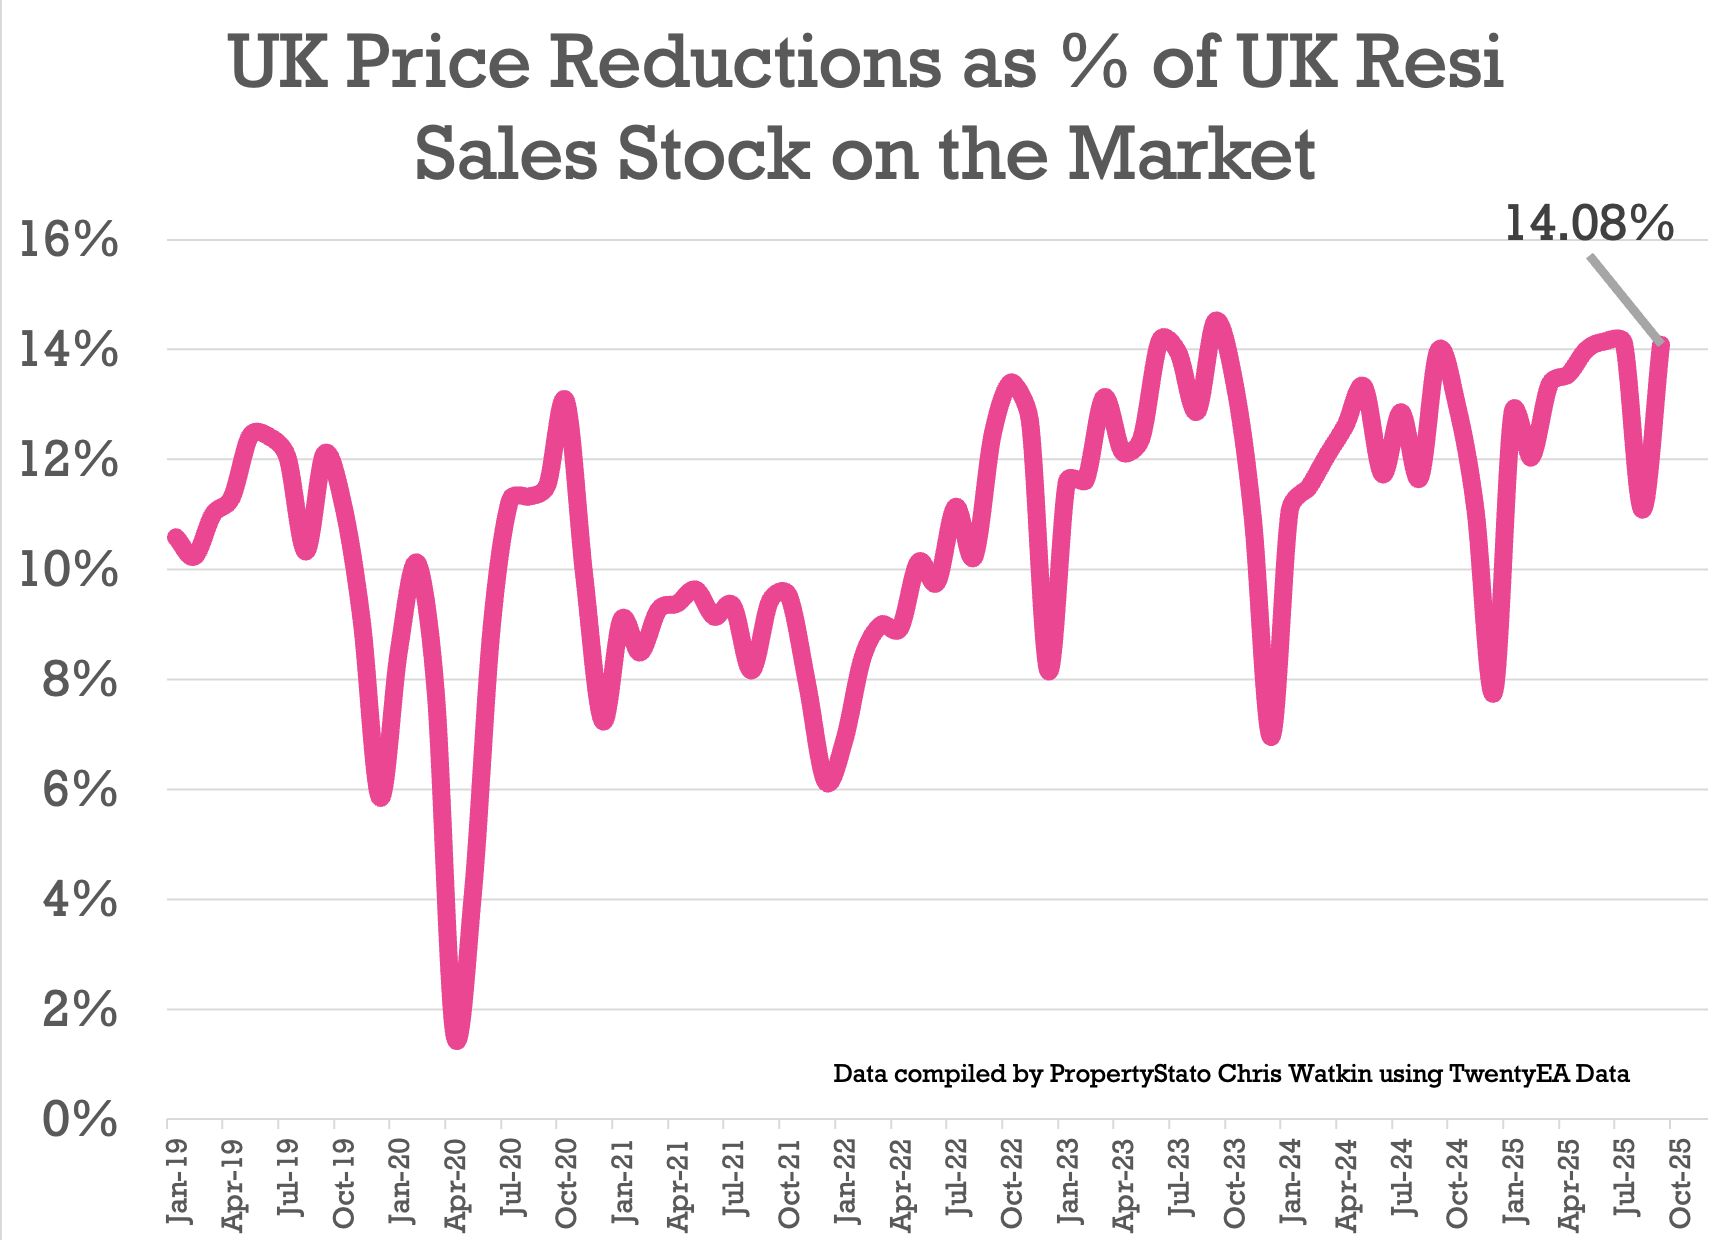
✅ Price Reductions
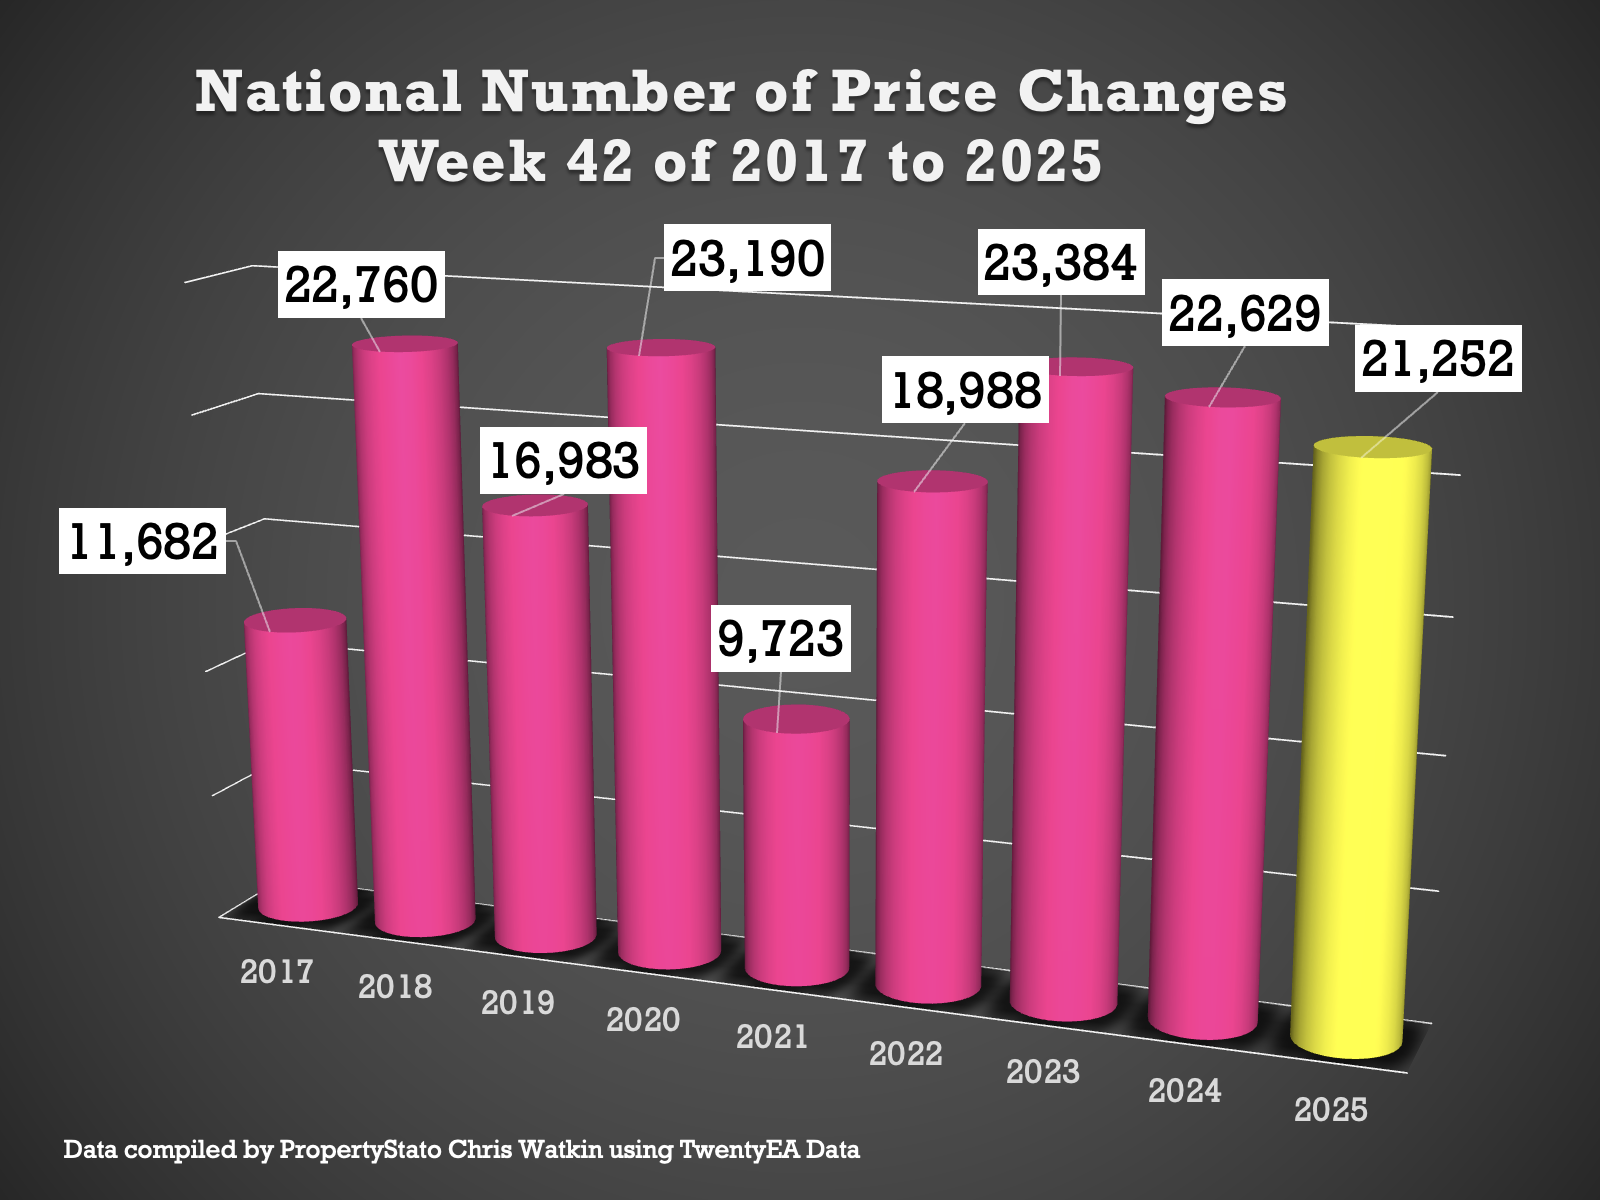
+ 21.3k reductions this week, lower as expected, than last week’s at 23.2k.
+ Increase in the number of homes on the market being reduced in September to 14.1% (these stats are always done a month in arrears). In August, it was 11.1% (everyone must have been on holiday!), whilst it was 14.1% in July and 14% in June.
+ 2025 average so far: 13.2%, versus the five-year long-term average of 10.74%.
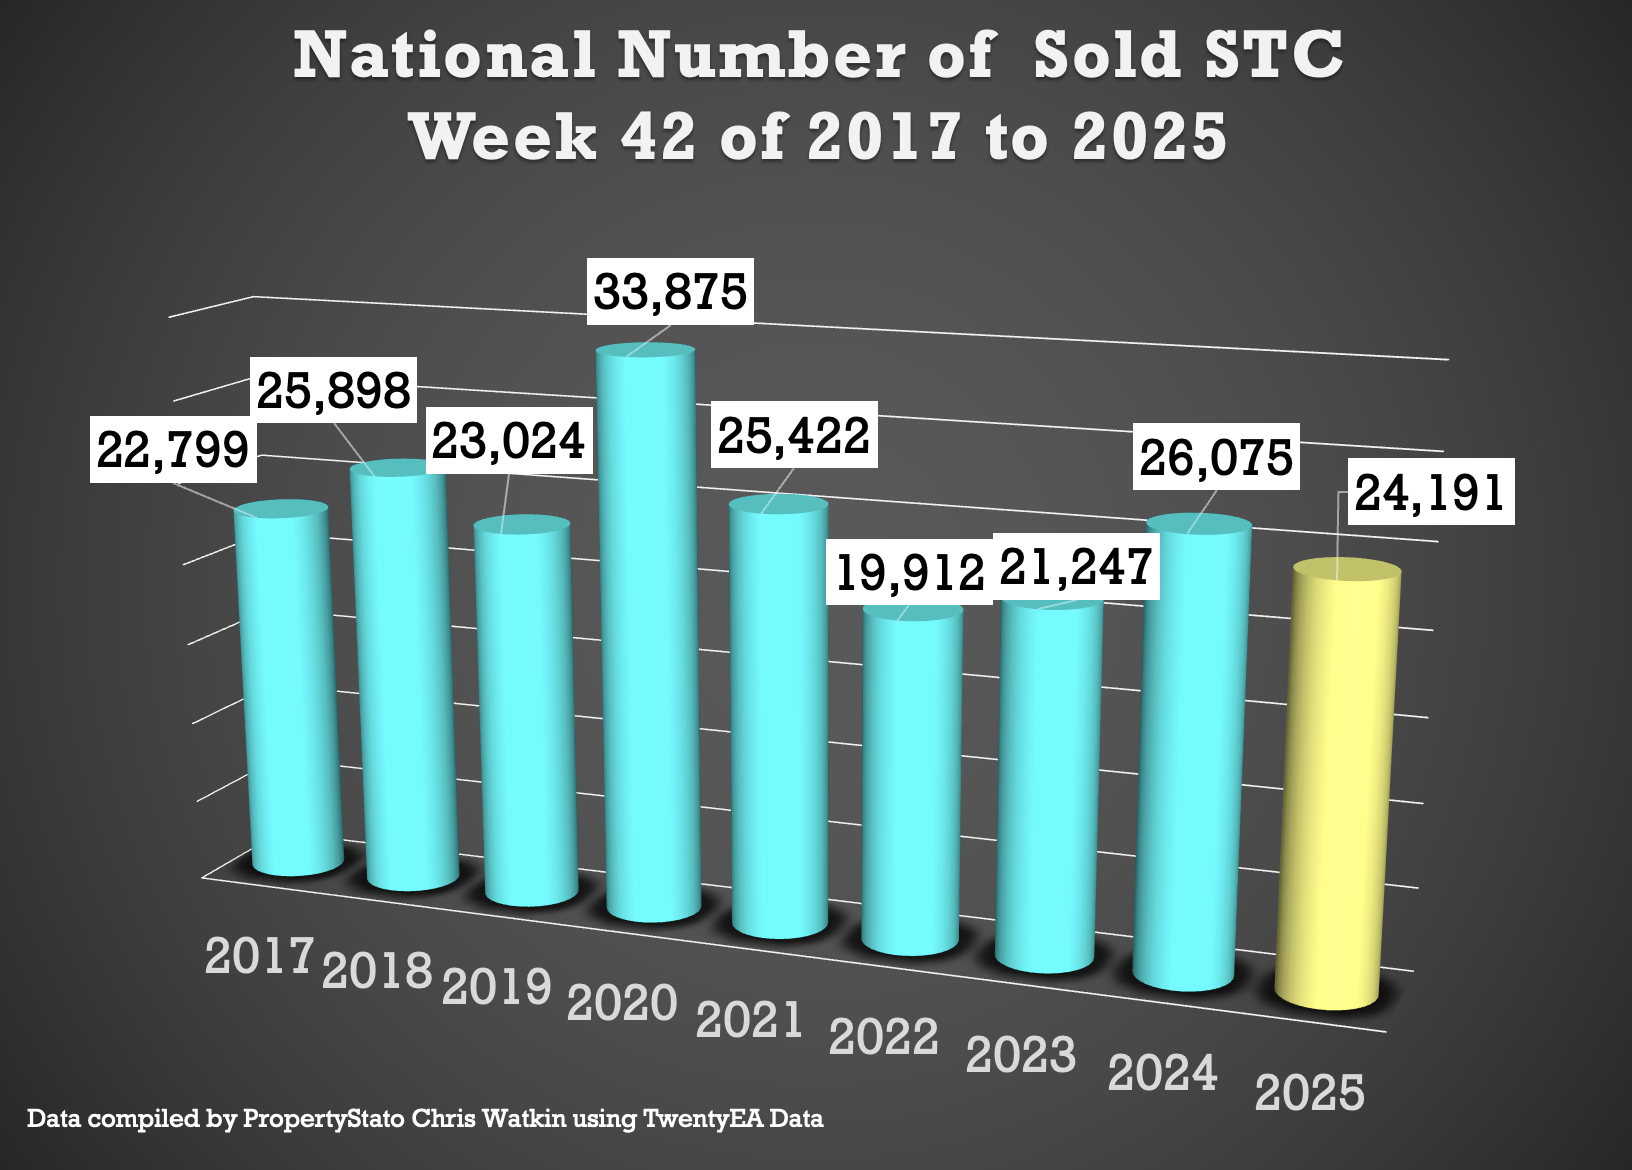
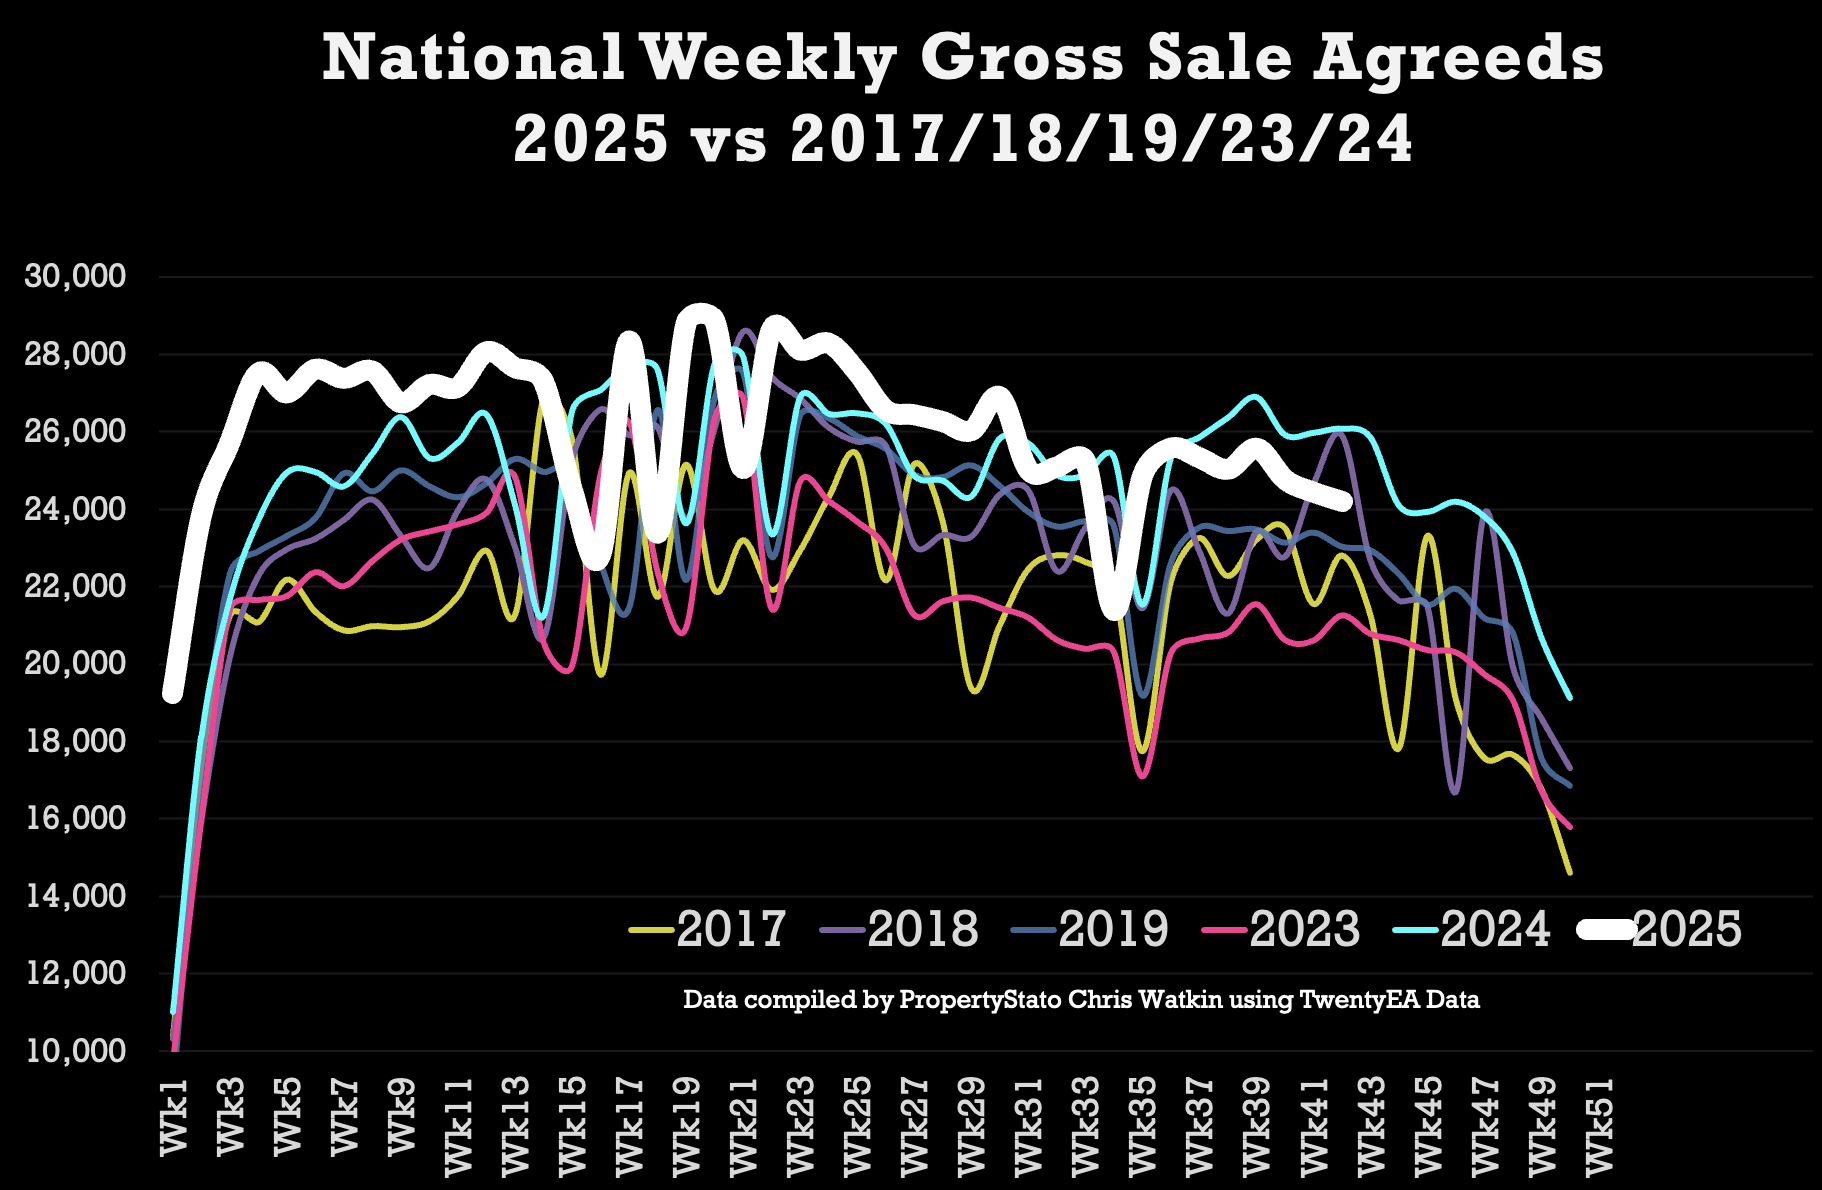
✅ Sales Agreed
+ 24.2k homes sold subject to contract this week, down as expected from 24.4k last week.
+ Week 42 average (for last 9 years) :24.7k
+ 2025 weekly average : 26k.
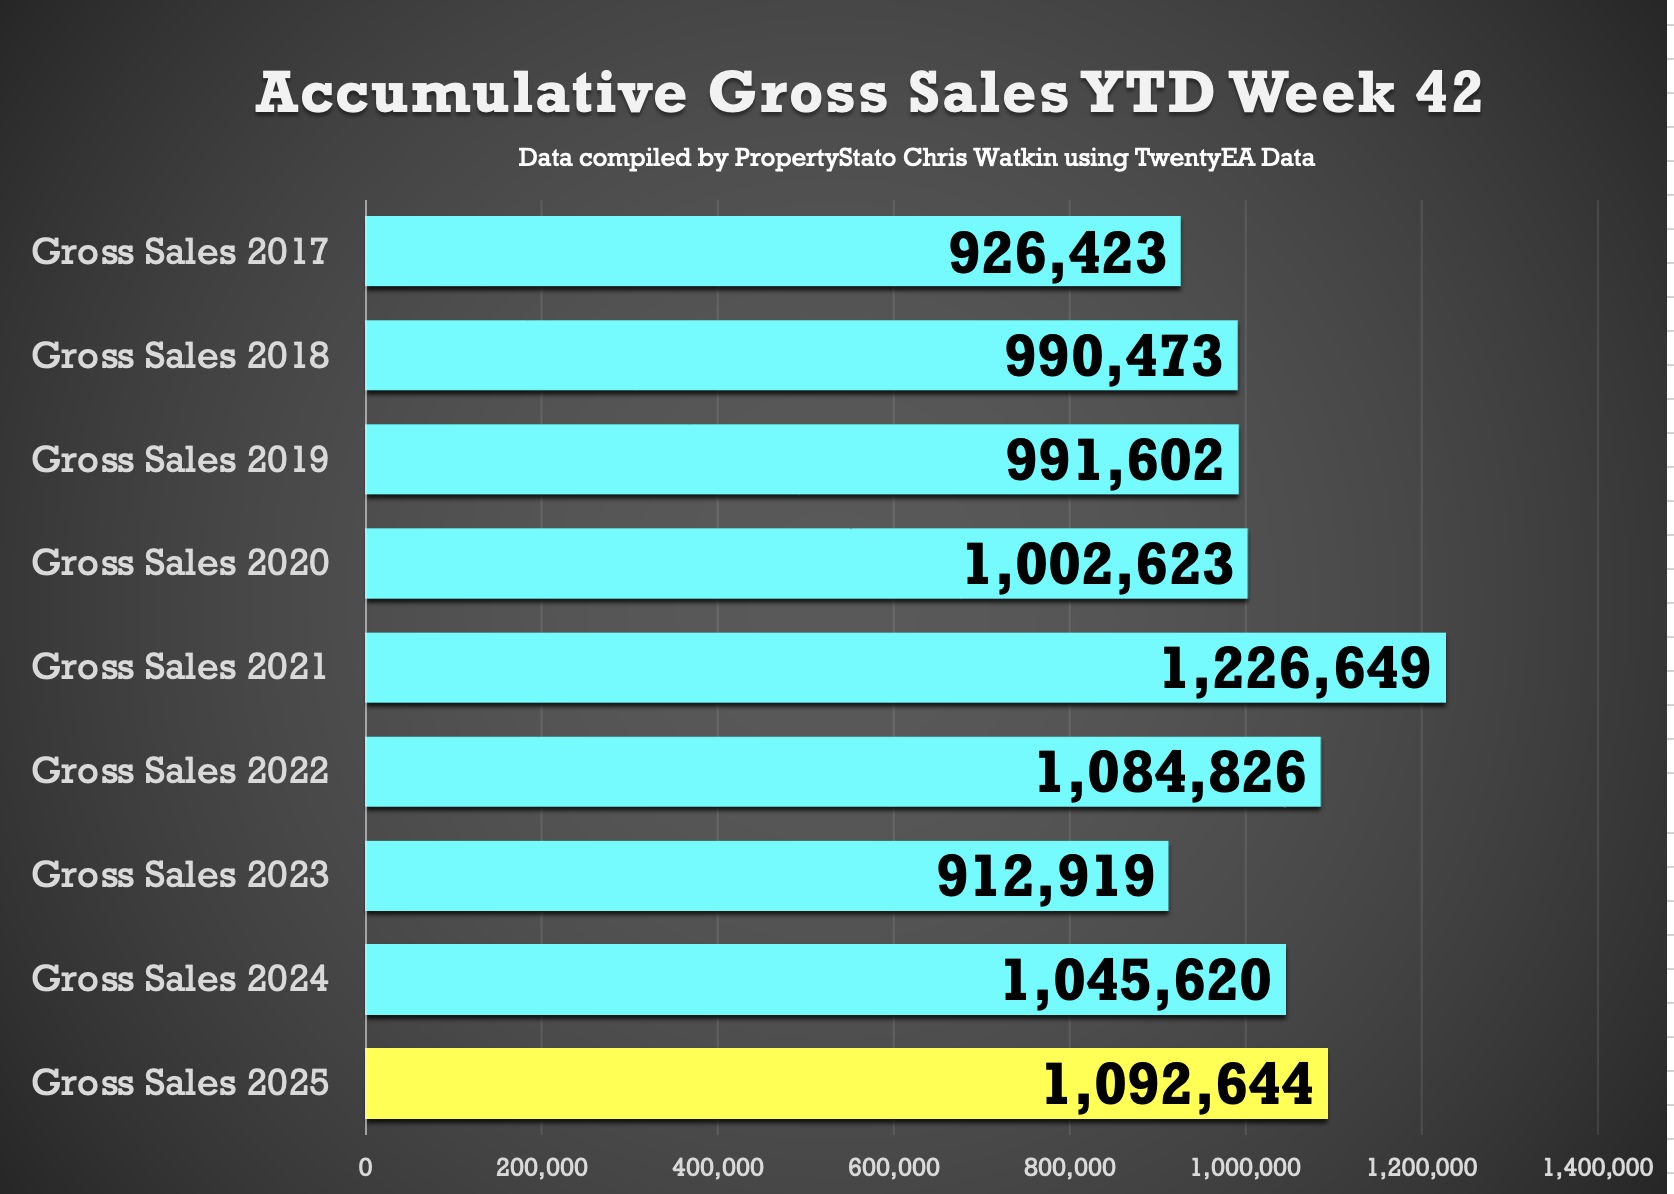
+ YTD: 1.092m gross sales, which is 4.5% ahead of 2024 (1.046m) and 12.7% above the 2017–19 average (922k).
✅ Price Diff between Listings & Sales
+ Average Asking Price of listings last week £401k vs Average asking price of Sales Agreed (SSTC) – £359k – a 11.7% difference (long term 9 year average is 16% to 17%)…
+ Interestingly, the average listing price has dropped from £464k in the first 3 weeks of Sept to £420k in October.. ie cheaper homes are being listed

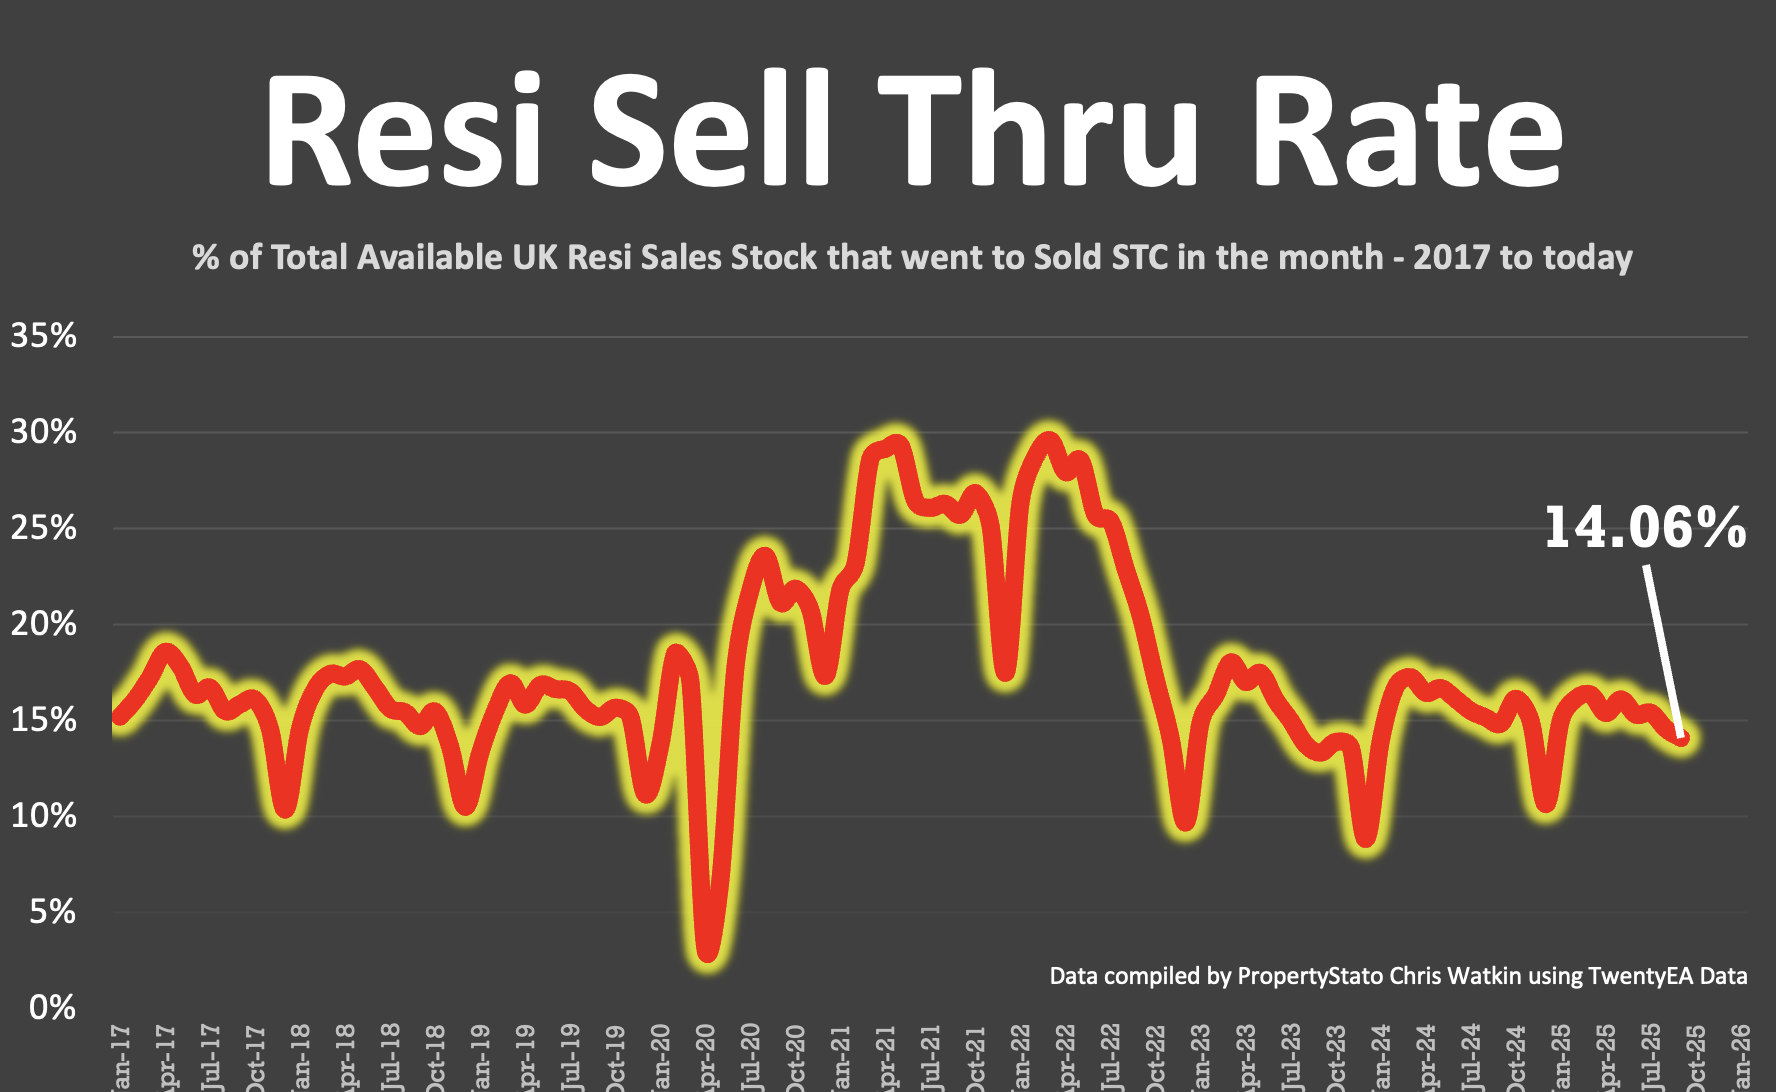
✅ Sell-Through Rate
+ 14.1% of homes on agents’ books went SSTC in September. (October figures to follow in November)
+ Down from 14.5% in Aug, 15.4% in July, 15.3% in June, and 16.1% in May.
+ Pre-Covid average: 15.5%.
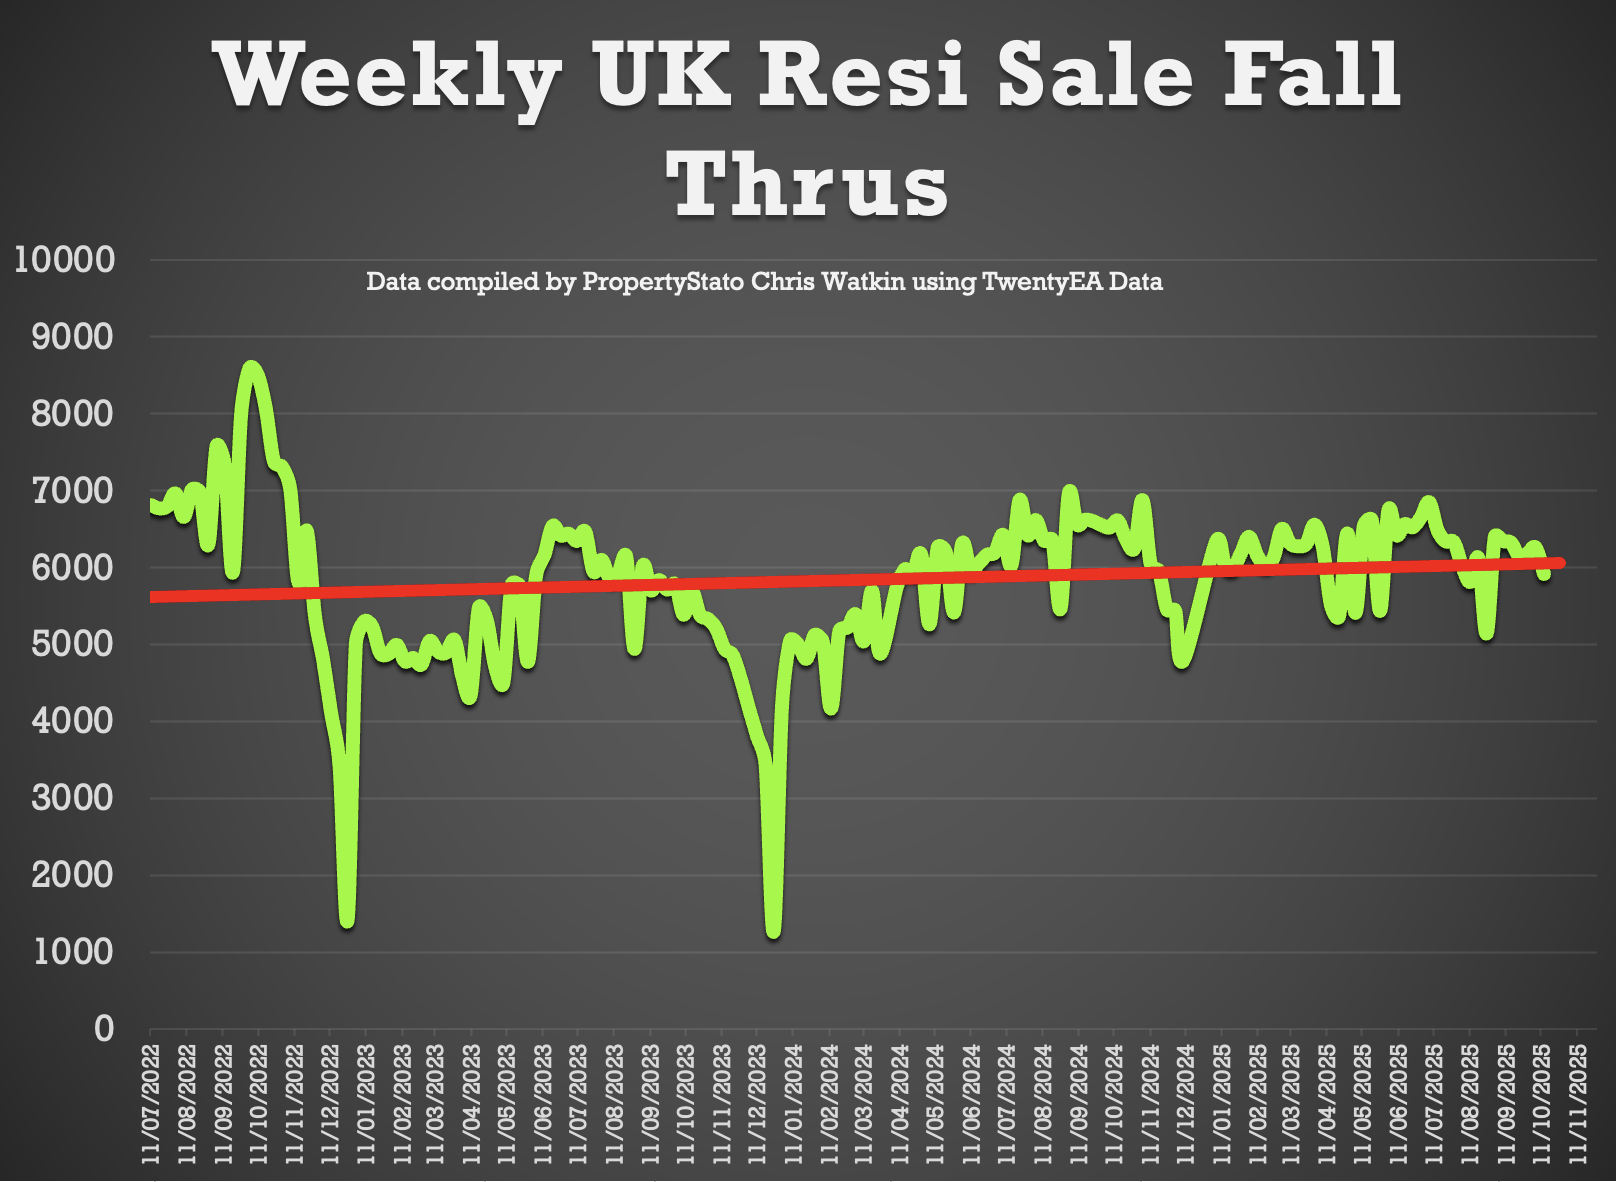
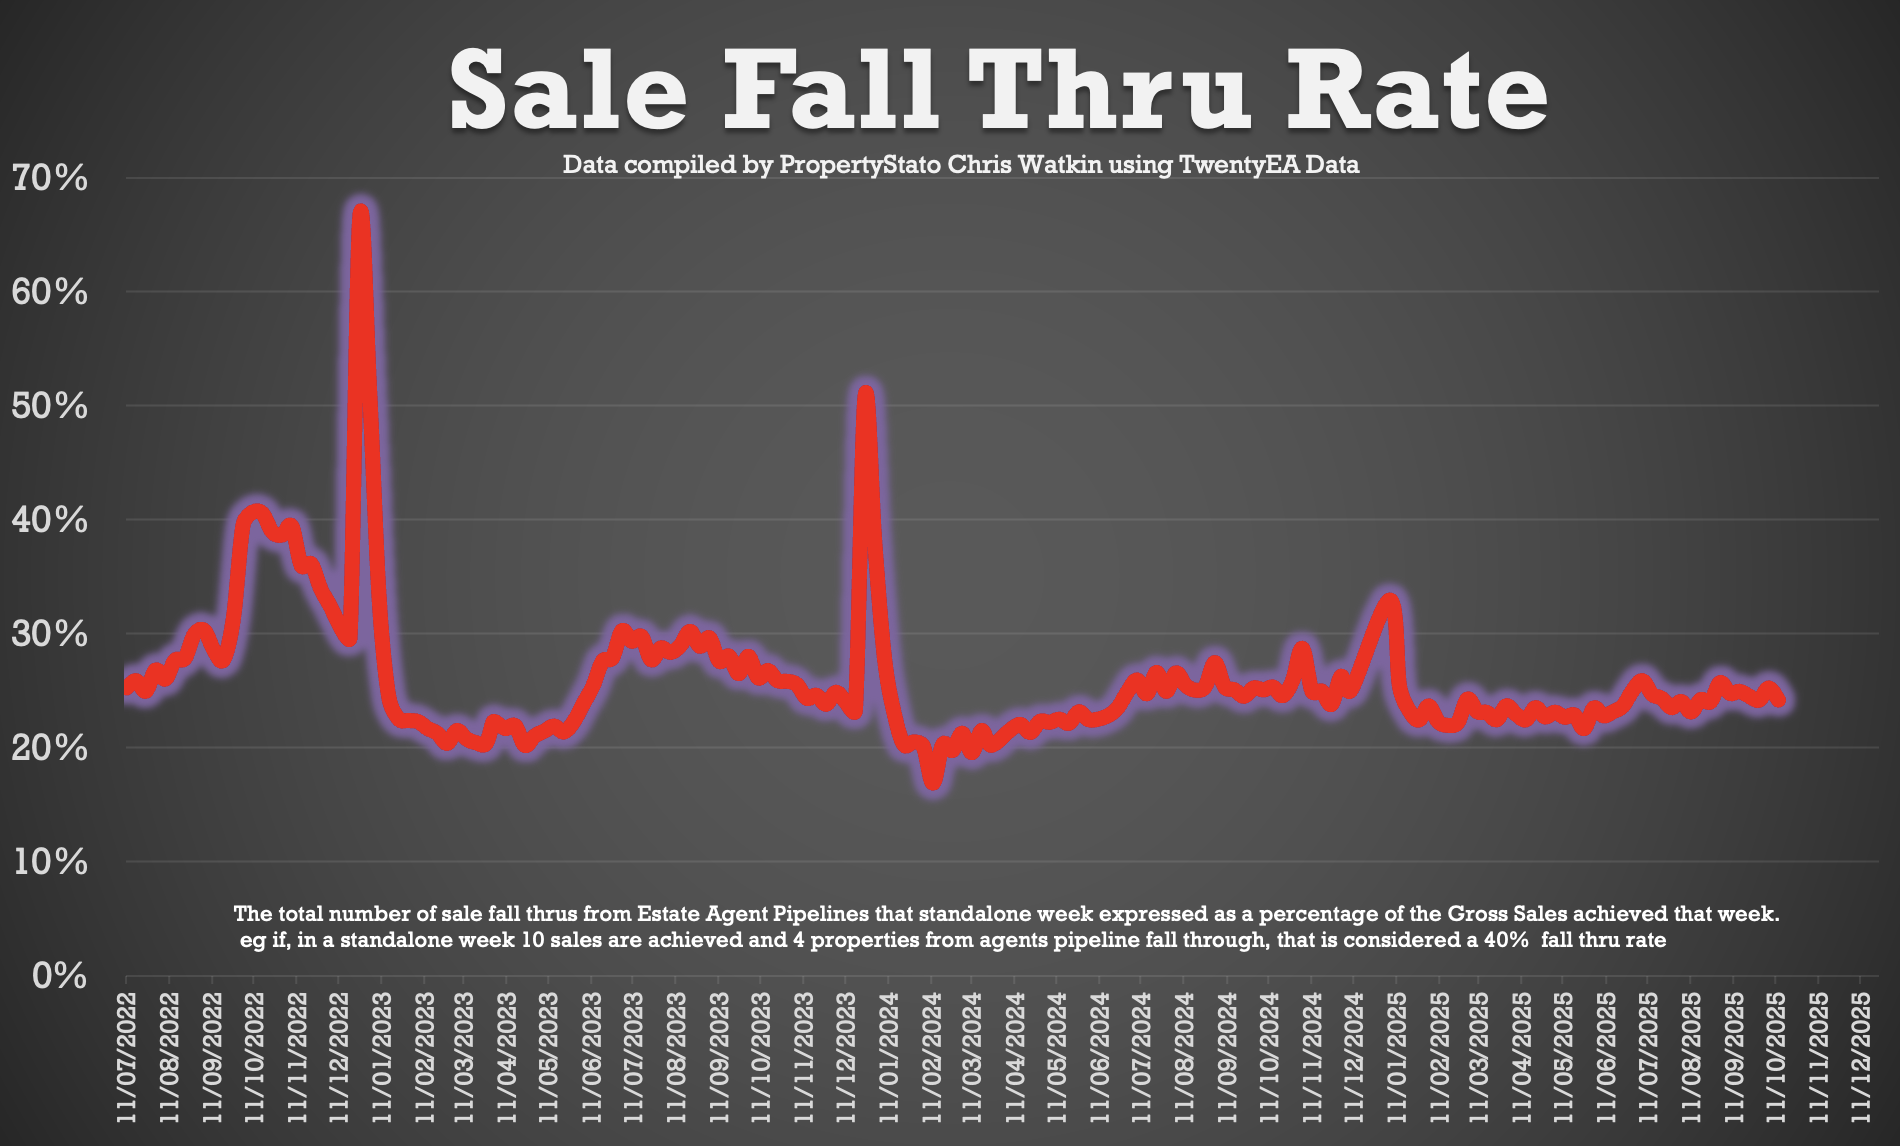
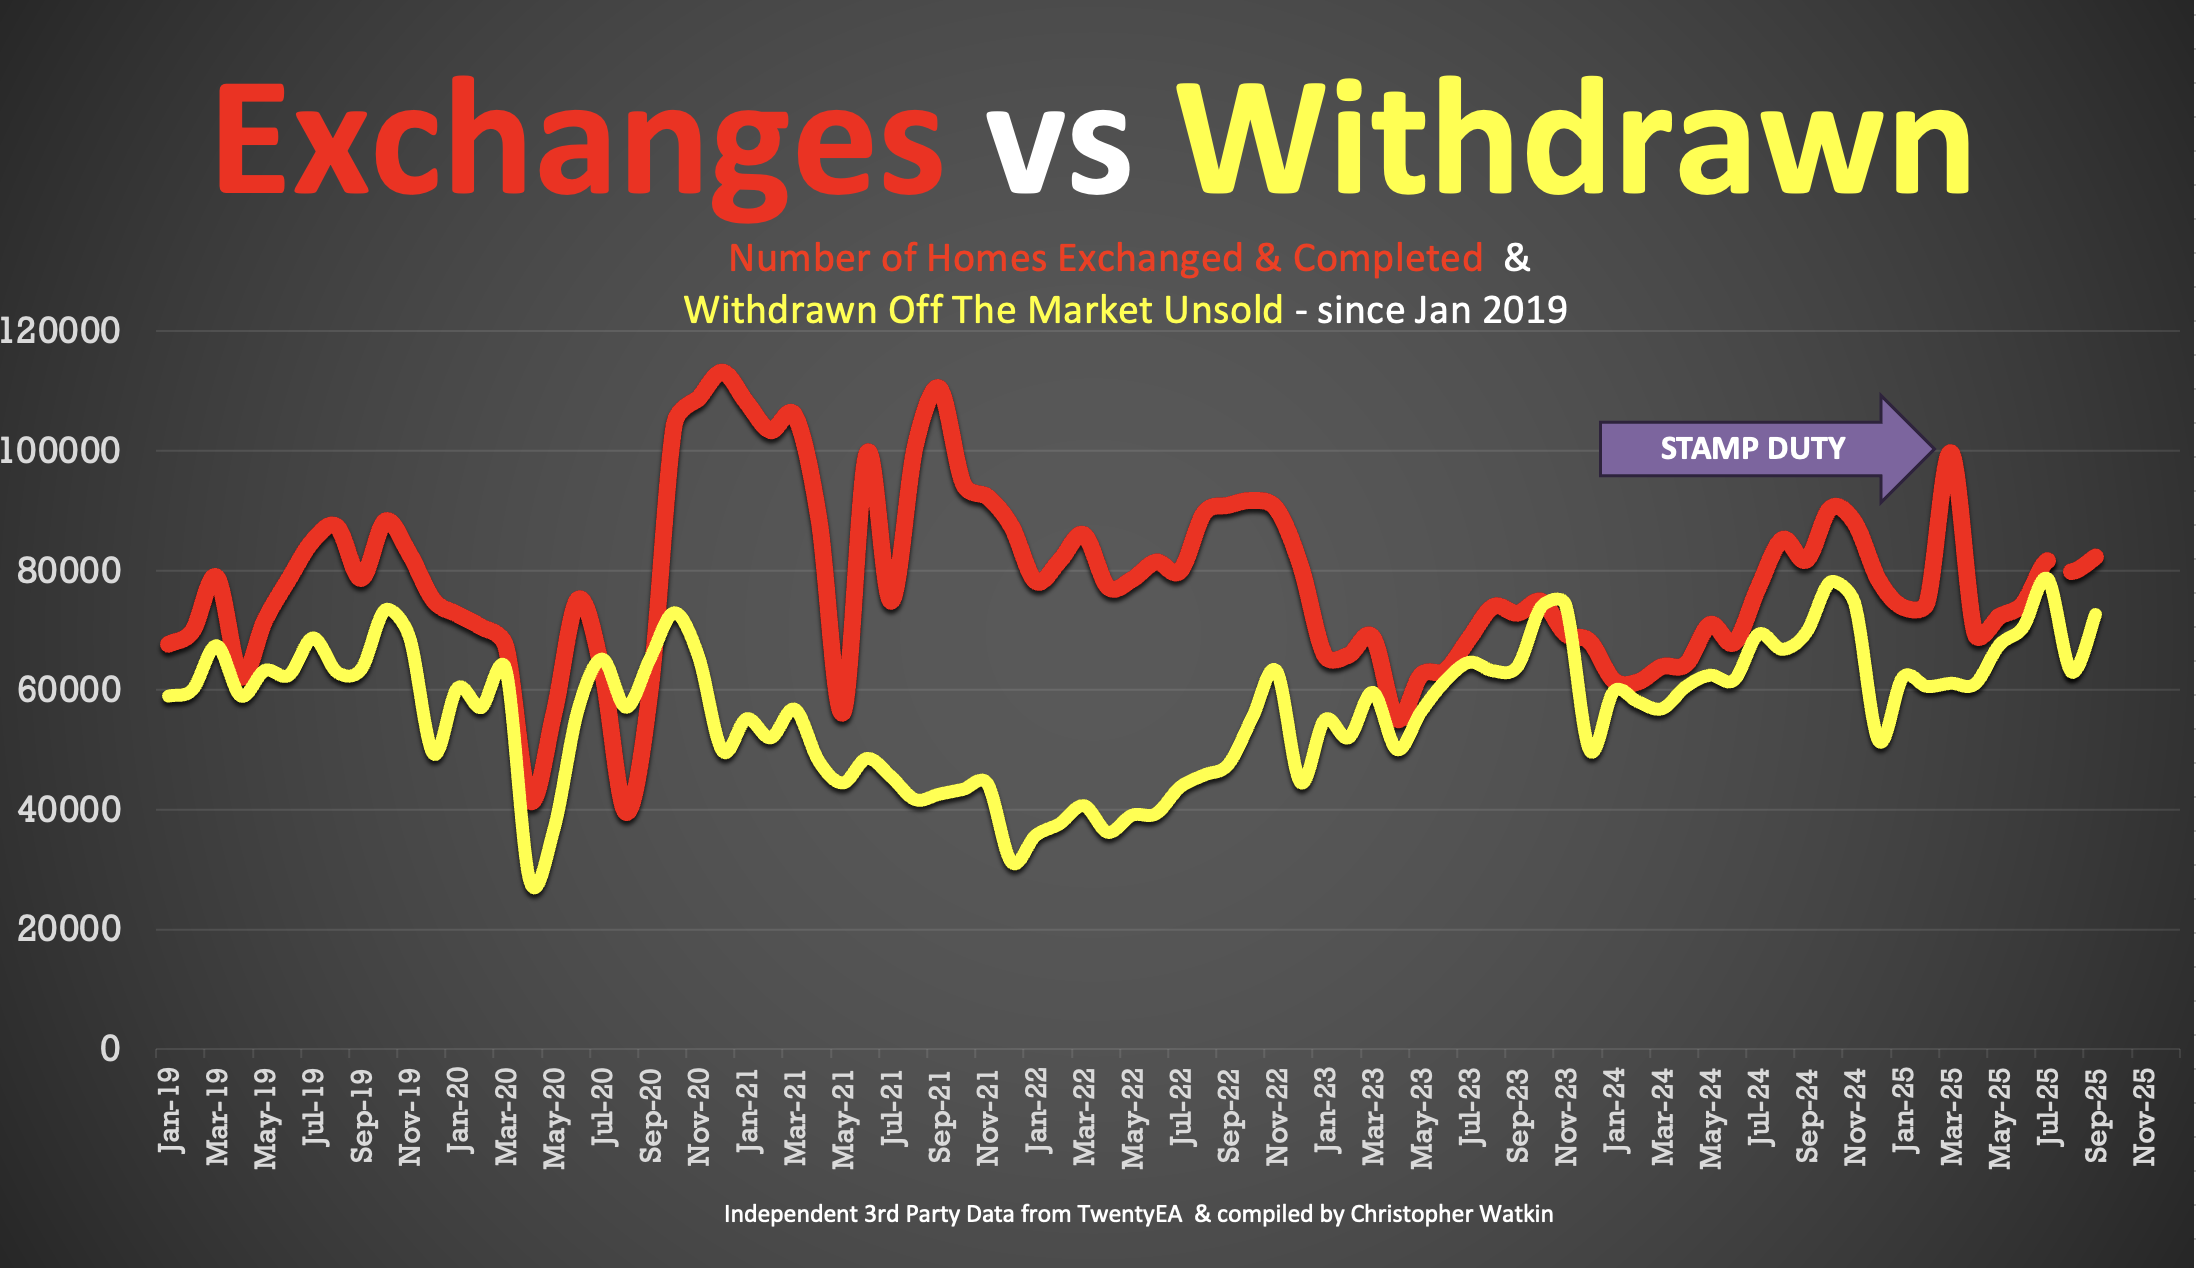
✅ Fall-Throughs
+ 5,898 fall-throughs last week (pipeline of 510k home Sold STC).
+ Weekly average for 2025: 6,210.
+ Fall-through rate: 24.3%, slightly up from 24.2% last week.
+ Long-term average: 24.2% (post-Truss chaos saw levels exceed 40%).
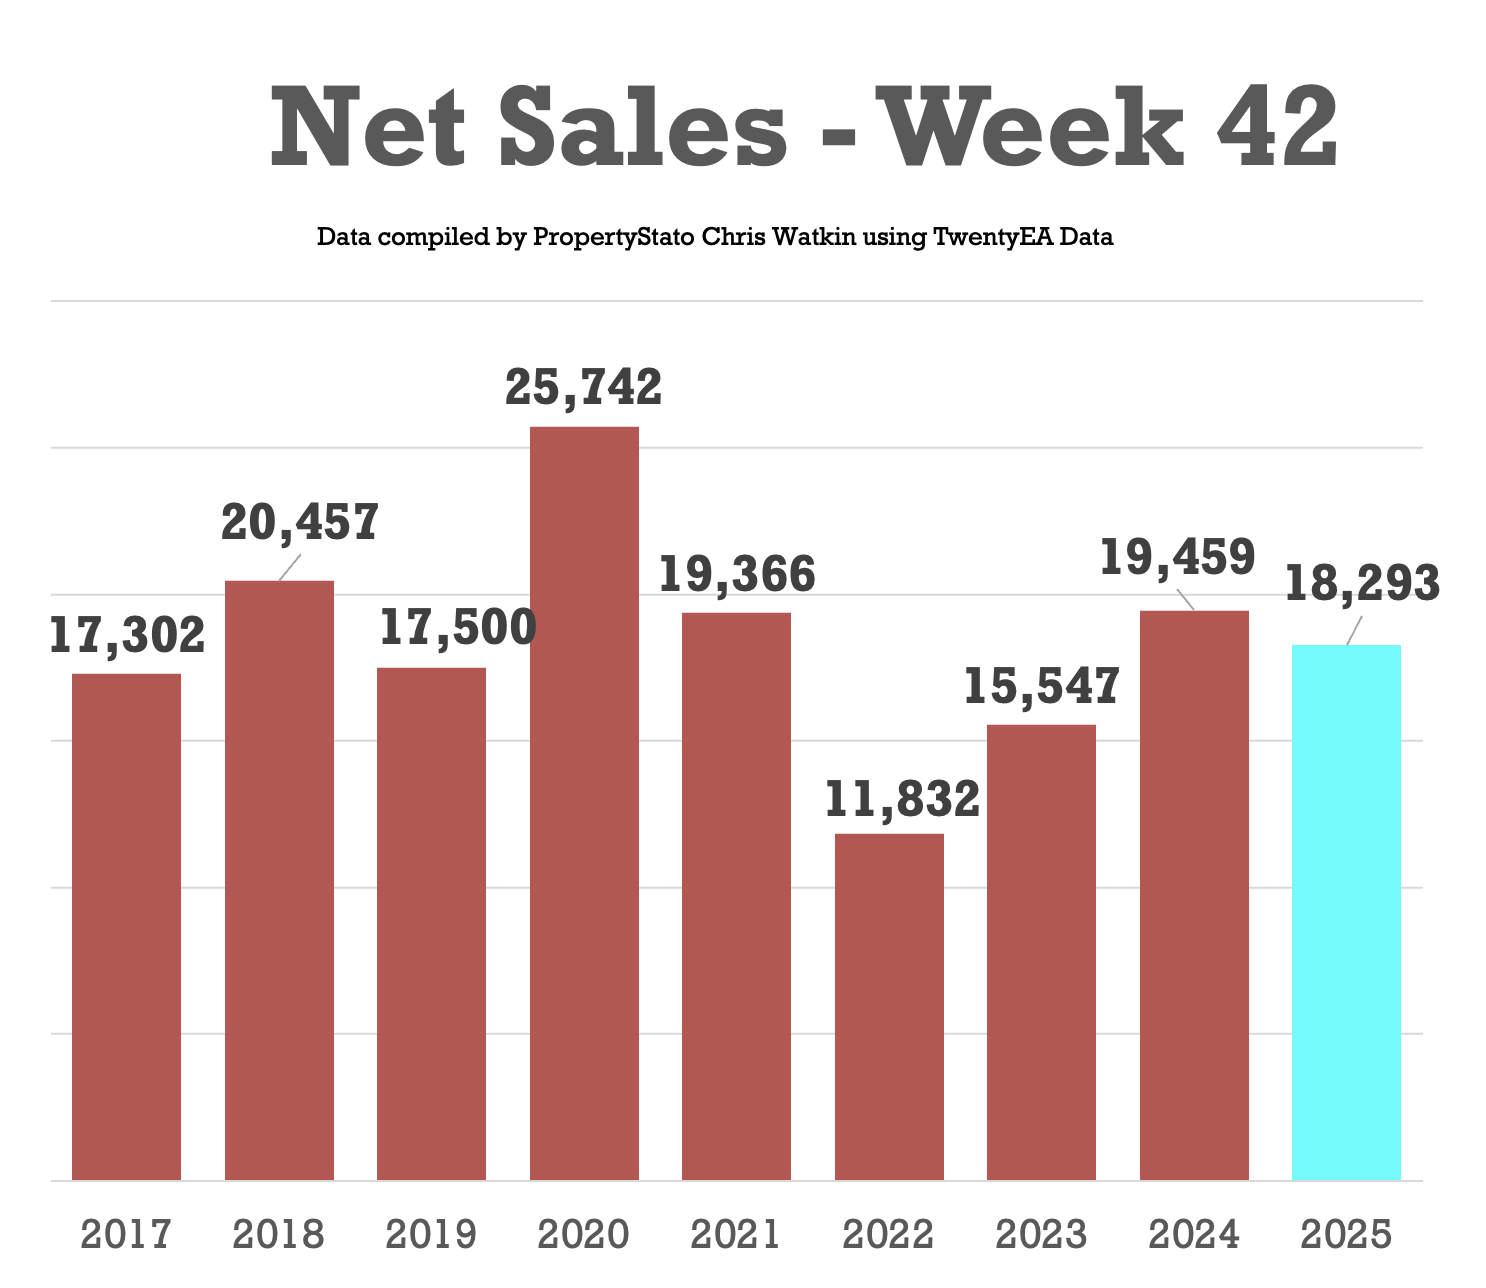
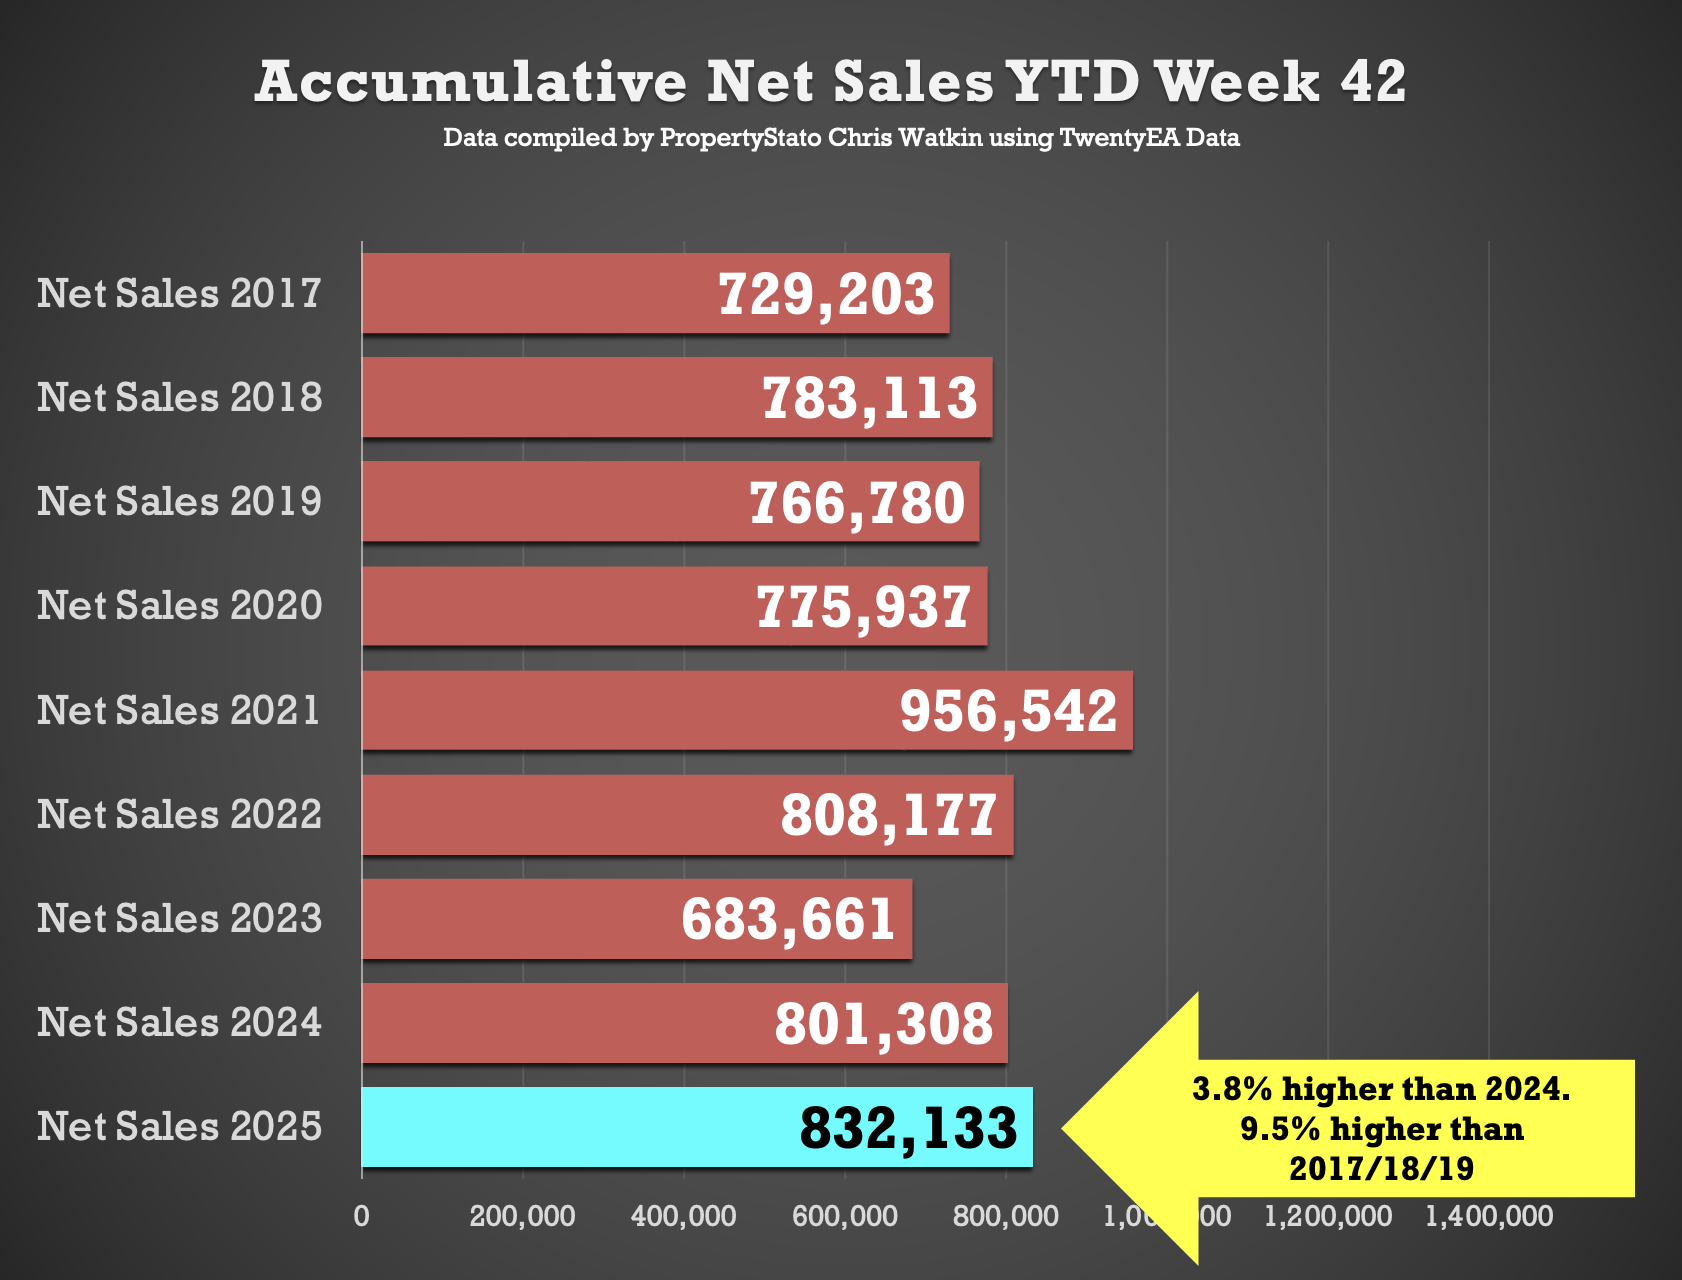
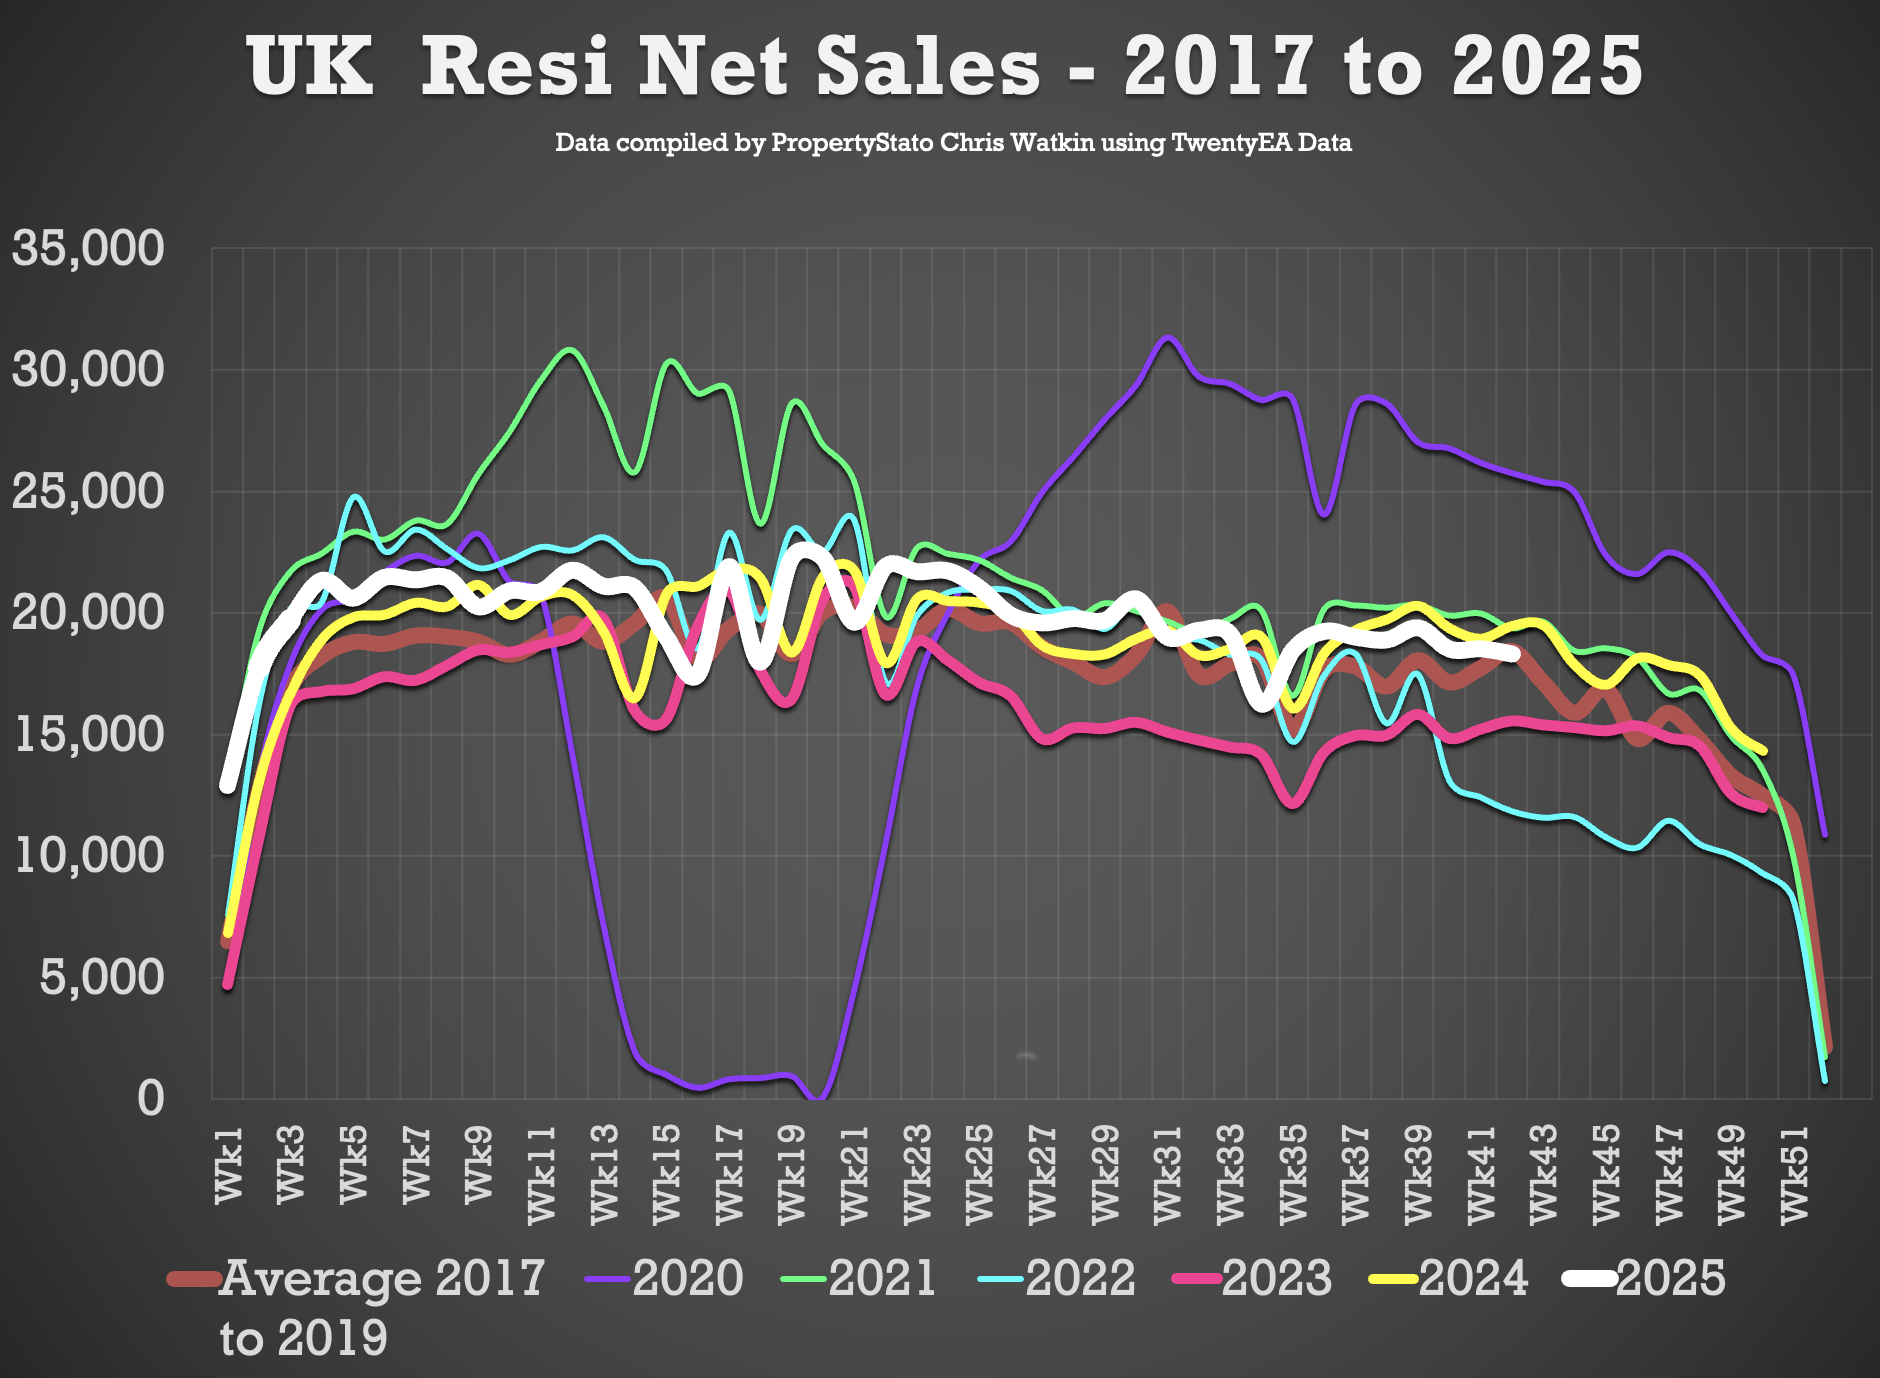
✅ Net Sales
+ 18.3k net sales this week, down (as expected) from 18.5k last week.
+ Nine-year Week 42 average: 18.4k.
+ Weekly average for 2025: 19.8k.
+ YTD: 832k, which is 3.8% ahead of 2024 (801k) and 9.5% above 2017–19 (760k).
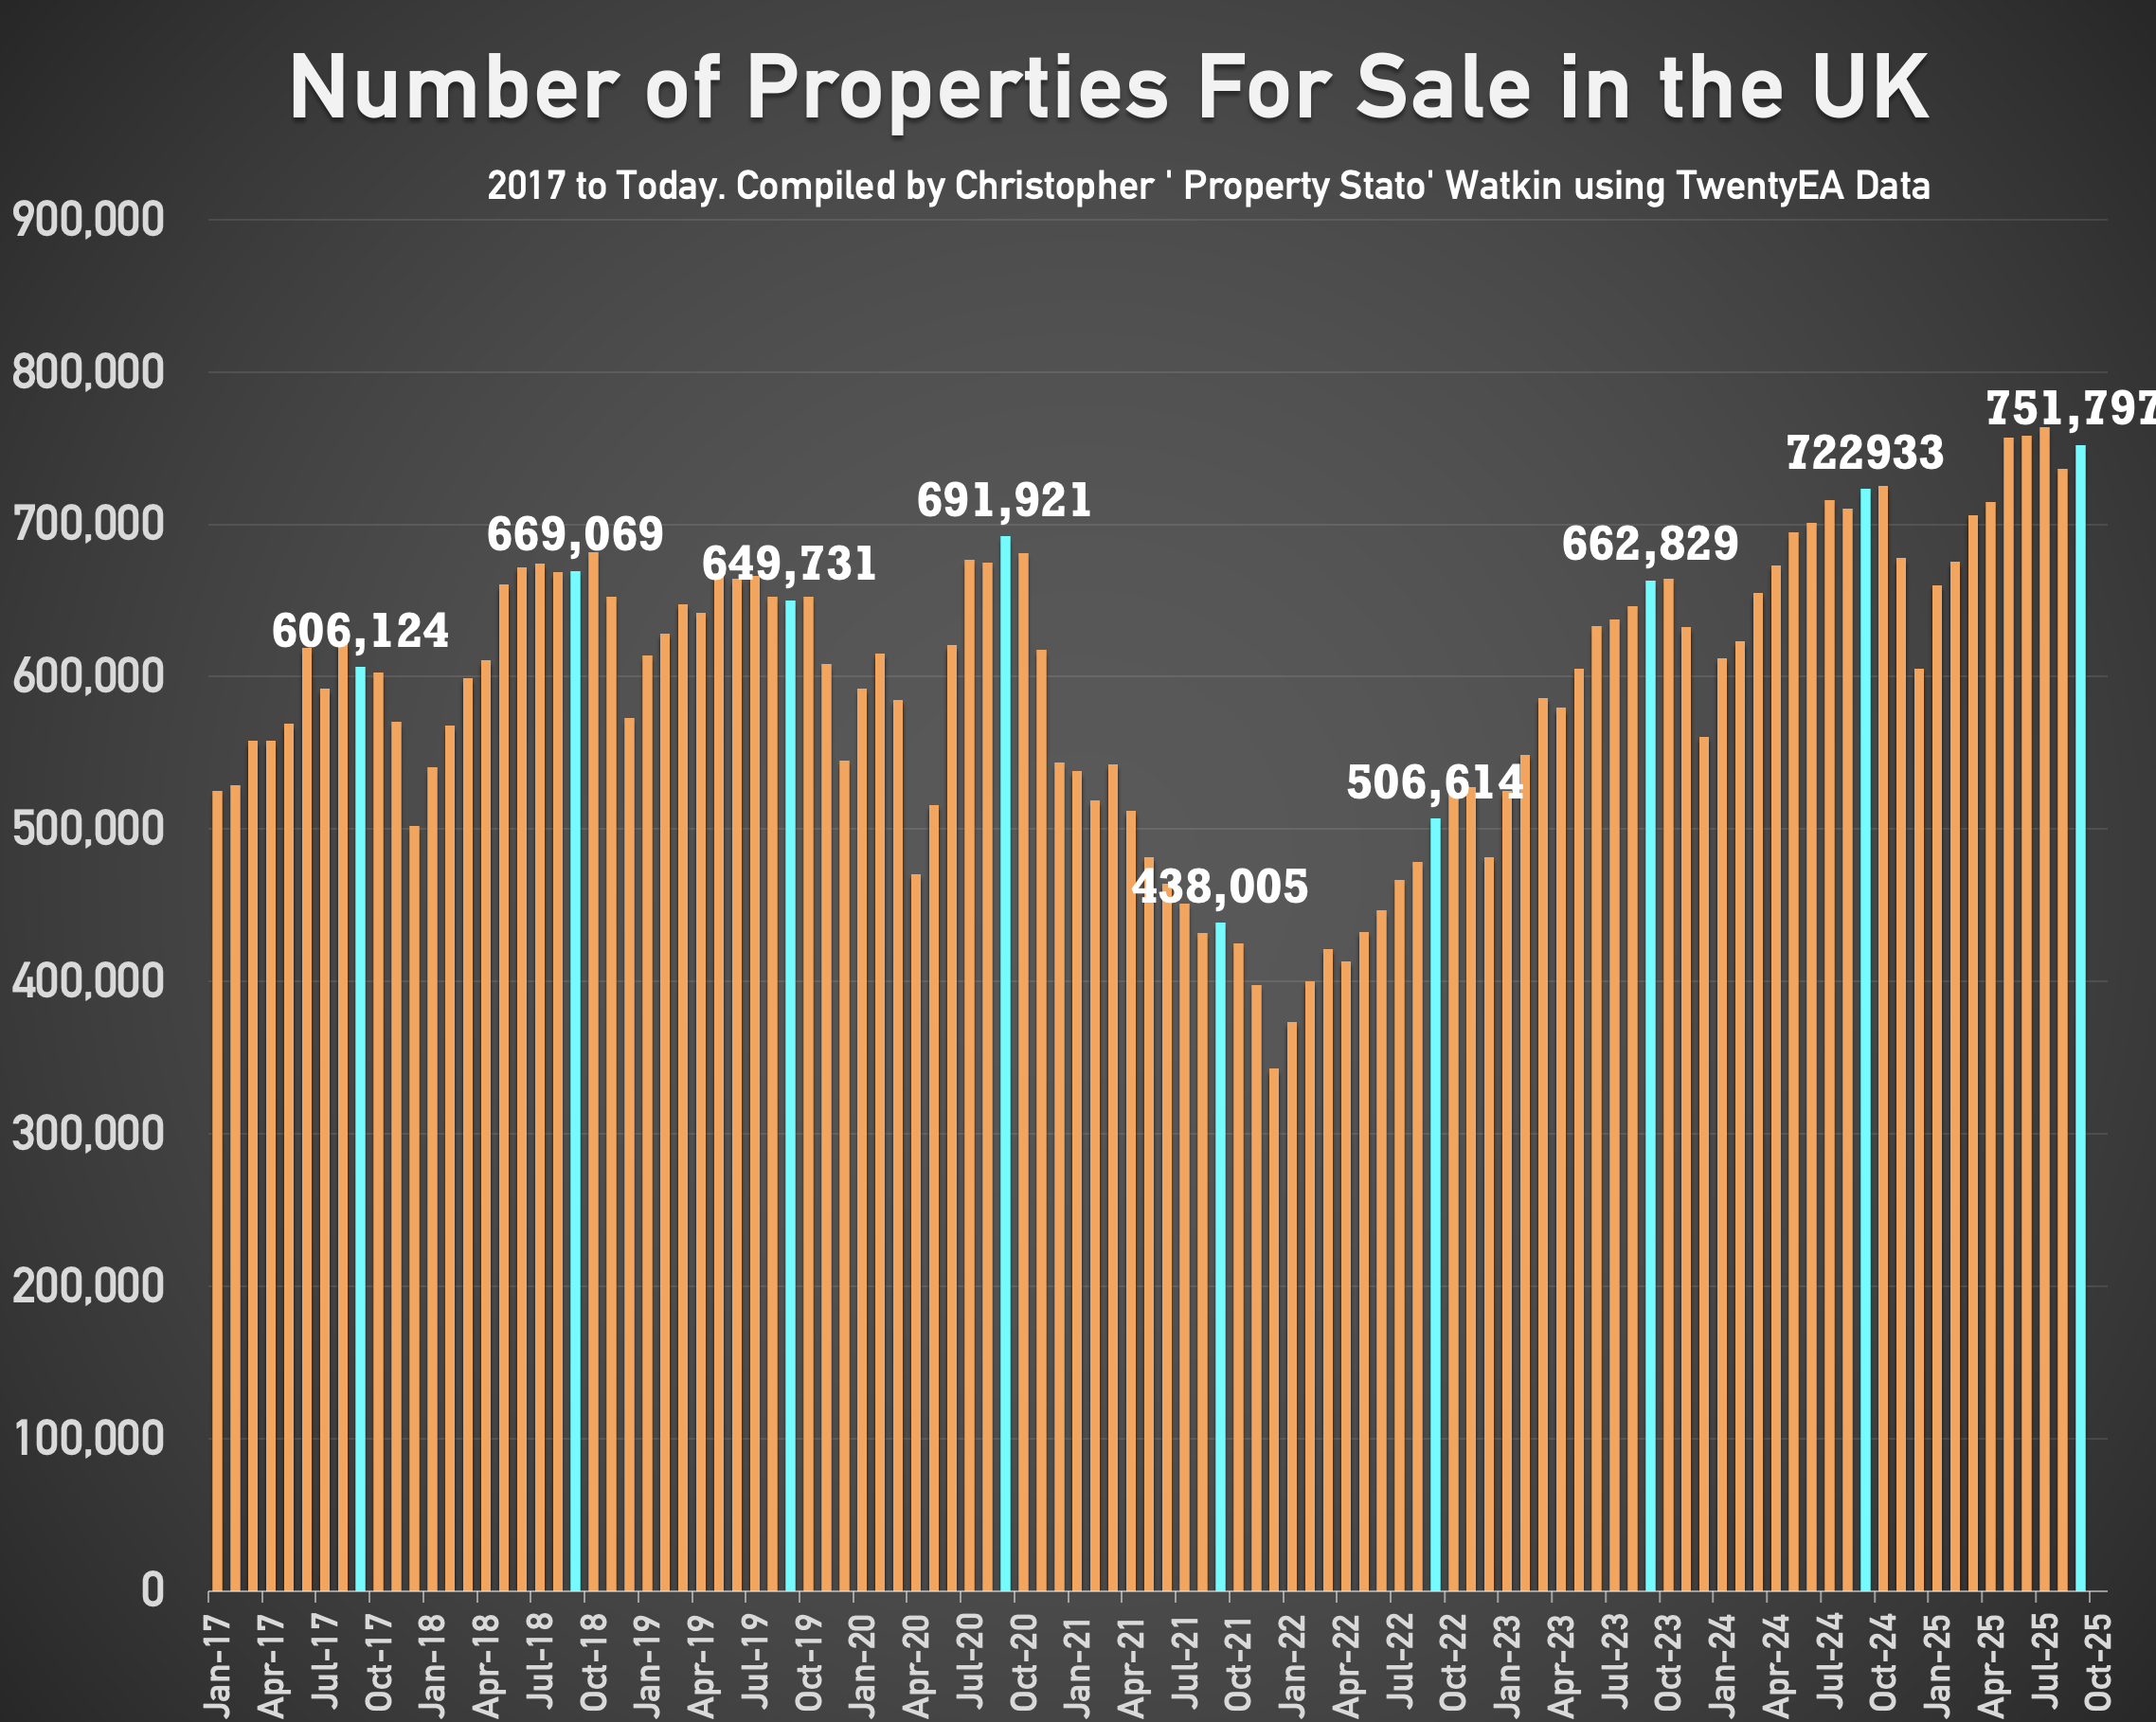
✅ Stock Levels
+ 751k homes on the market at the start of October, 4% higher than October 2024. (723k)
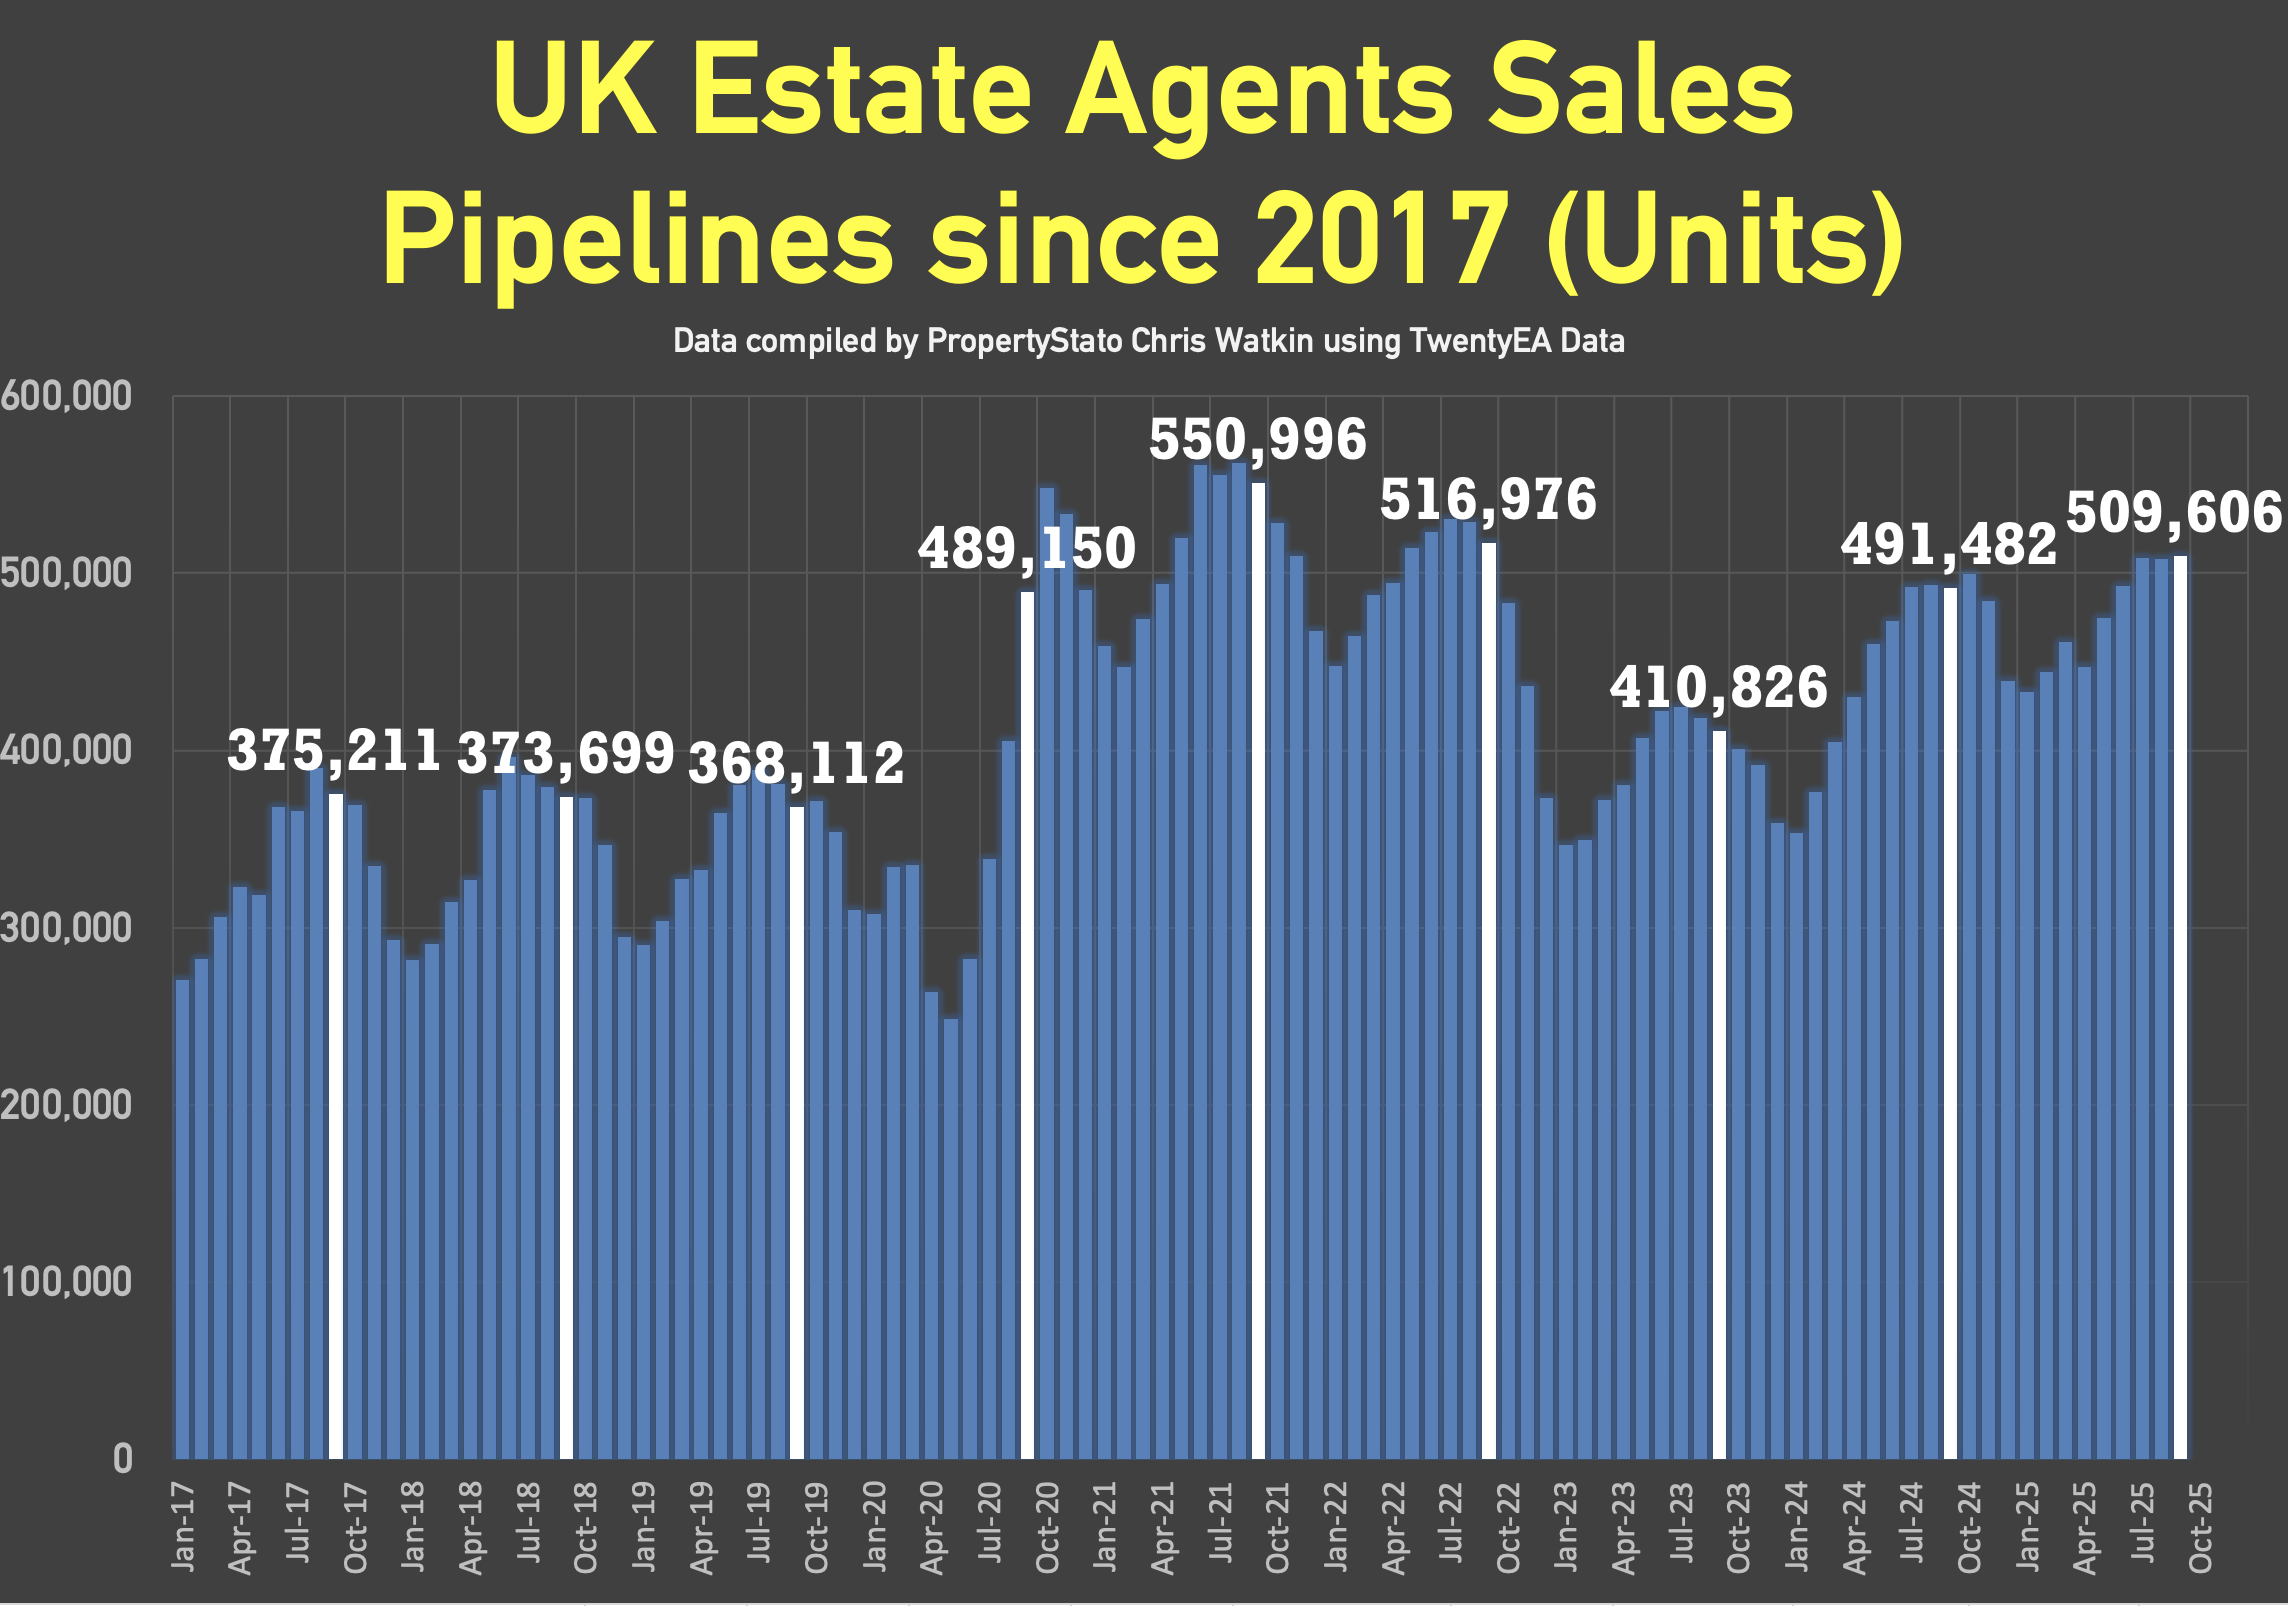
+ 510k homes in sales pipeline on the 1st October, 2% higher than 12 months ago.
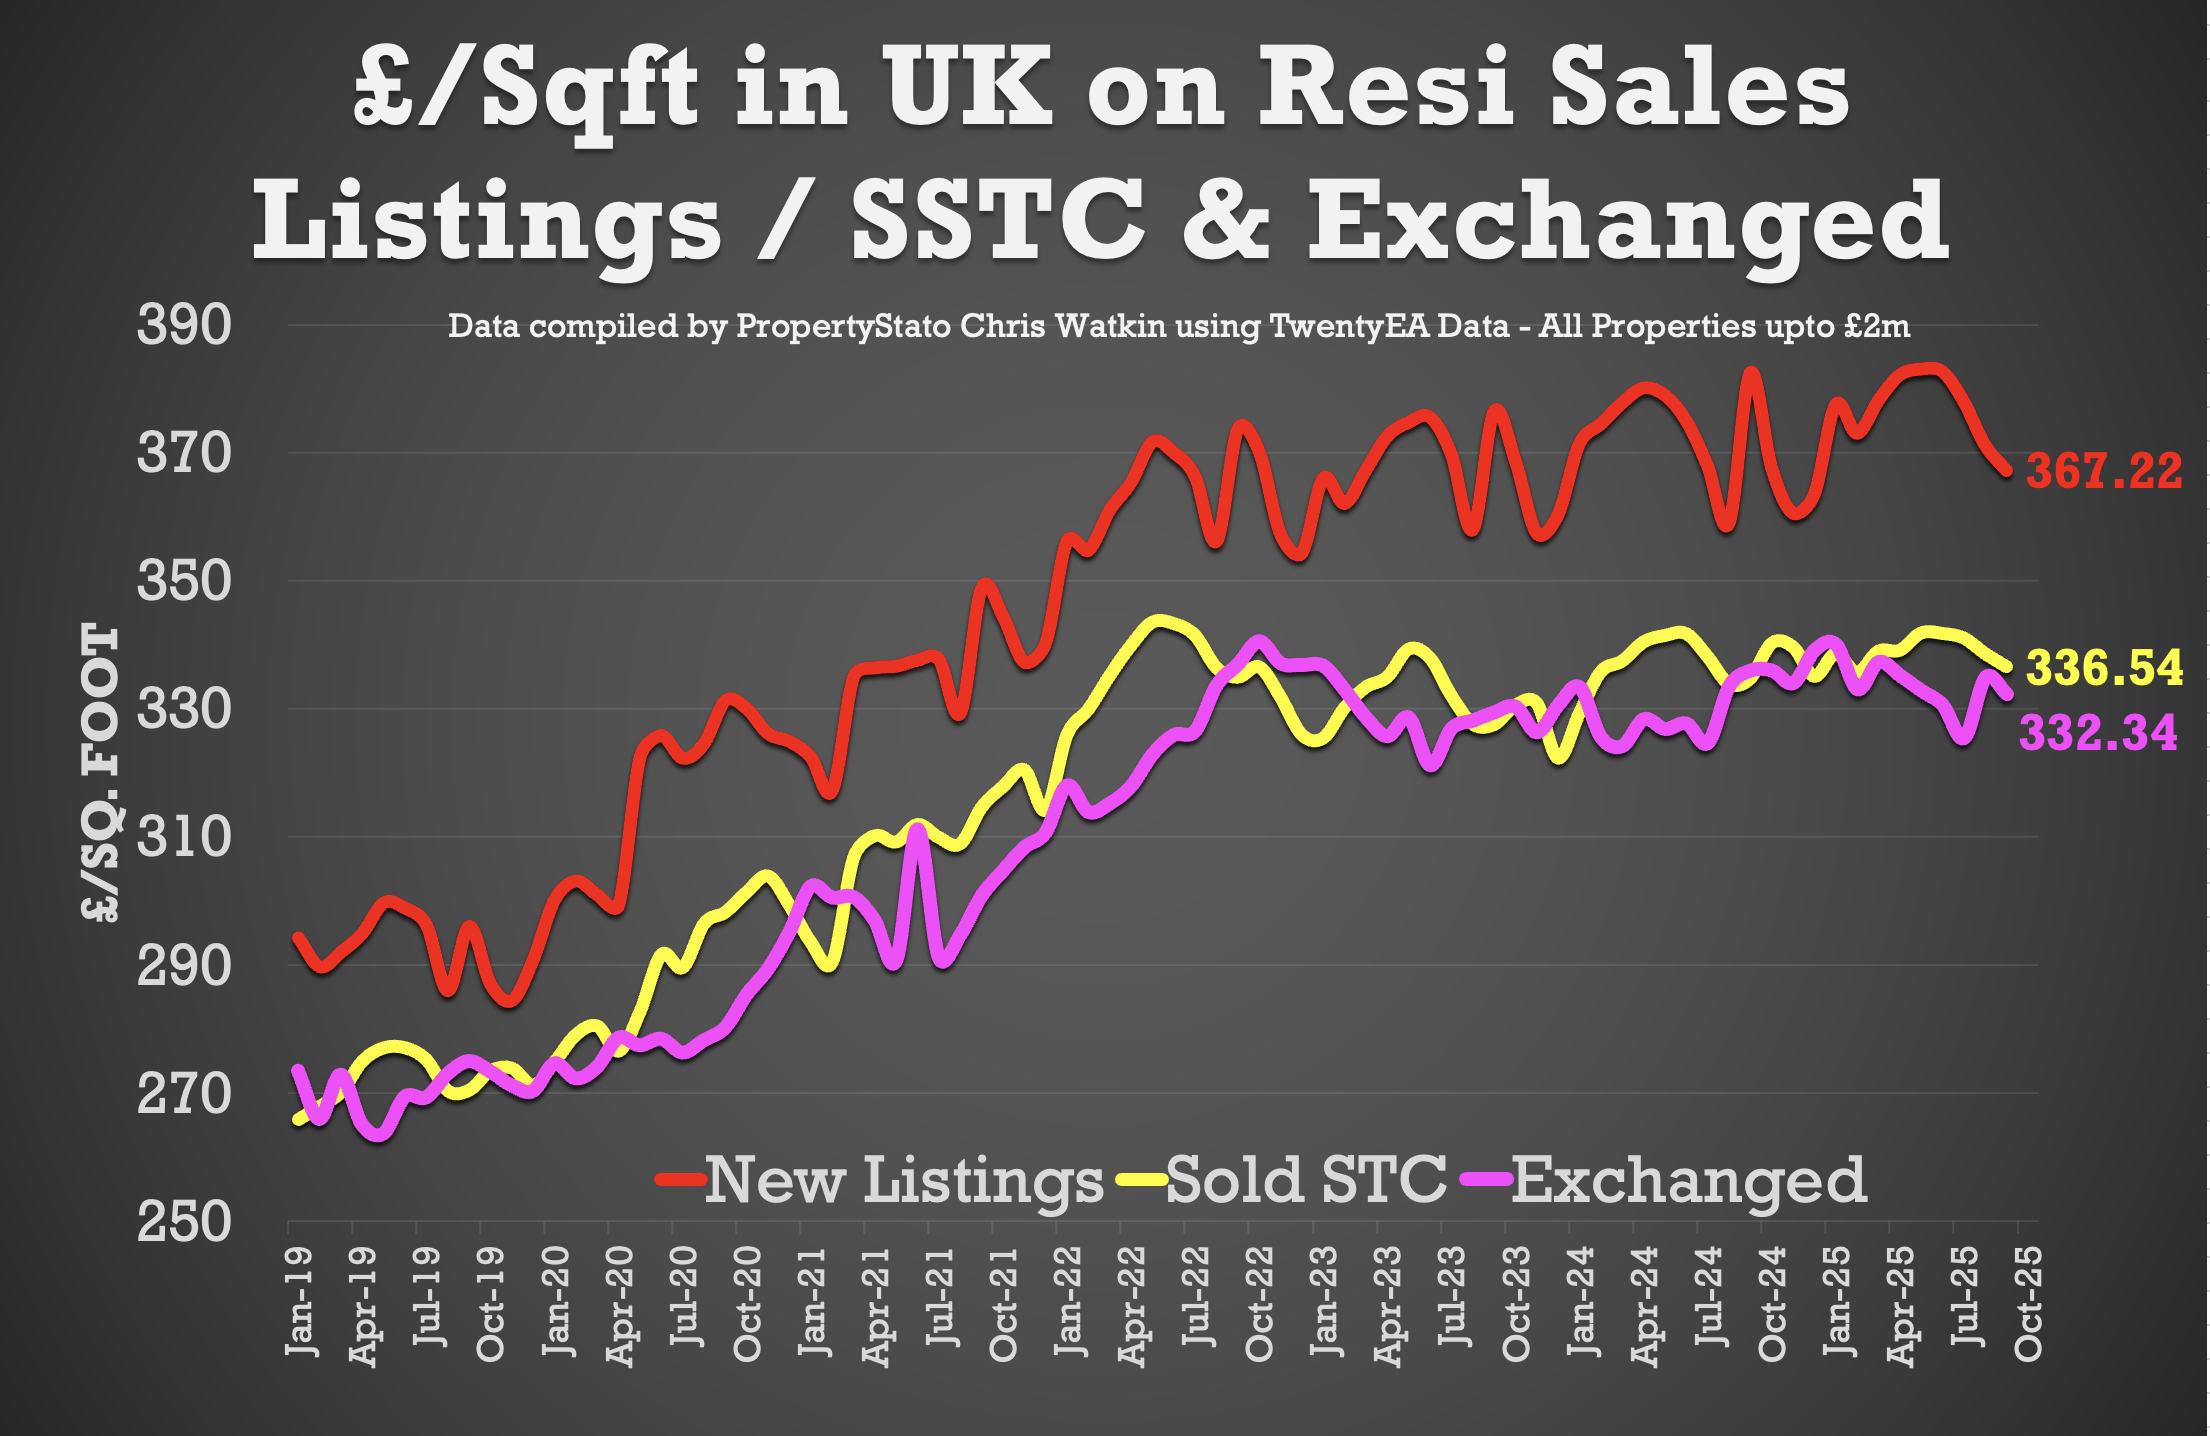
✅ House Prices (£/sq.ft)
+ September 2025 agreed sales averaged £336.54 per sq.ft.
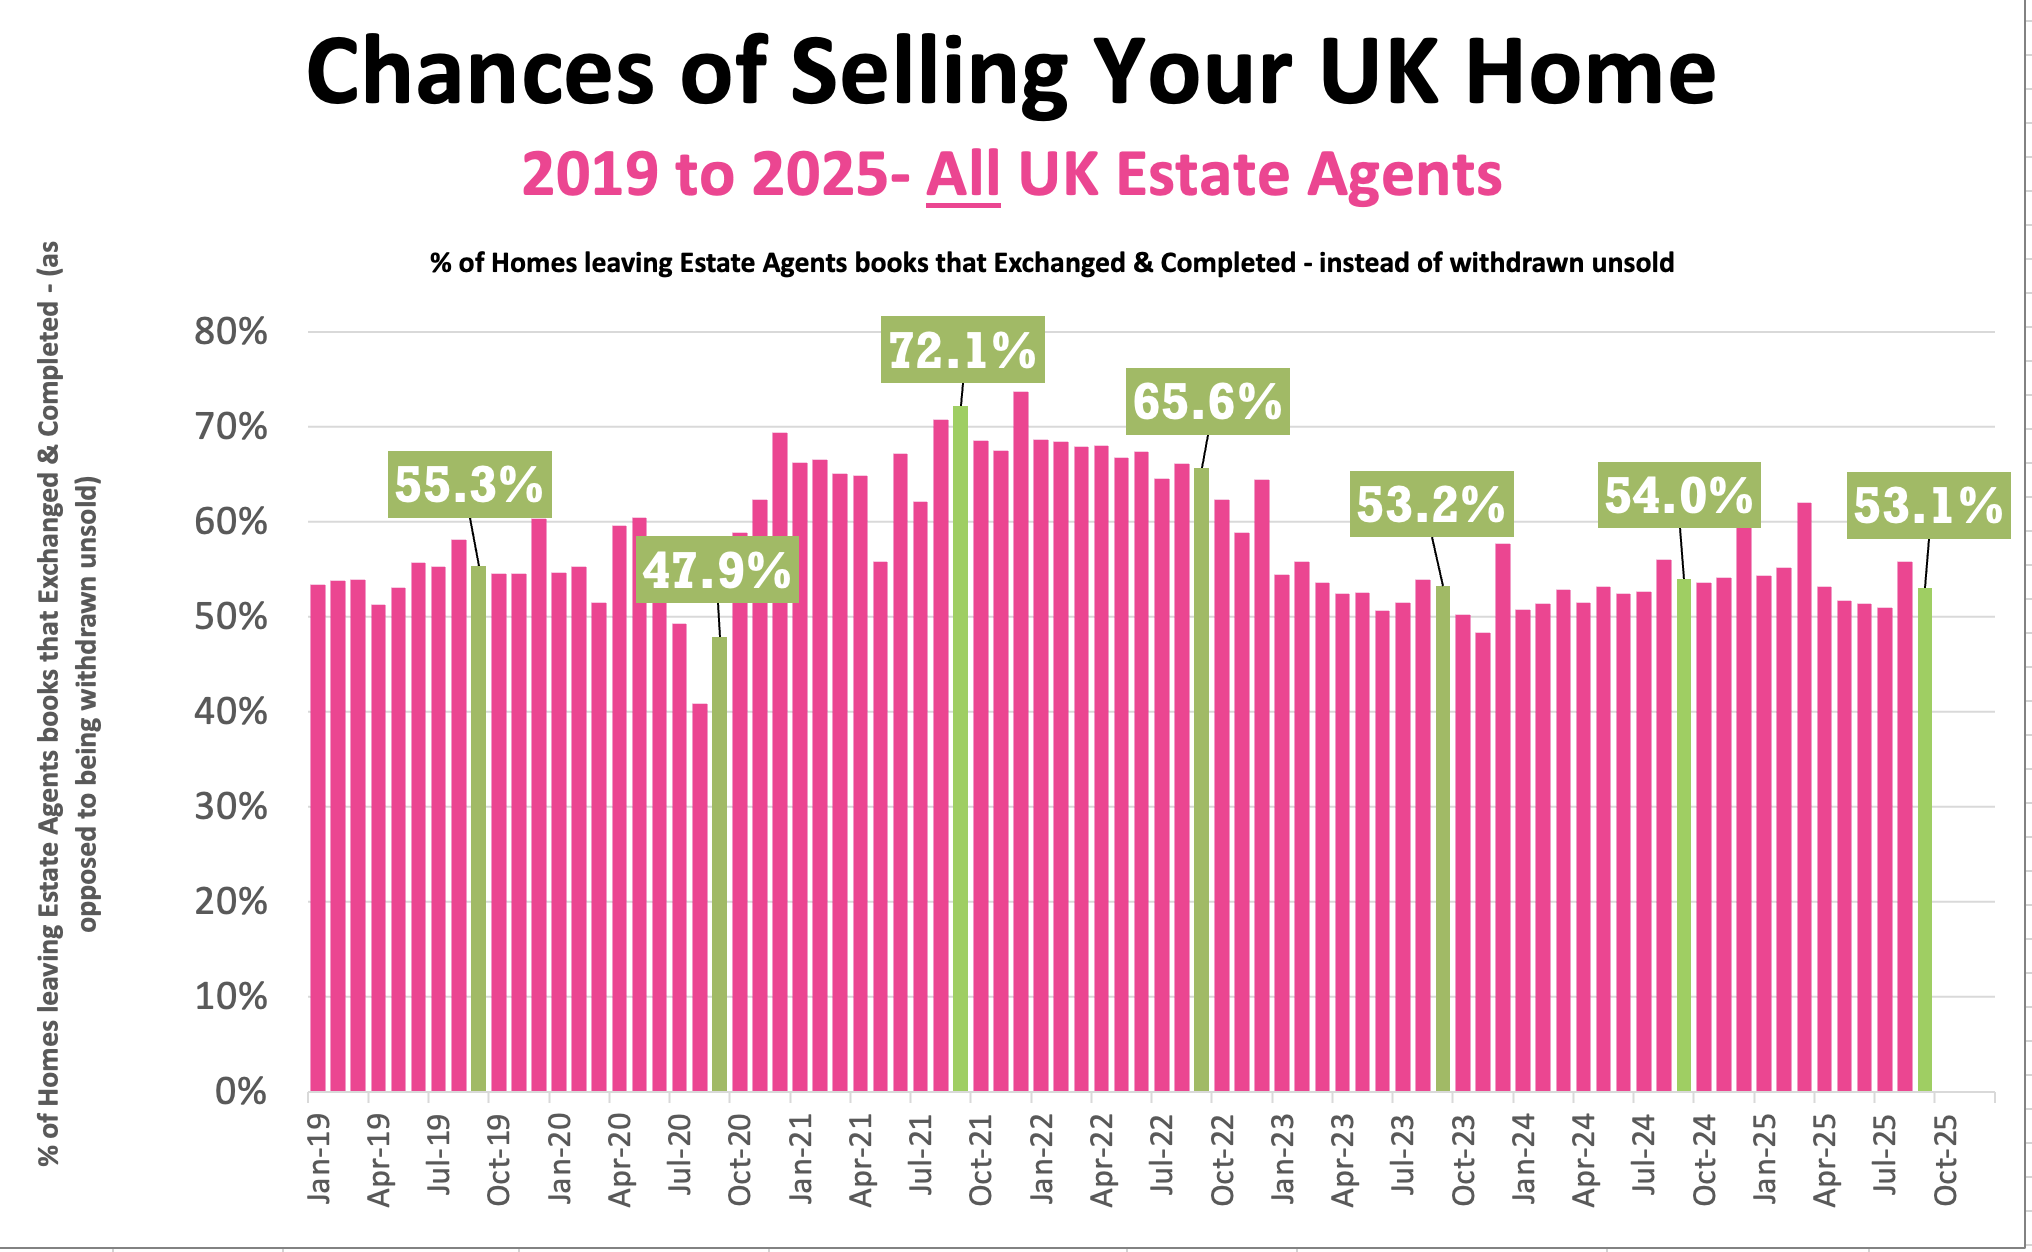
✅ Probability of Selling (% that Exchange vs withdrawal)
+ Final September Stats : 53.1% of homes that left agents’ books exchanged & completed in September.
+ August :55.8% / July: 50.9% / June: 51.3% / May: 51.7% / April: 53.2%.
Over the past two months, Inner London’s weekly home sales have hovered around 1,250 to 1,320, compared with 24,000 to 25,500 across the UK, giving London roughly 5% of total national transactions. London’s volumes have jumped up and down, from a 5.4% rise in one week to a 1.5 % fall the next, while the UK’s growth rate has moved more smoothly, between –3 and +2 %. That volatility hints at patchier confidence in the capital, where mortgage costs bite hardest.
On price, Inner London homes that sold, averaged between £750,000 and £820,000, roughly £400,000 higher than the UK average of £360,000–£370,000. Yet London’s price trend has been flatter, with weekly shifts from +3.5 to –5%, compared with steadier national changes of around –1 to +2%. This suggests that while London’s sales activity has started to improve, it is being driven mainly by lower value properties rather than the prime end of the market. The capital looks busier, but at a cheaper level of entry.
Inner London = N/NW/SE/E/SW/W/WC/EC
Read the orginal article: https://propertyindustryeye.com/what-is-currently-happening-in-the-uk-property-market-71/


