
 Welcome to the 40th UK property market stats show of 2025, your weekly TV programme on the UK housing market.
This week, I’m joined by Iain White, ex-Romans boss and estate Agency coach and thought leader, as we unpack the key headlines from the week ending Sunday 12th October 2025.
🔍 Key Market Headlines – Week 40, 2025
✅ New Listings
- 32.7k new properties came to market this week, down as expected from 34.3k last week.
- 2025 weekly average: 36.1k.
- Nine year week 40 average :33.4k
- Year-to-date (YTD): 1.44m new listings, 2.2% higher than 2024 YTD (1.41m) and 10% above the 2017–19 average (1.31m).
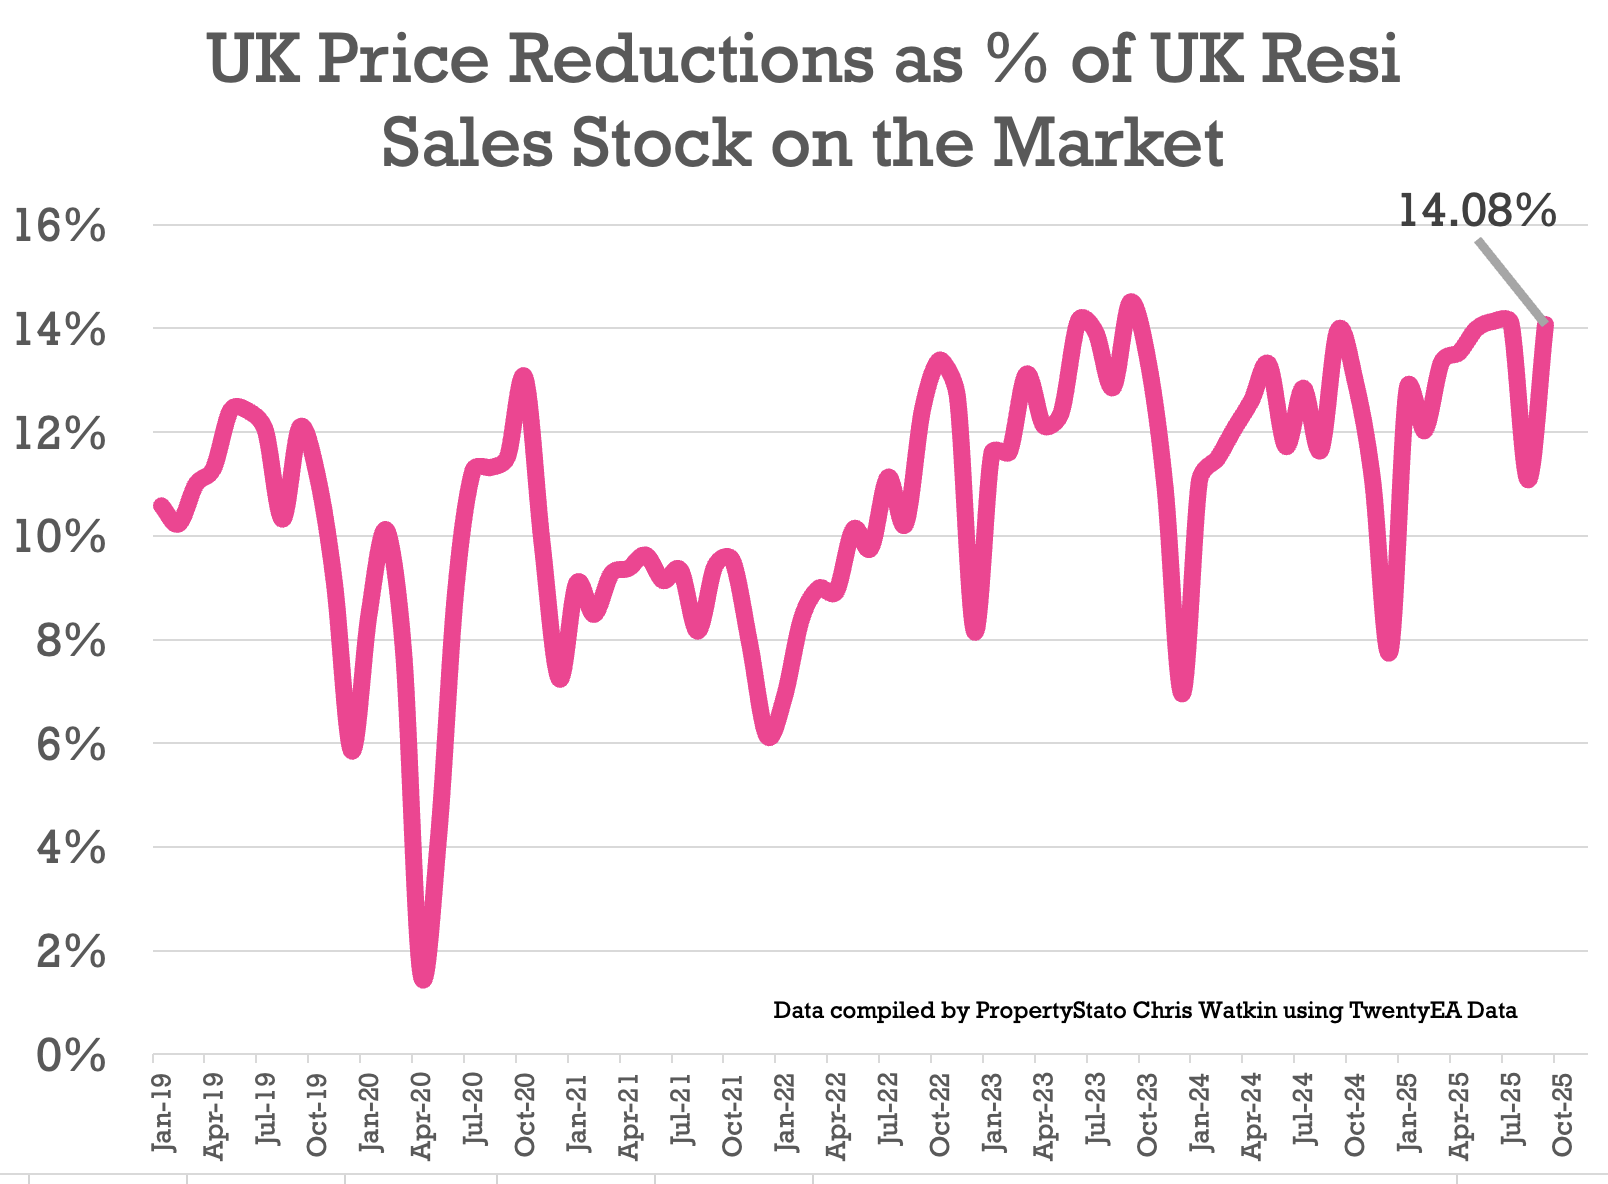
✅ Price Reductions
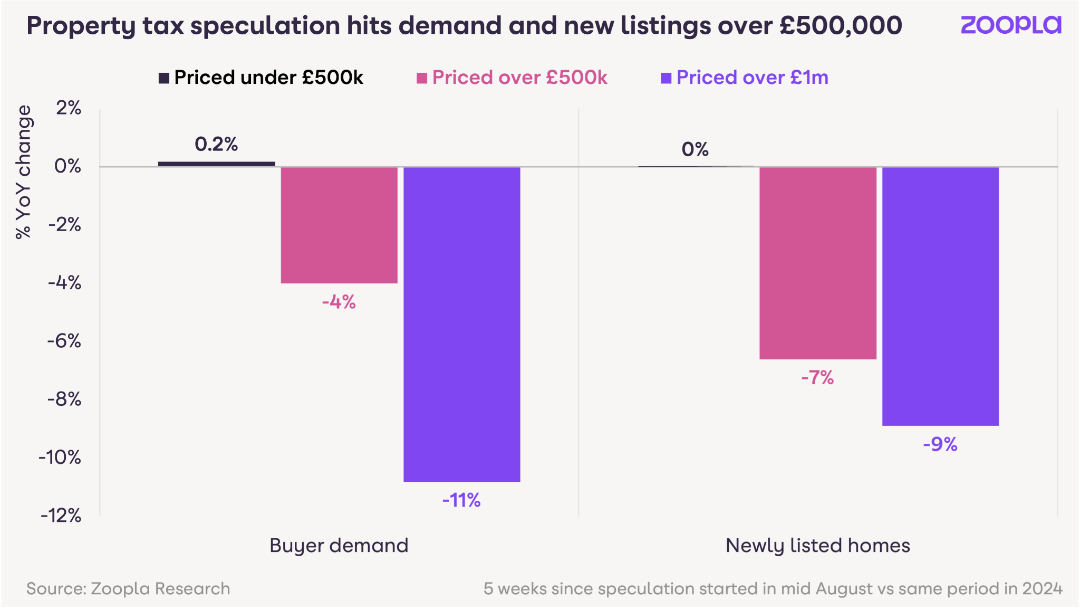
- 24.6k reductions this week, slightly higher to last week at 25.6k.
- Increase in the number of homes on the market being reduced in September to 14.1%. In August, it was 11.1% (everyone must have been on holiday!), whilst it was 14.1% in July and 14% in June.
- 2025 average so far: 13.2%, versus the five-year long-term average of 10.74%.
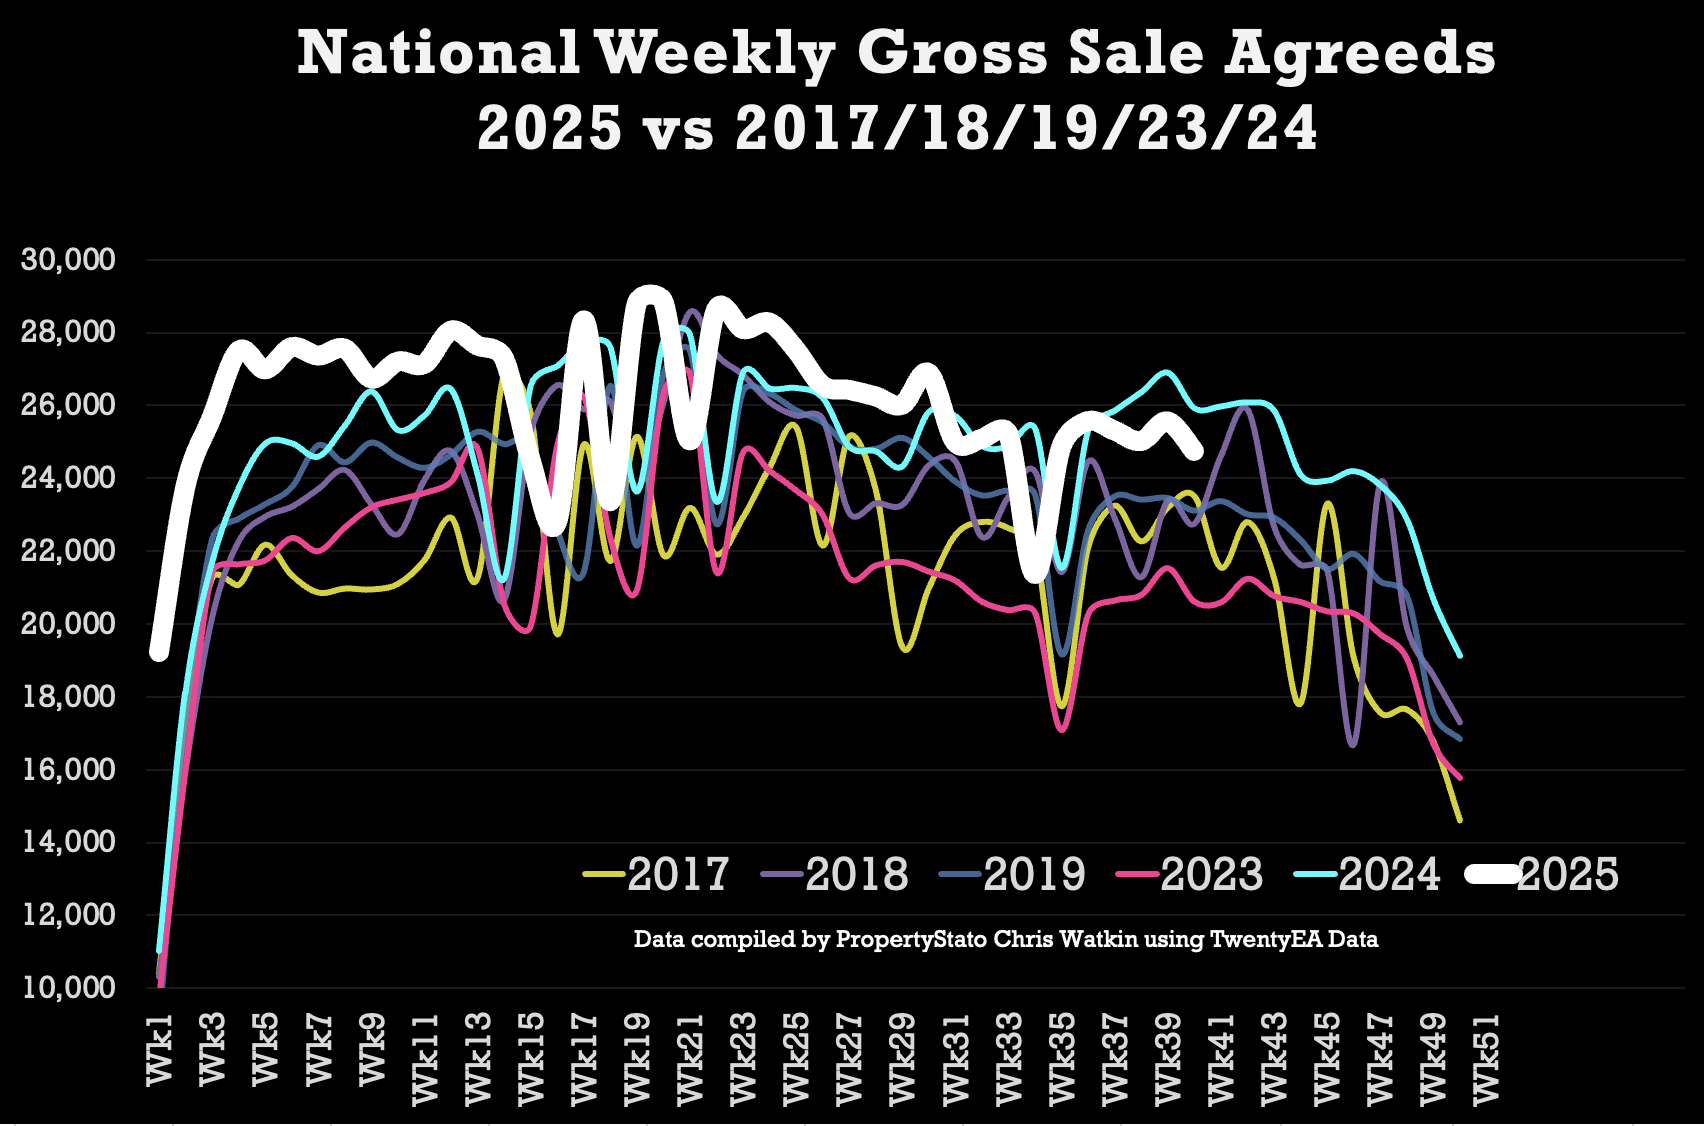
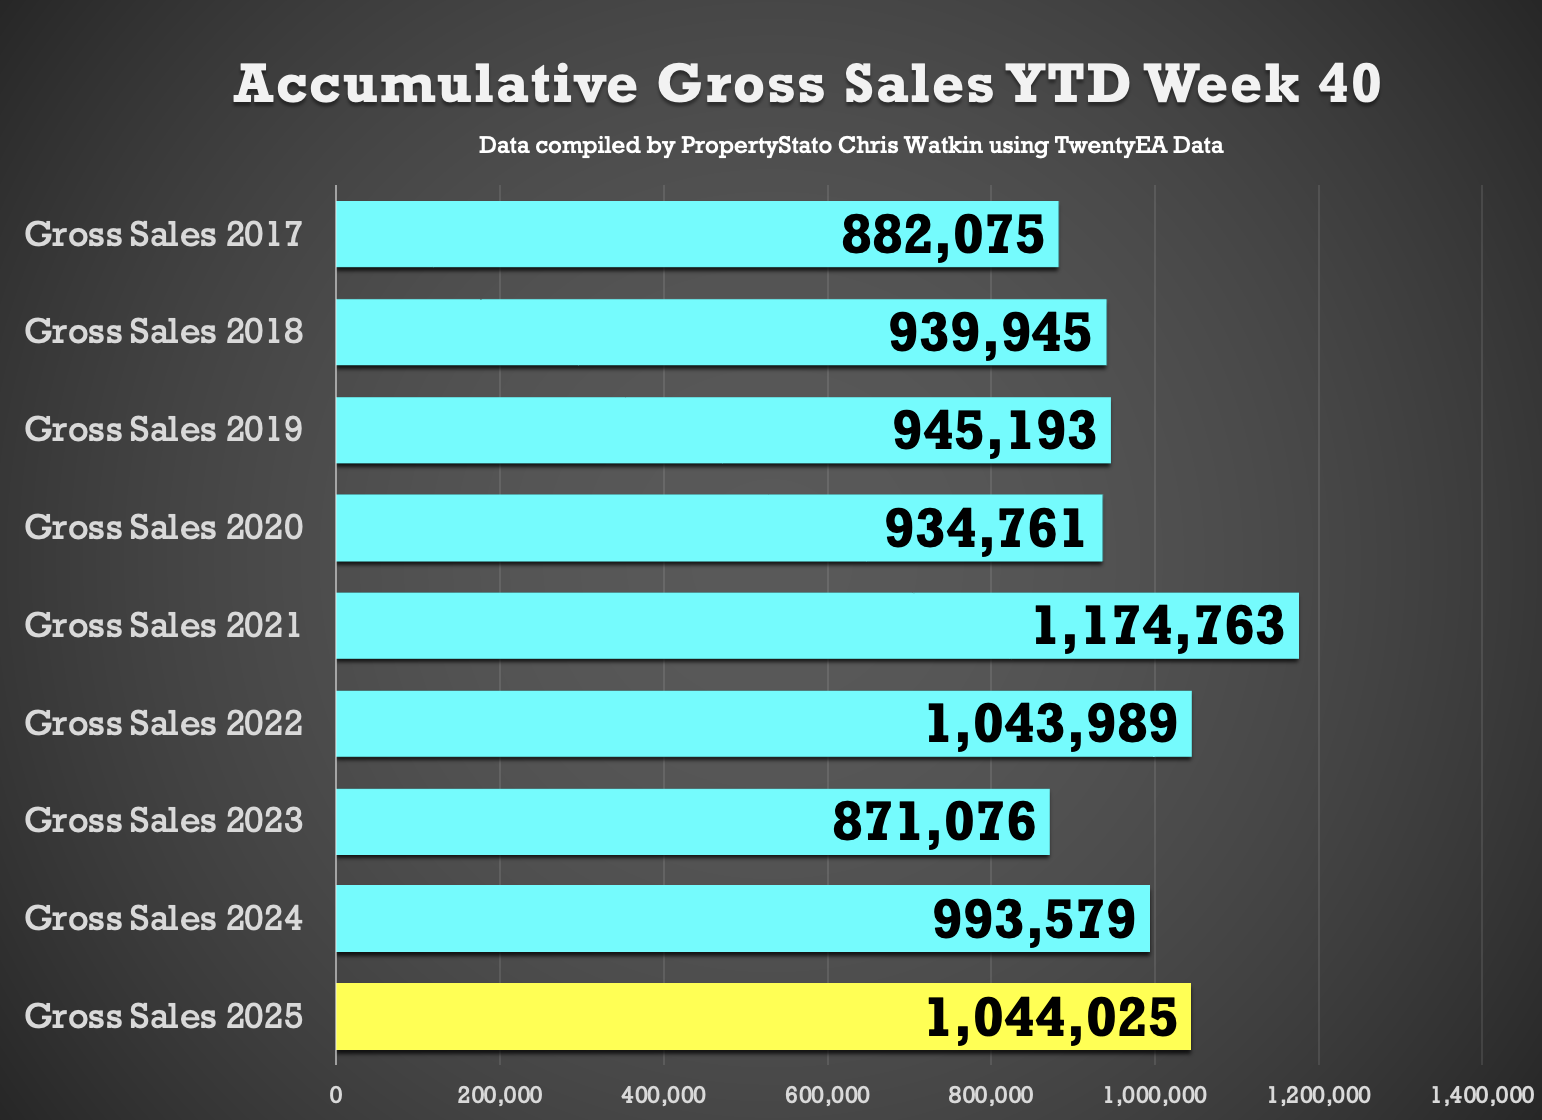
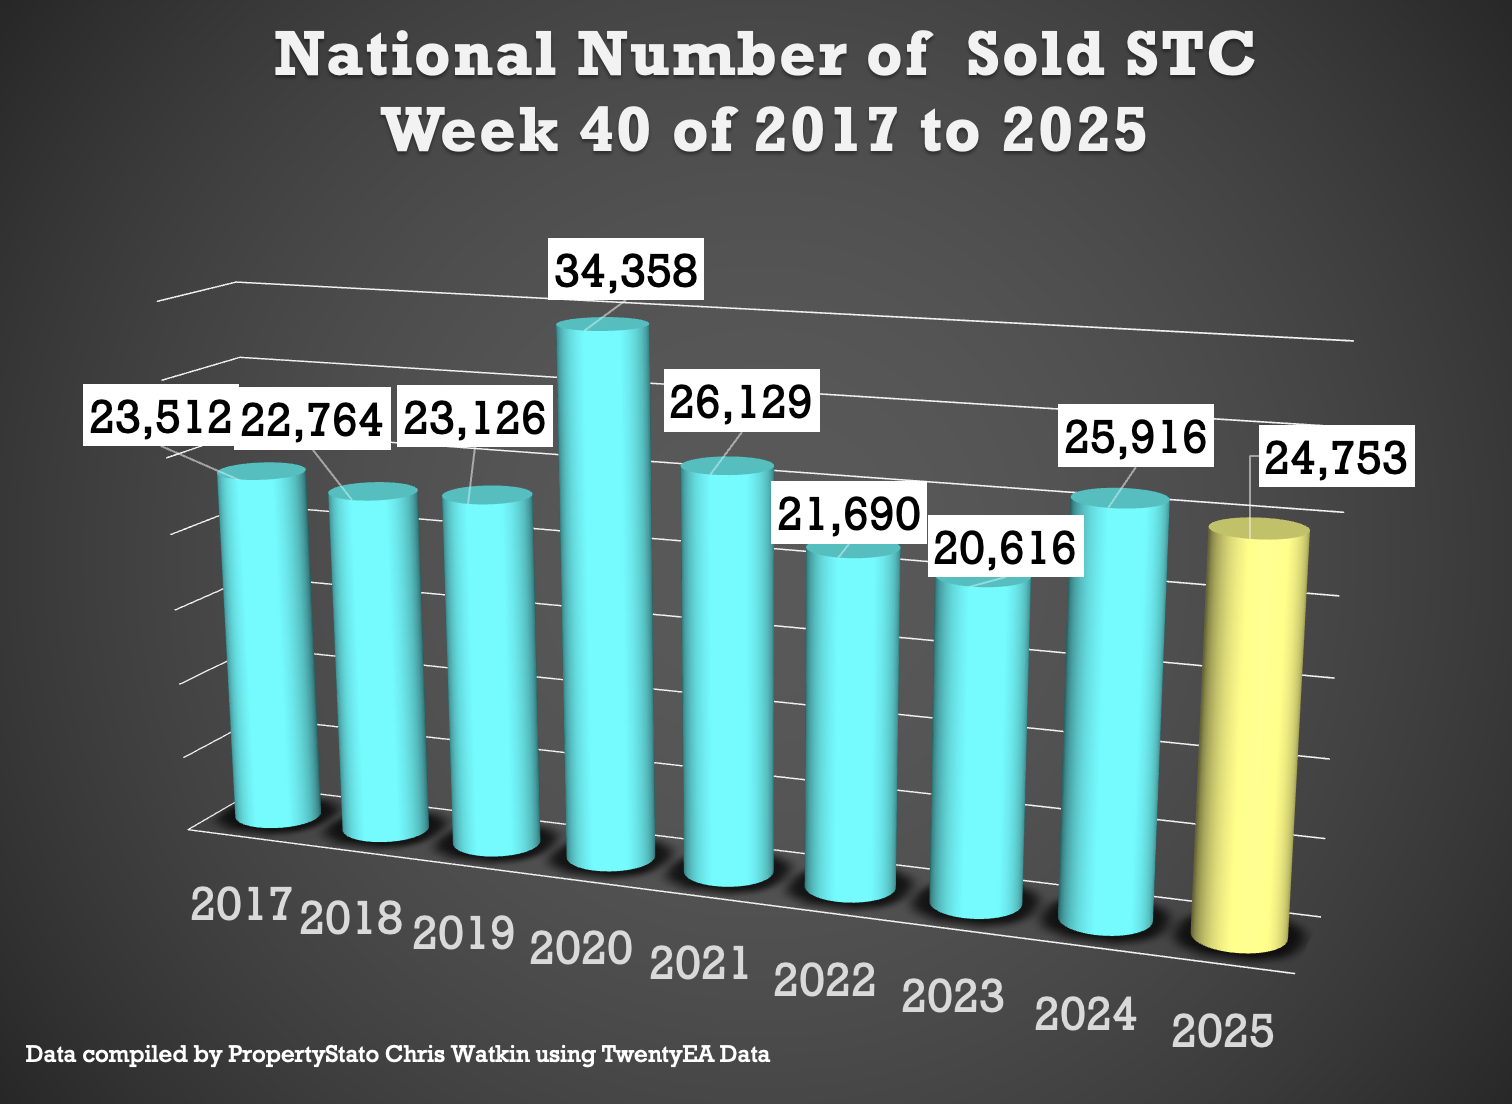
✅ Sales Agreed
- 24.8k homes sold subject to contract this week, down as expected from 25.6k last week.
- Week 40 average (for last 9 years) :24.8k
- 2025 weekly average : 26.1k.
- YTD: 1.044m gross sales, which is 5.1% ahead of 2024 (994k) and 13.2% above the 2017–19 average (922k).
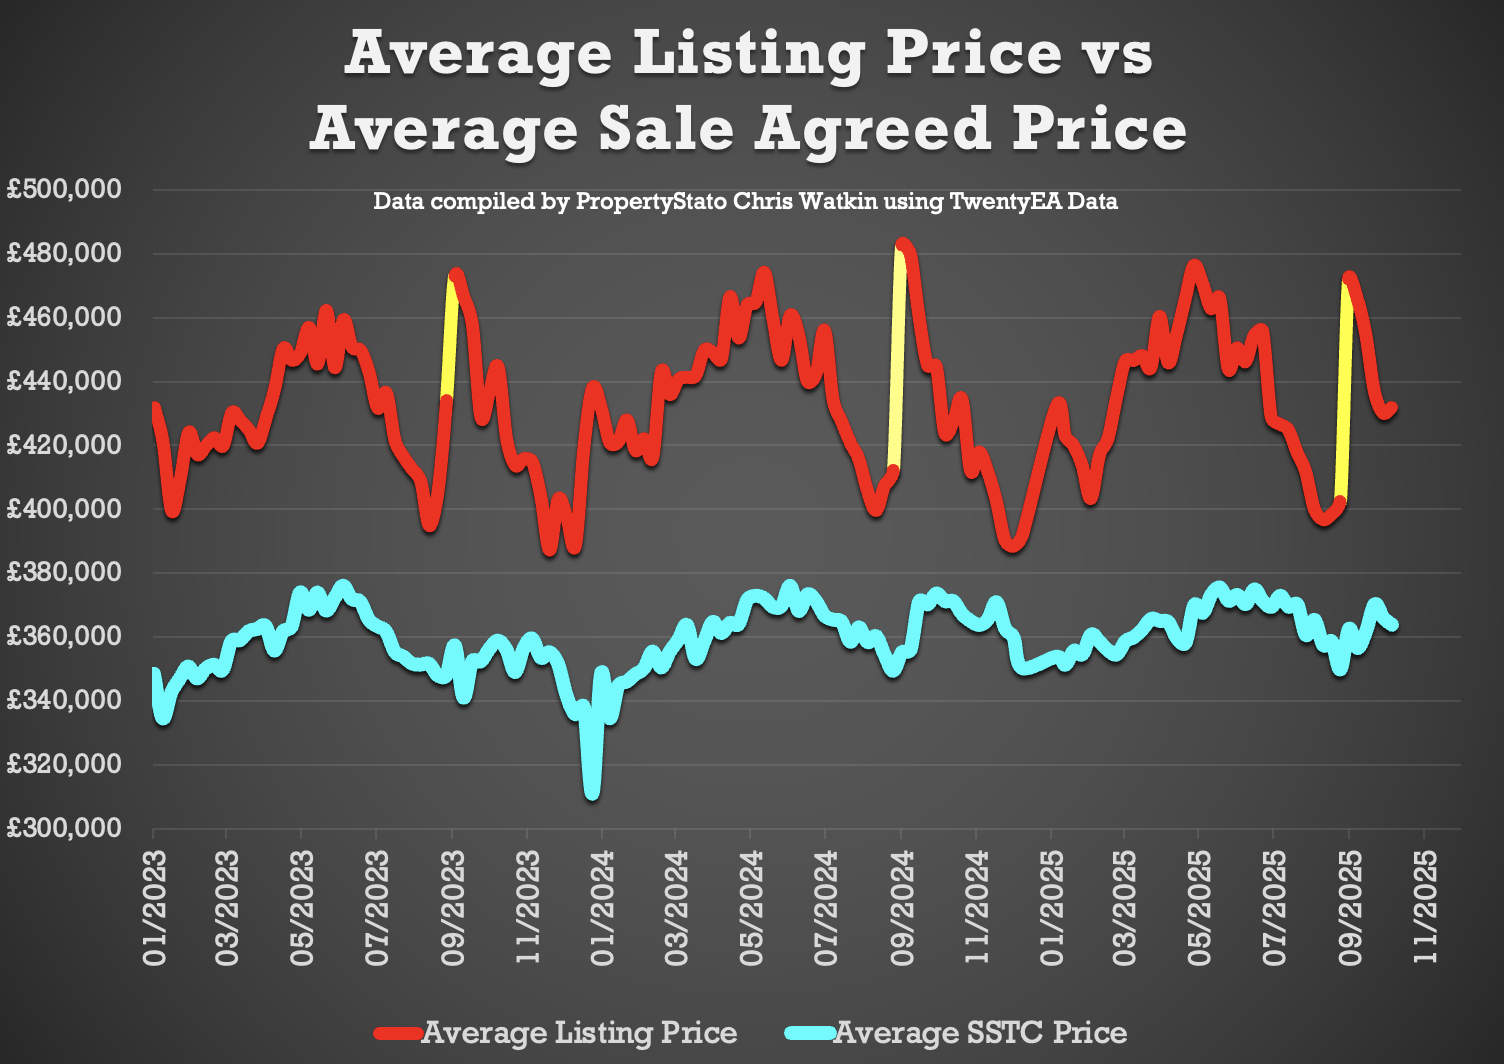
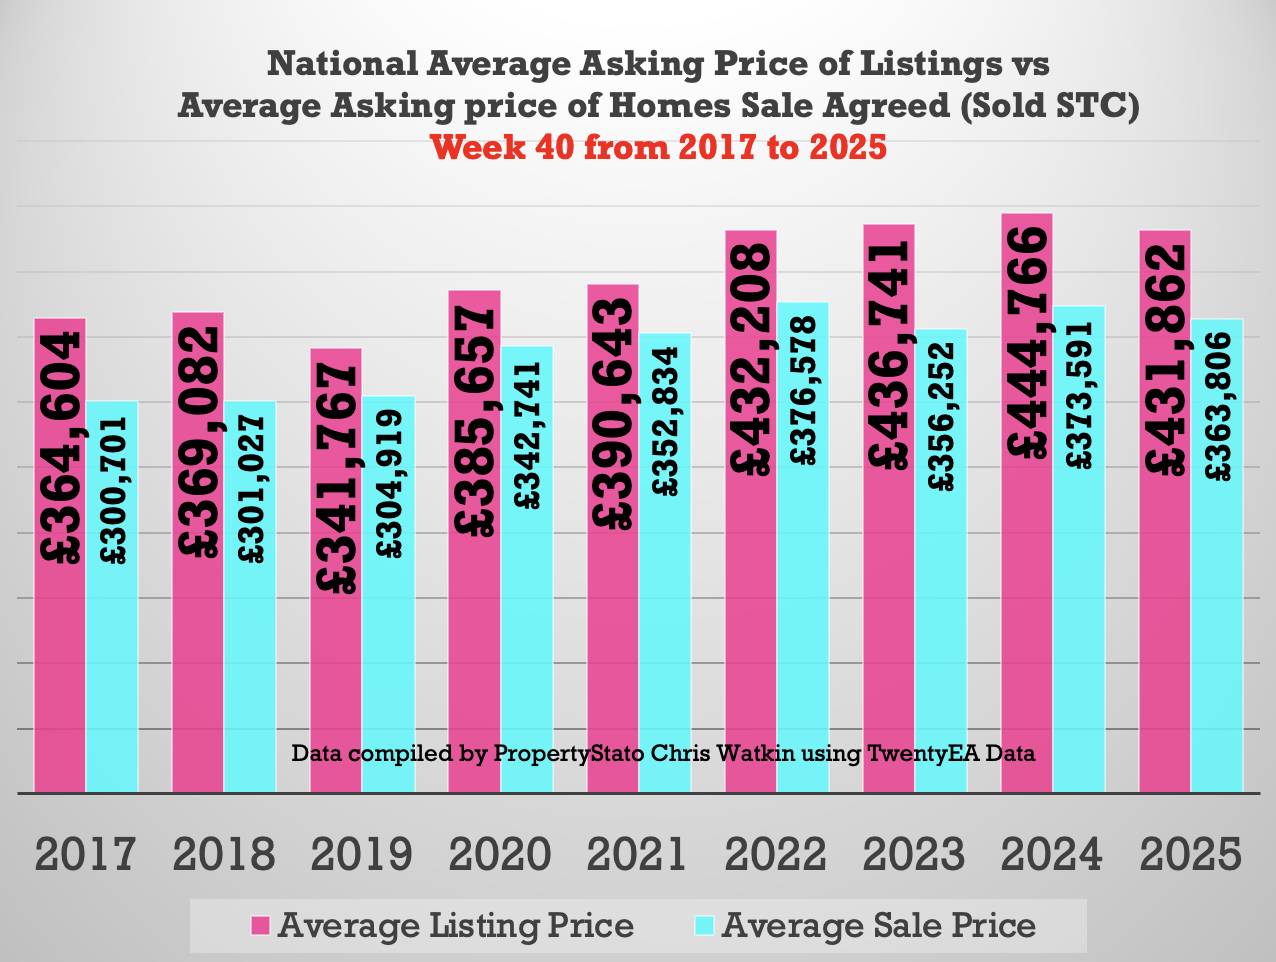
✅ Price Diff between Listings & Sales
- Average Asking Price of listings last week £432k vs Average asking price of Sales Agreed (SSTC) – £364k
- 18.7% difference (long term 9 year average is 16% to 17%).
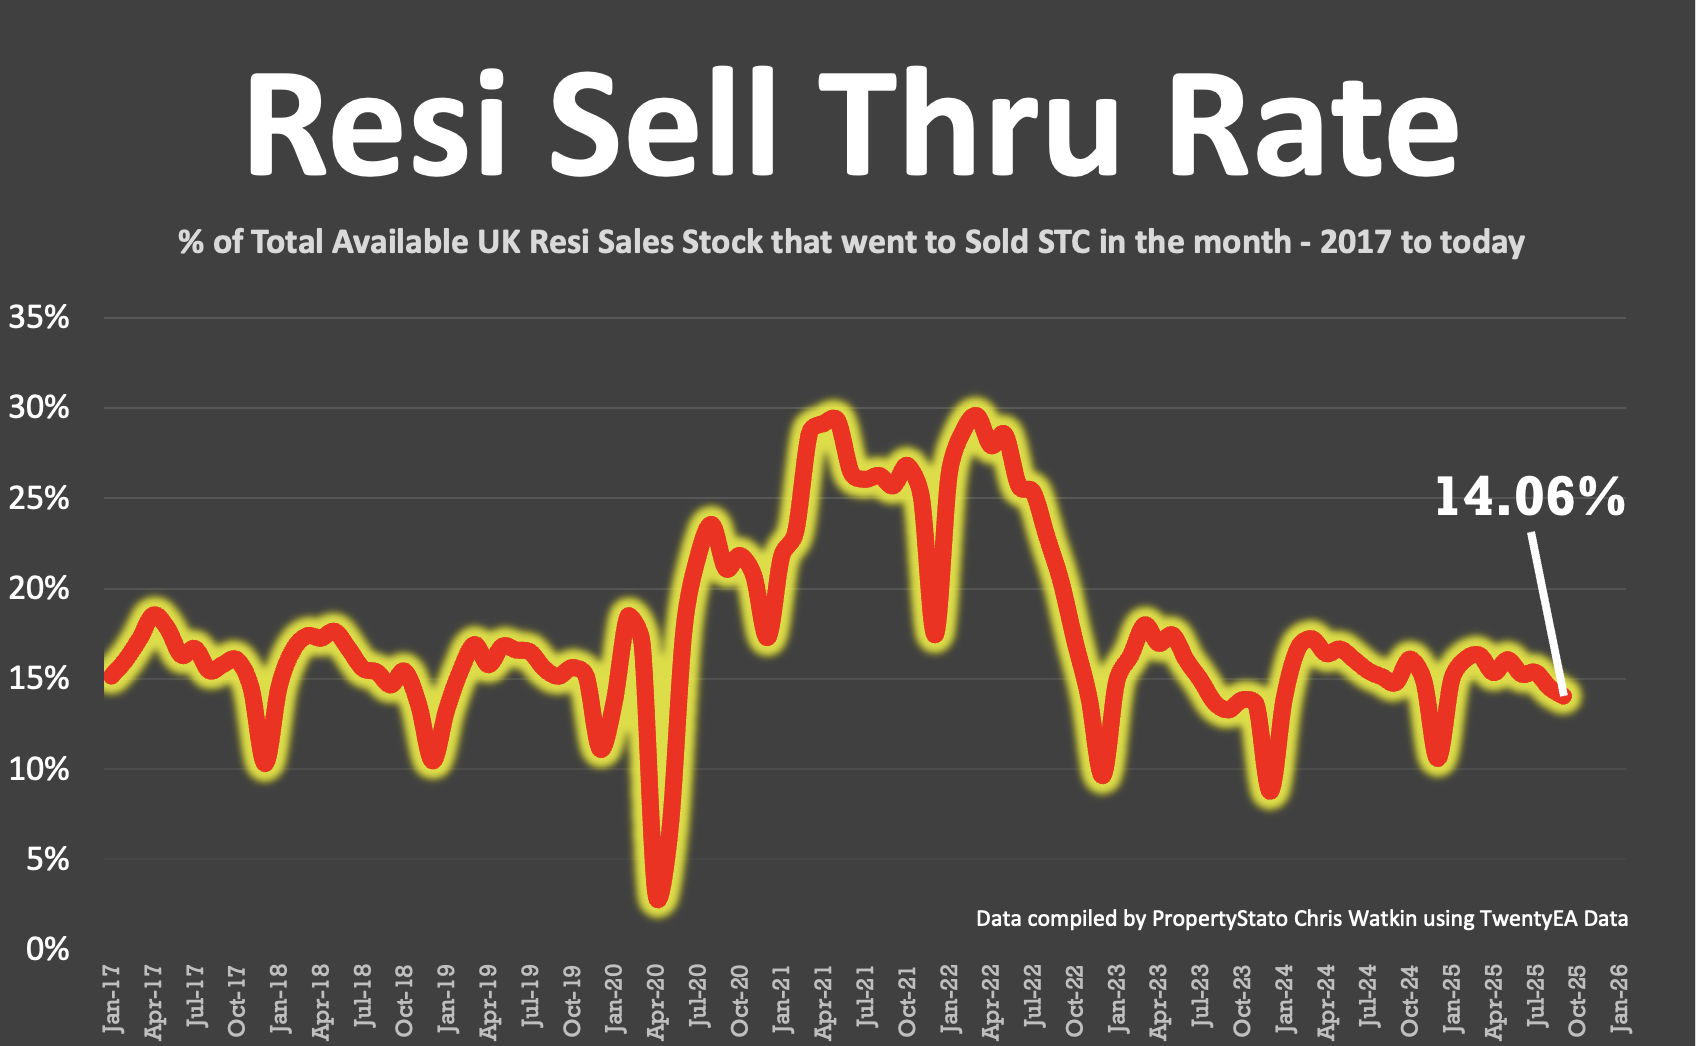
✅ Sell-Through Rate
- 14.1% of homes on agents’ books went SSTC in September.
- Down from 14.5% in Aug, 15.4% in July, 15.3% in June, and 16.1% in May.
- Pre-Covid average: 15.5%.
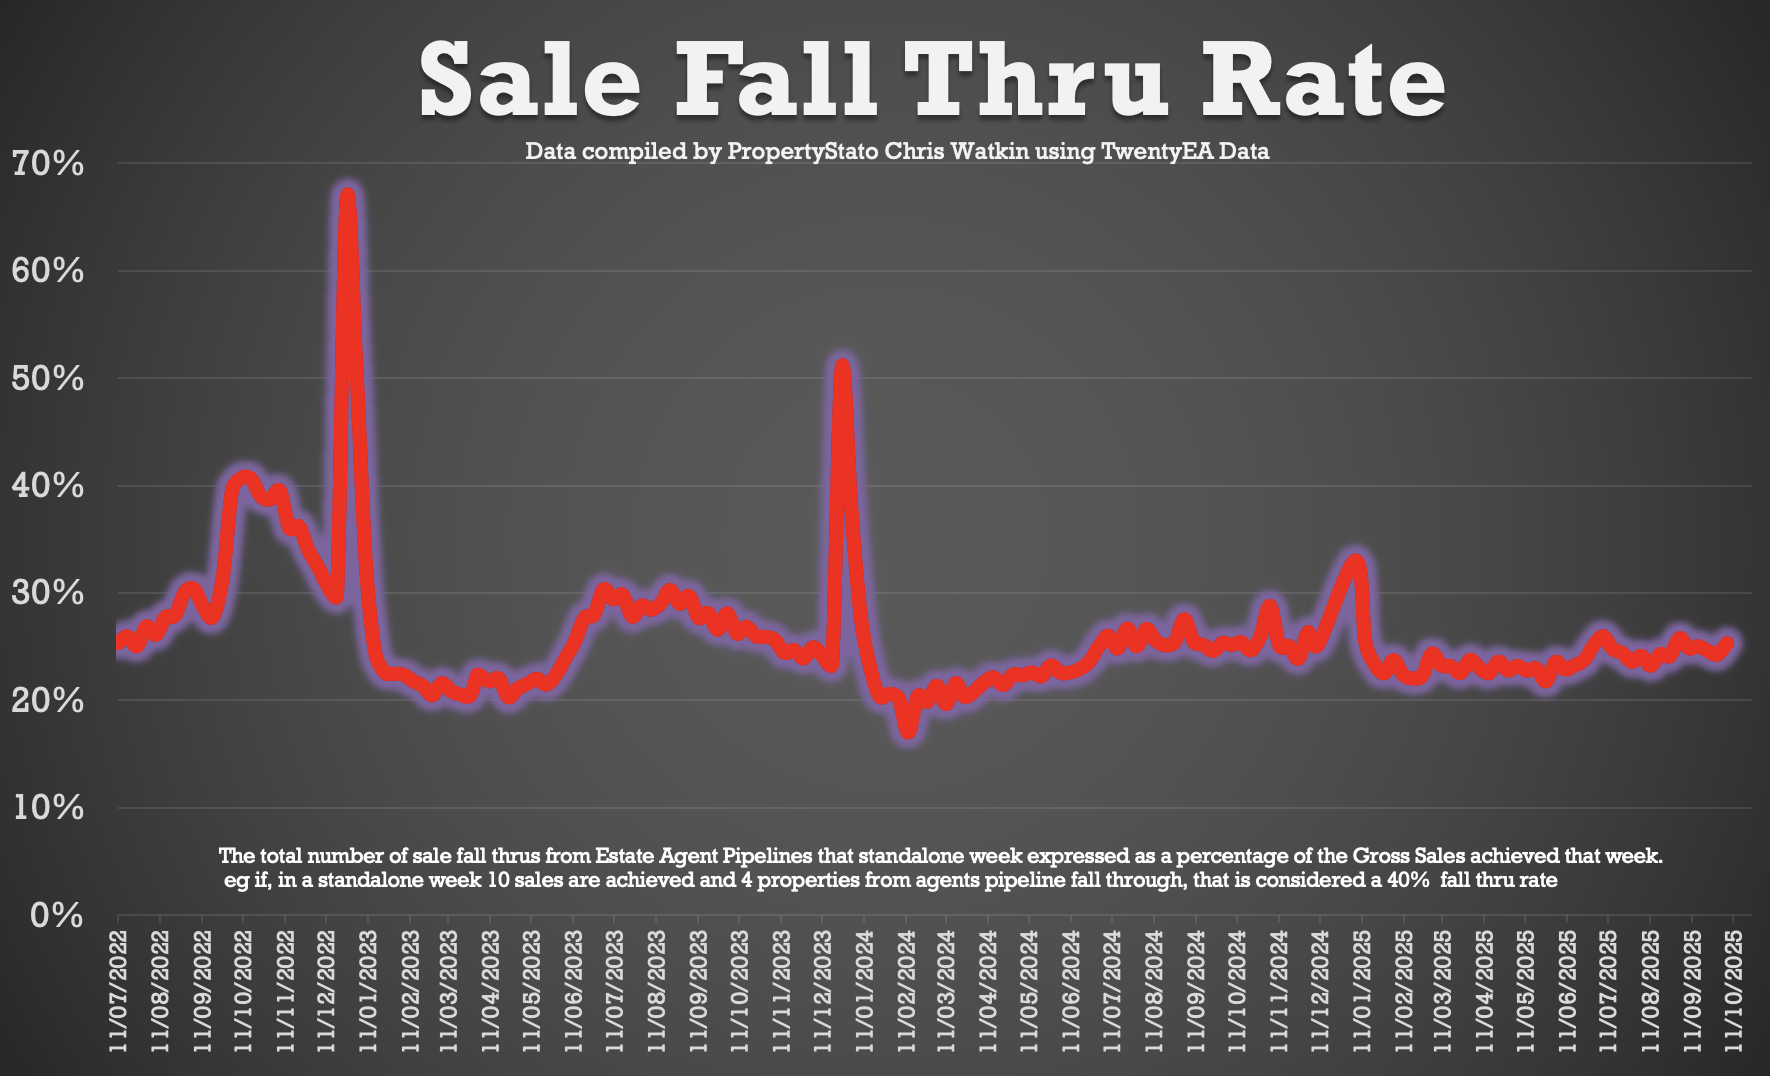
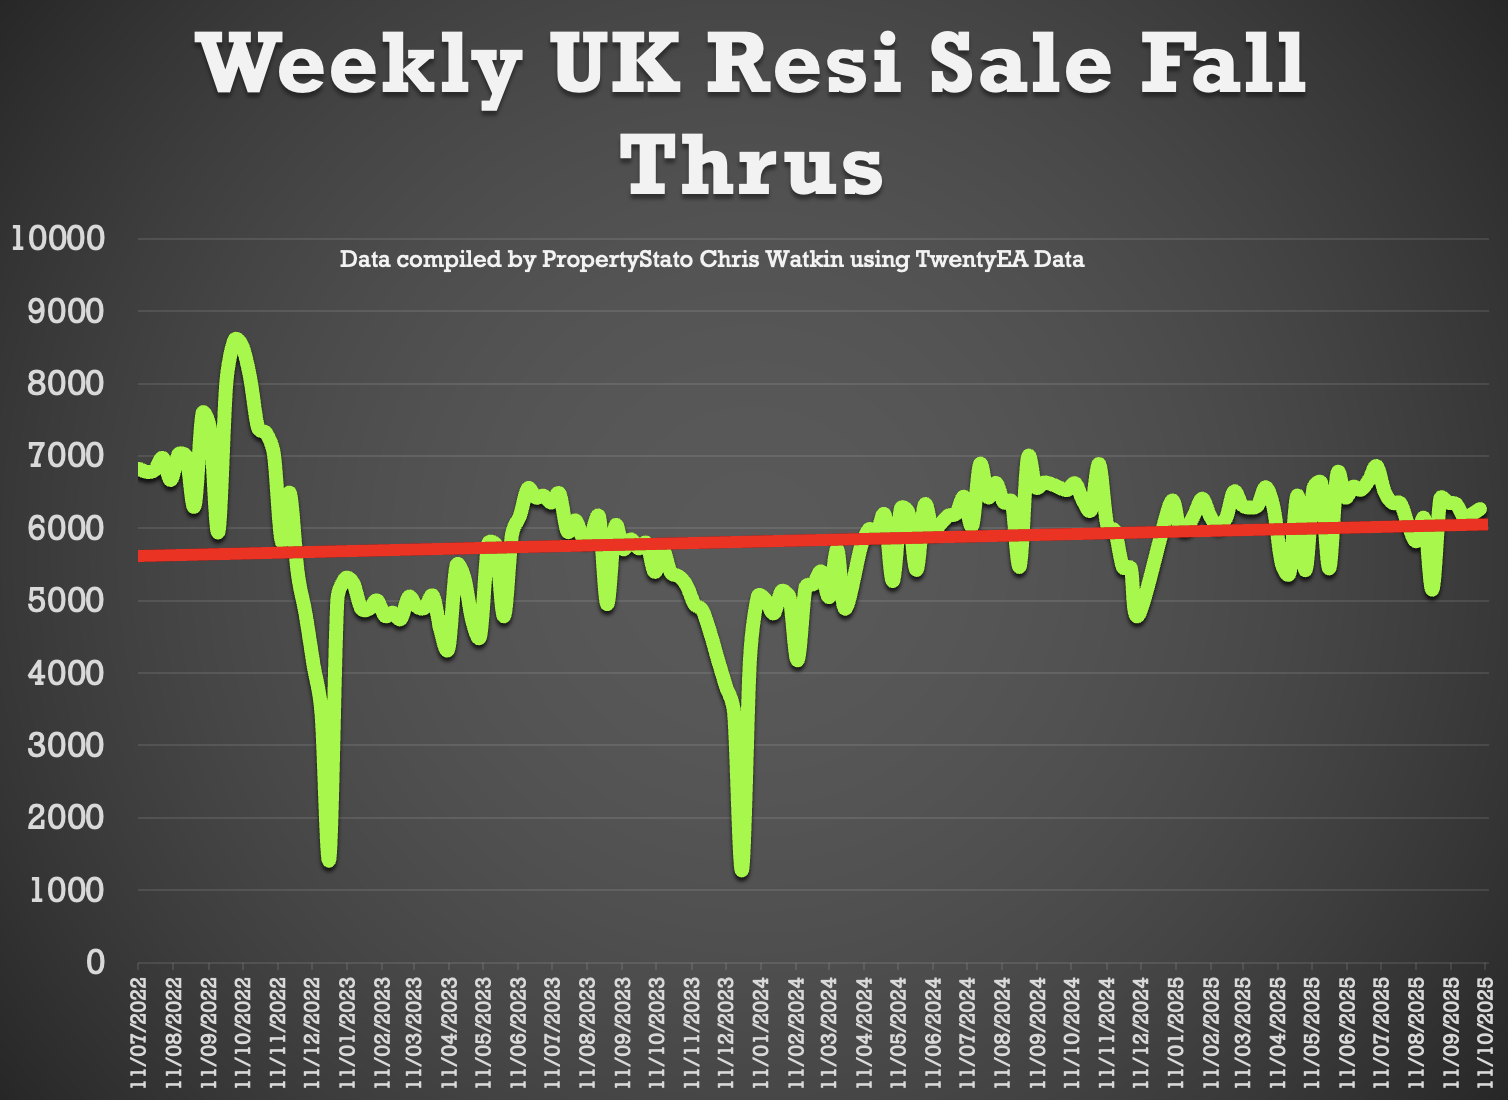
✅ Fall-Throughs
- 6,262 fall-throughs last week (pipeline of 510k home Sold STC).
- Weekly average for 2025: 6,562.
- Fall-through rate: 25.3%, up from 24.6% last week.
- Long-term average: 24.2% (post-Truss chaos saw levels exceed 40%).
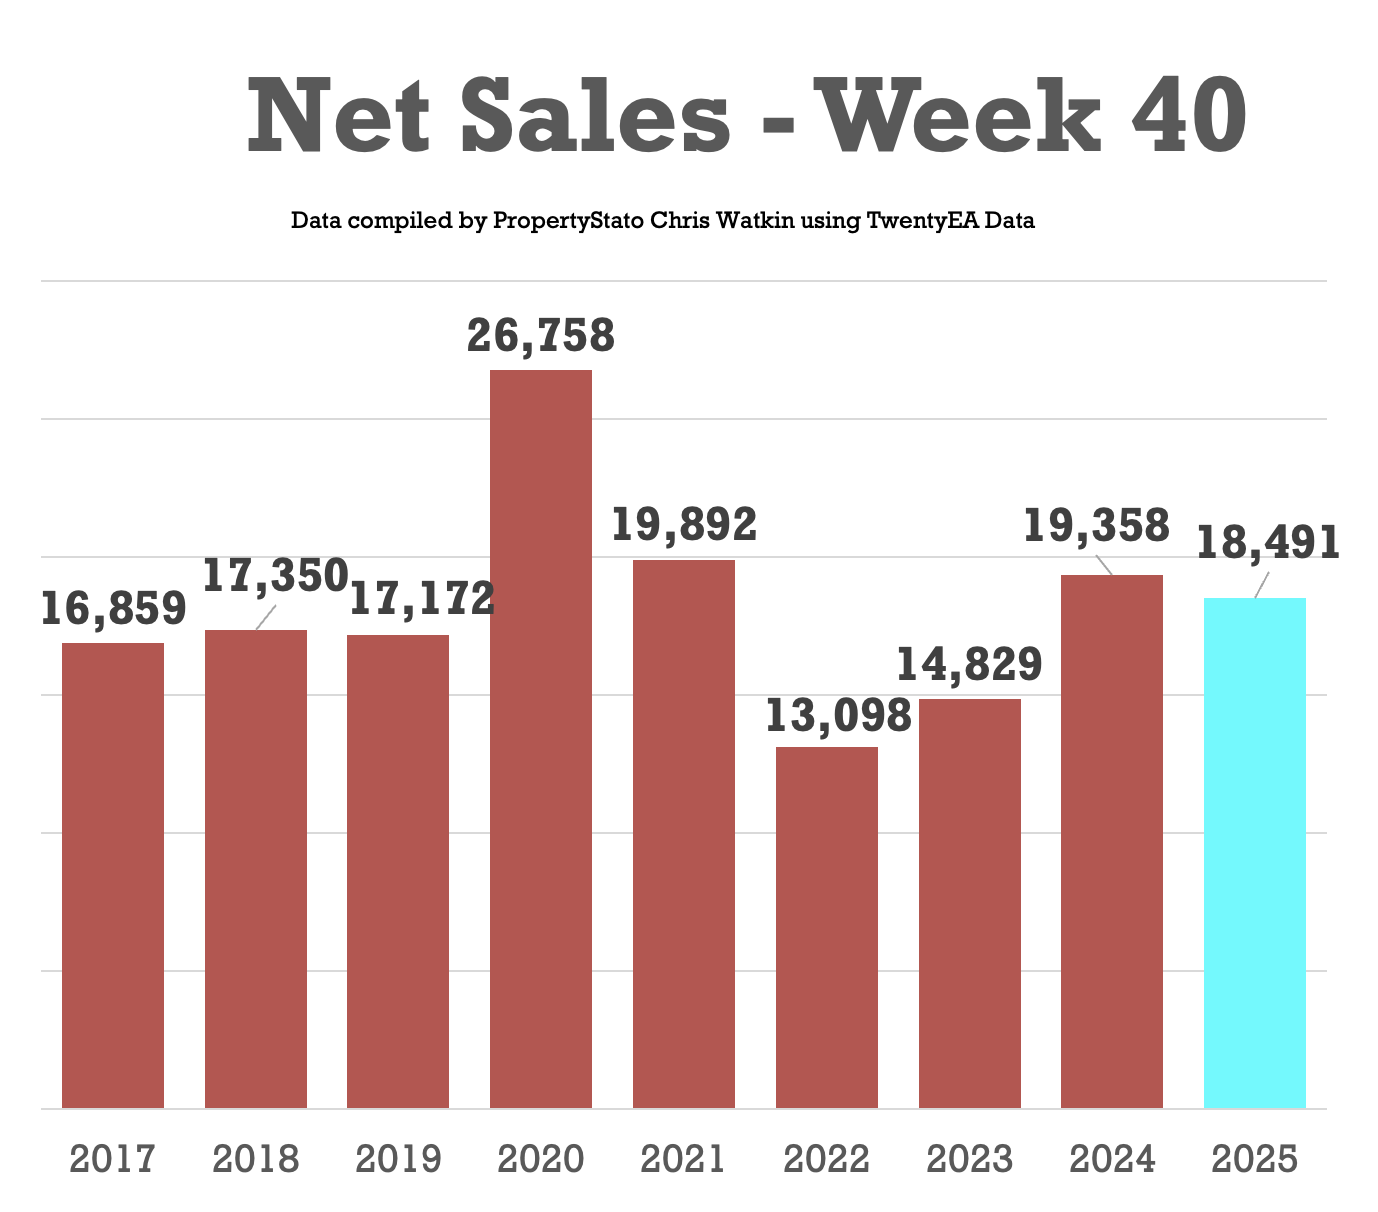
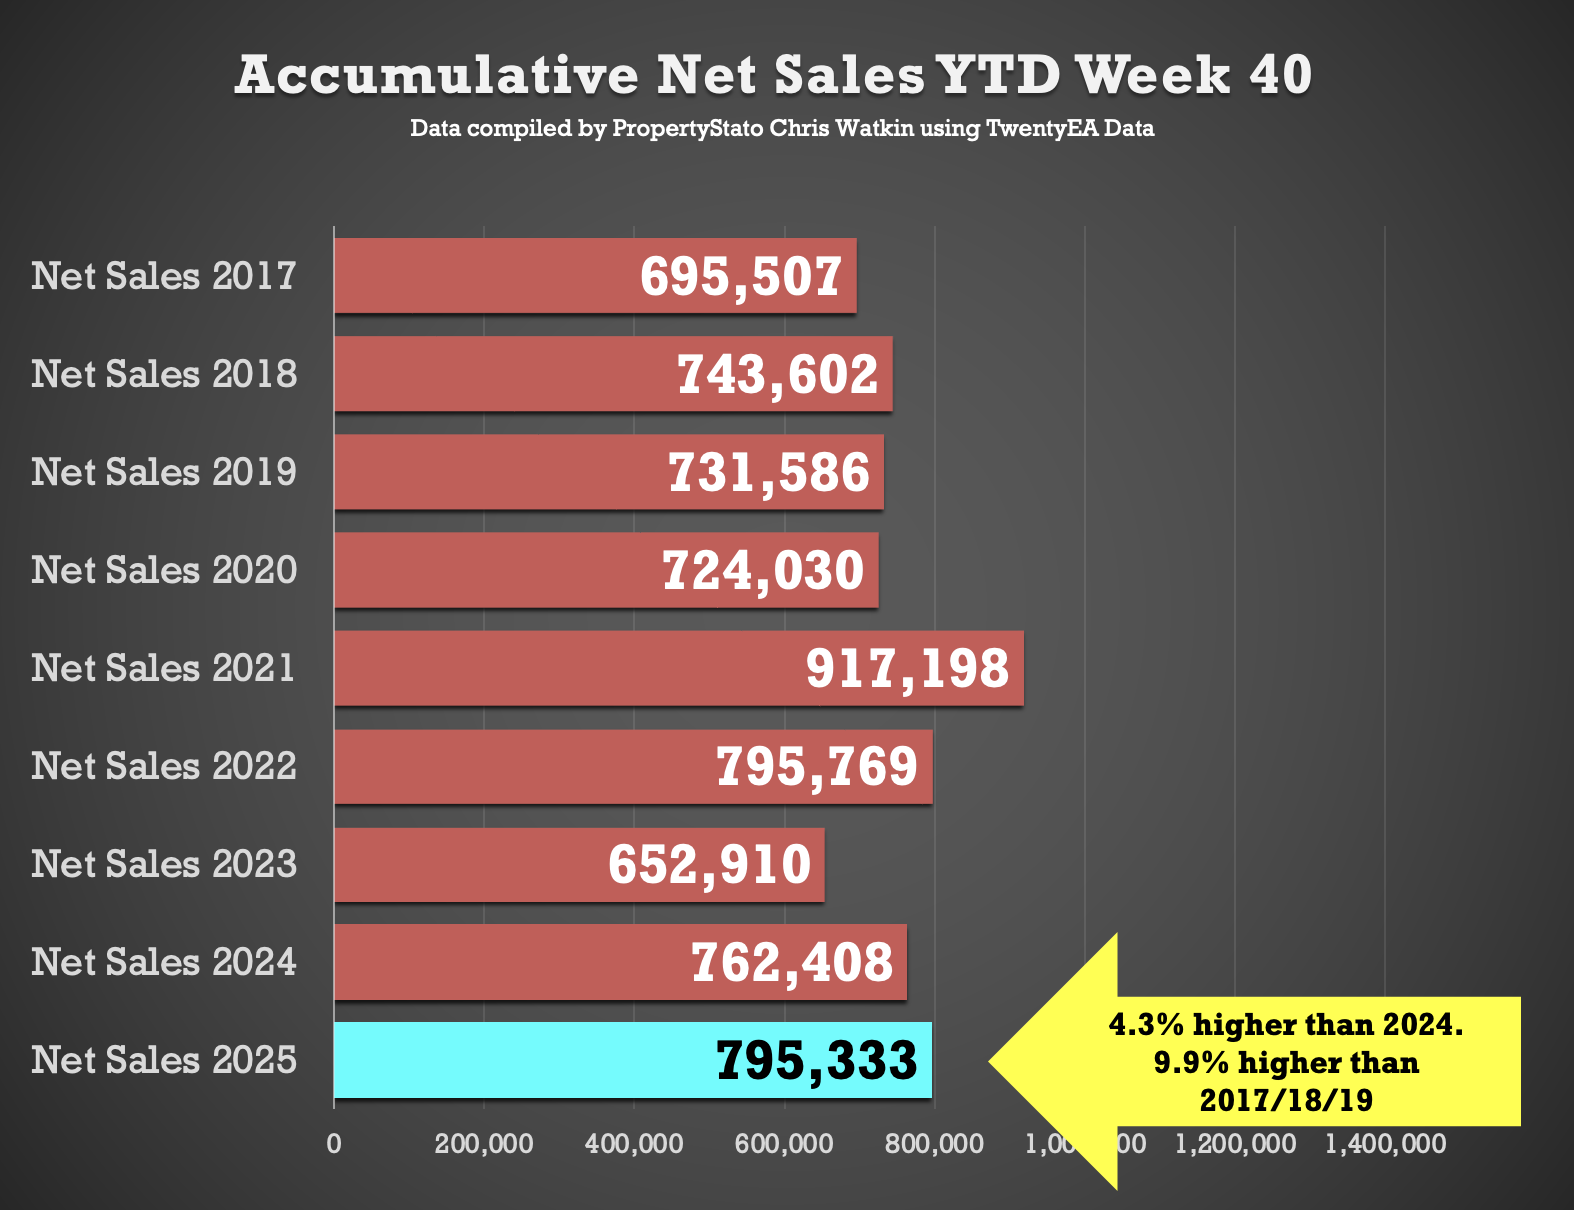
✅ Net Sales
- 18.5k net sales this week, up from 19.4k last week.
- Nine-year Week 40 average: 18.2k.
- Weekly average for 2025: 19.9k.
- YTD: 795k, which is 4.3% ahead of 2024 (762k) and 10% above 2017–19 (724k).
✅ Probability of Selling (% that Exchange vs withdrawal)
- Preliminary September Stats : 52.7% of homes that left agents’ books exchanged & completed. (Note this will change as more September stats come in in throughout October)
- August :55.8% / July: 50.9% / June: 51.3% / May: 51.7% / April: 53.2%.

✅ Stock Levels
- 751k homes on the market at the start of October, 4% higher than October 2024. (723k)
- 510k homes in sales pipeline on the 1st October, 2% higher than 12 months ago.
✅ House Prices (£/sq.ft)
- October 2025 agreed sales averaged £336.54 per sq.ft.
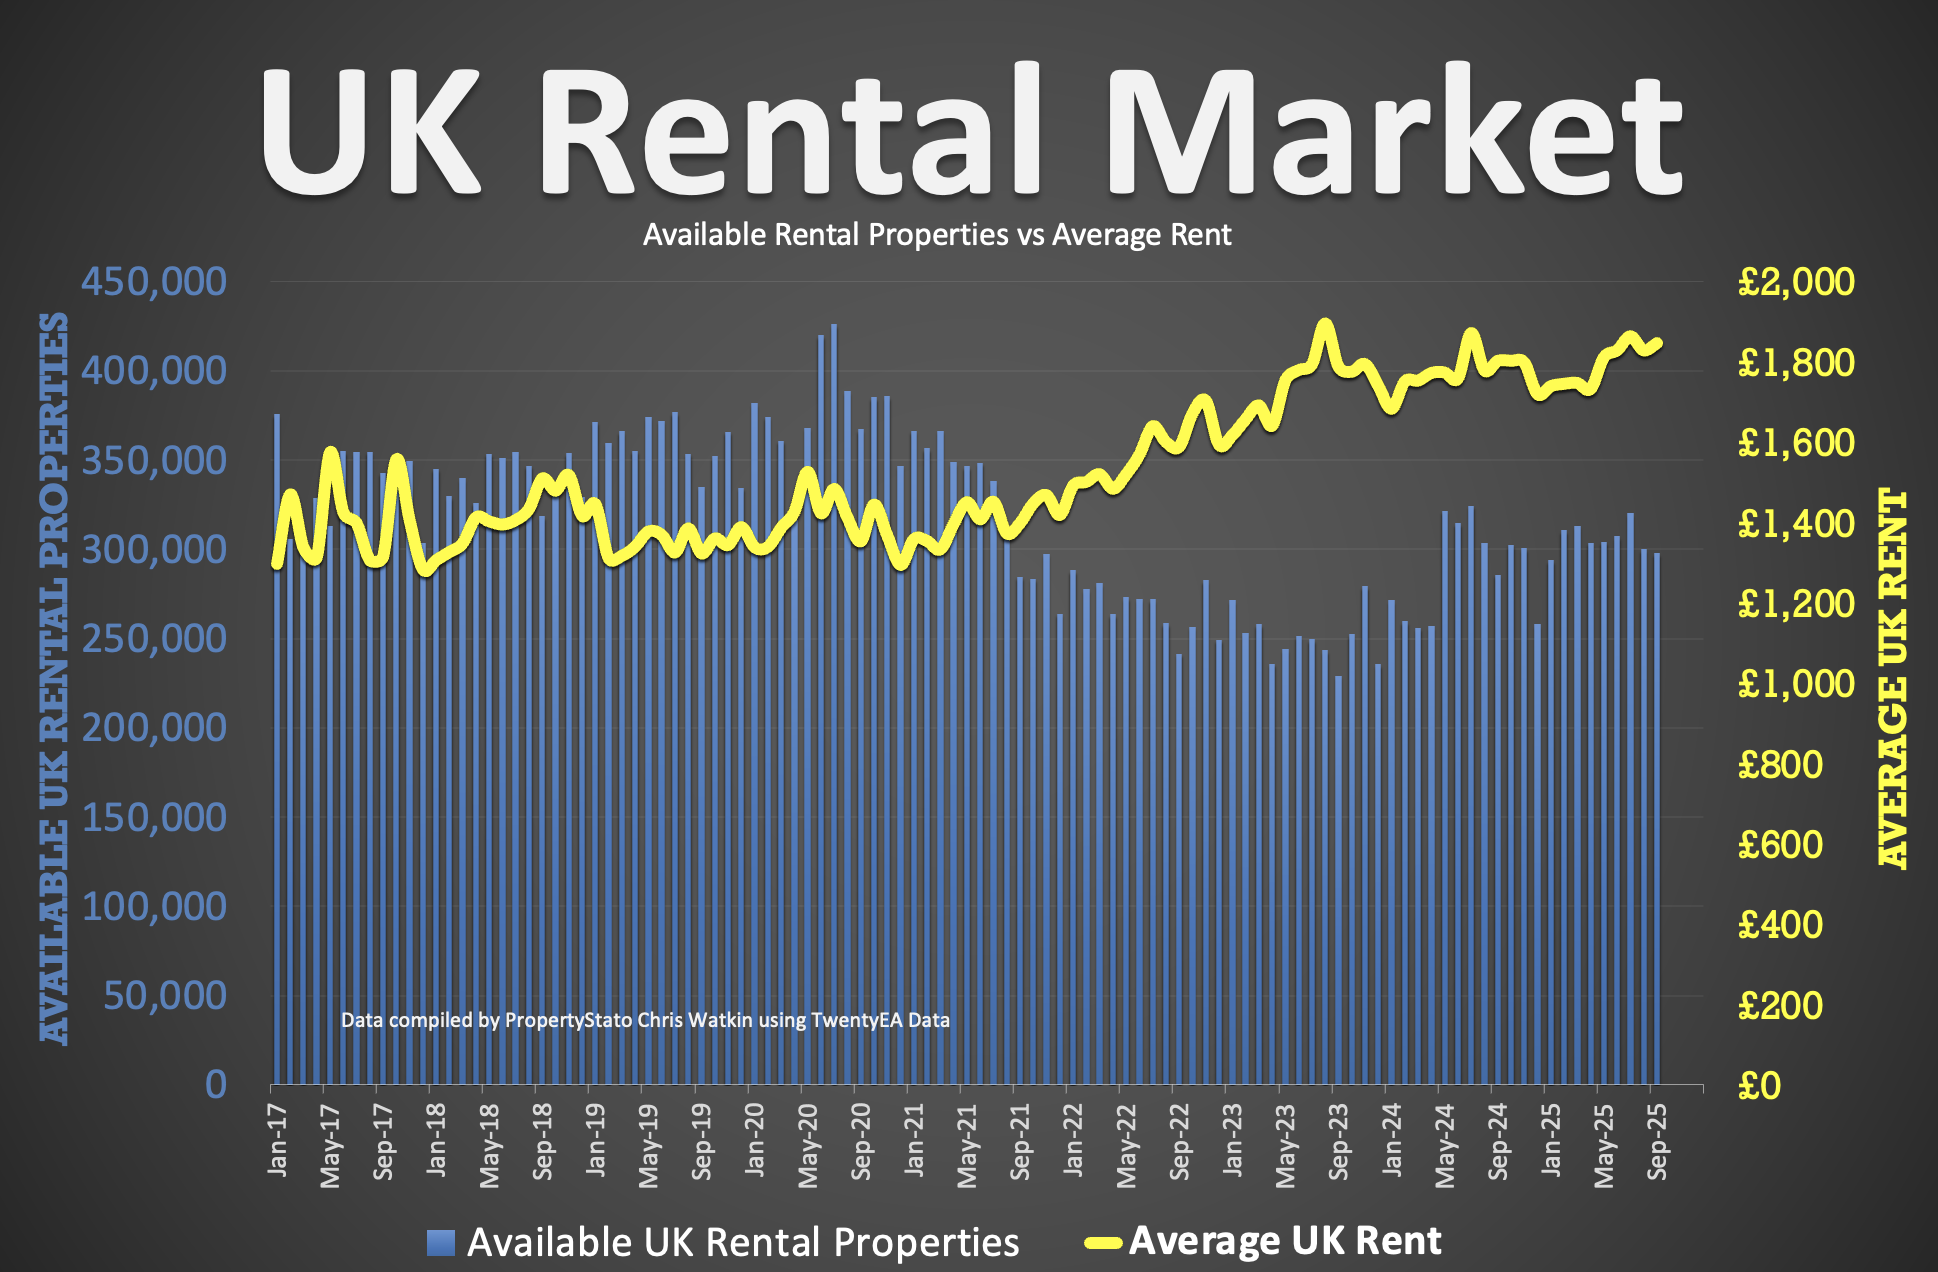
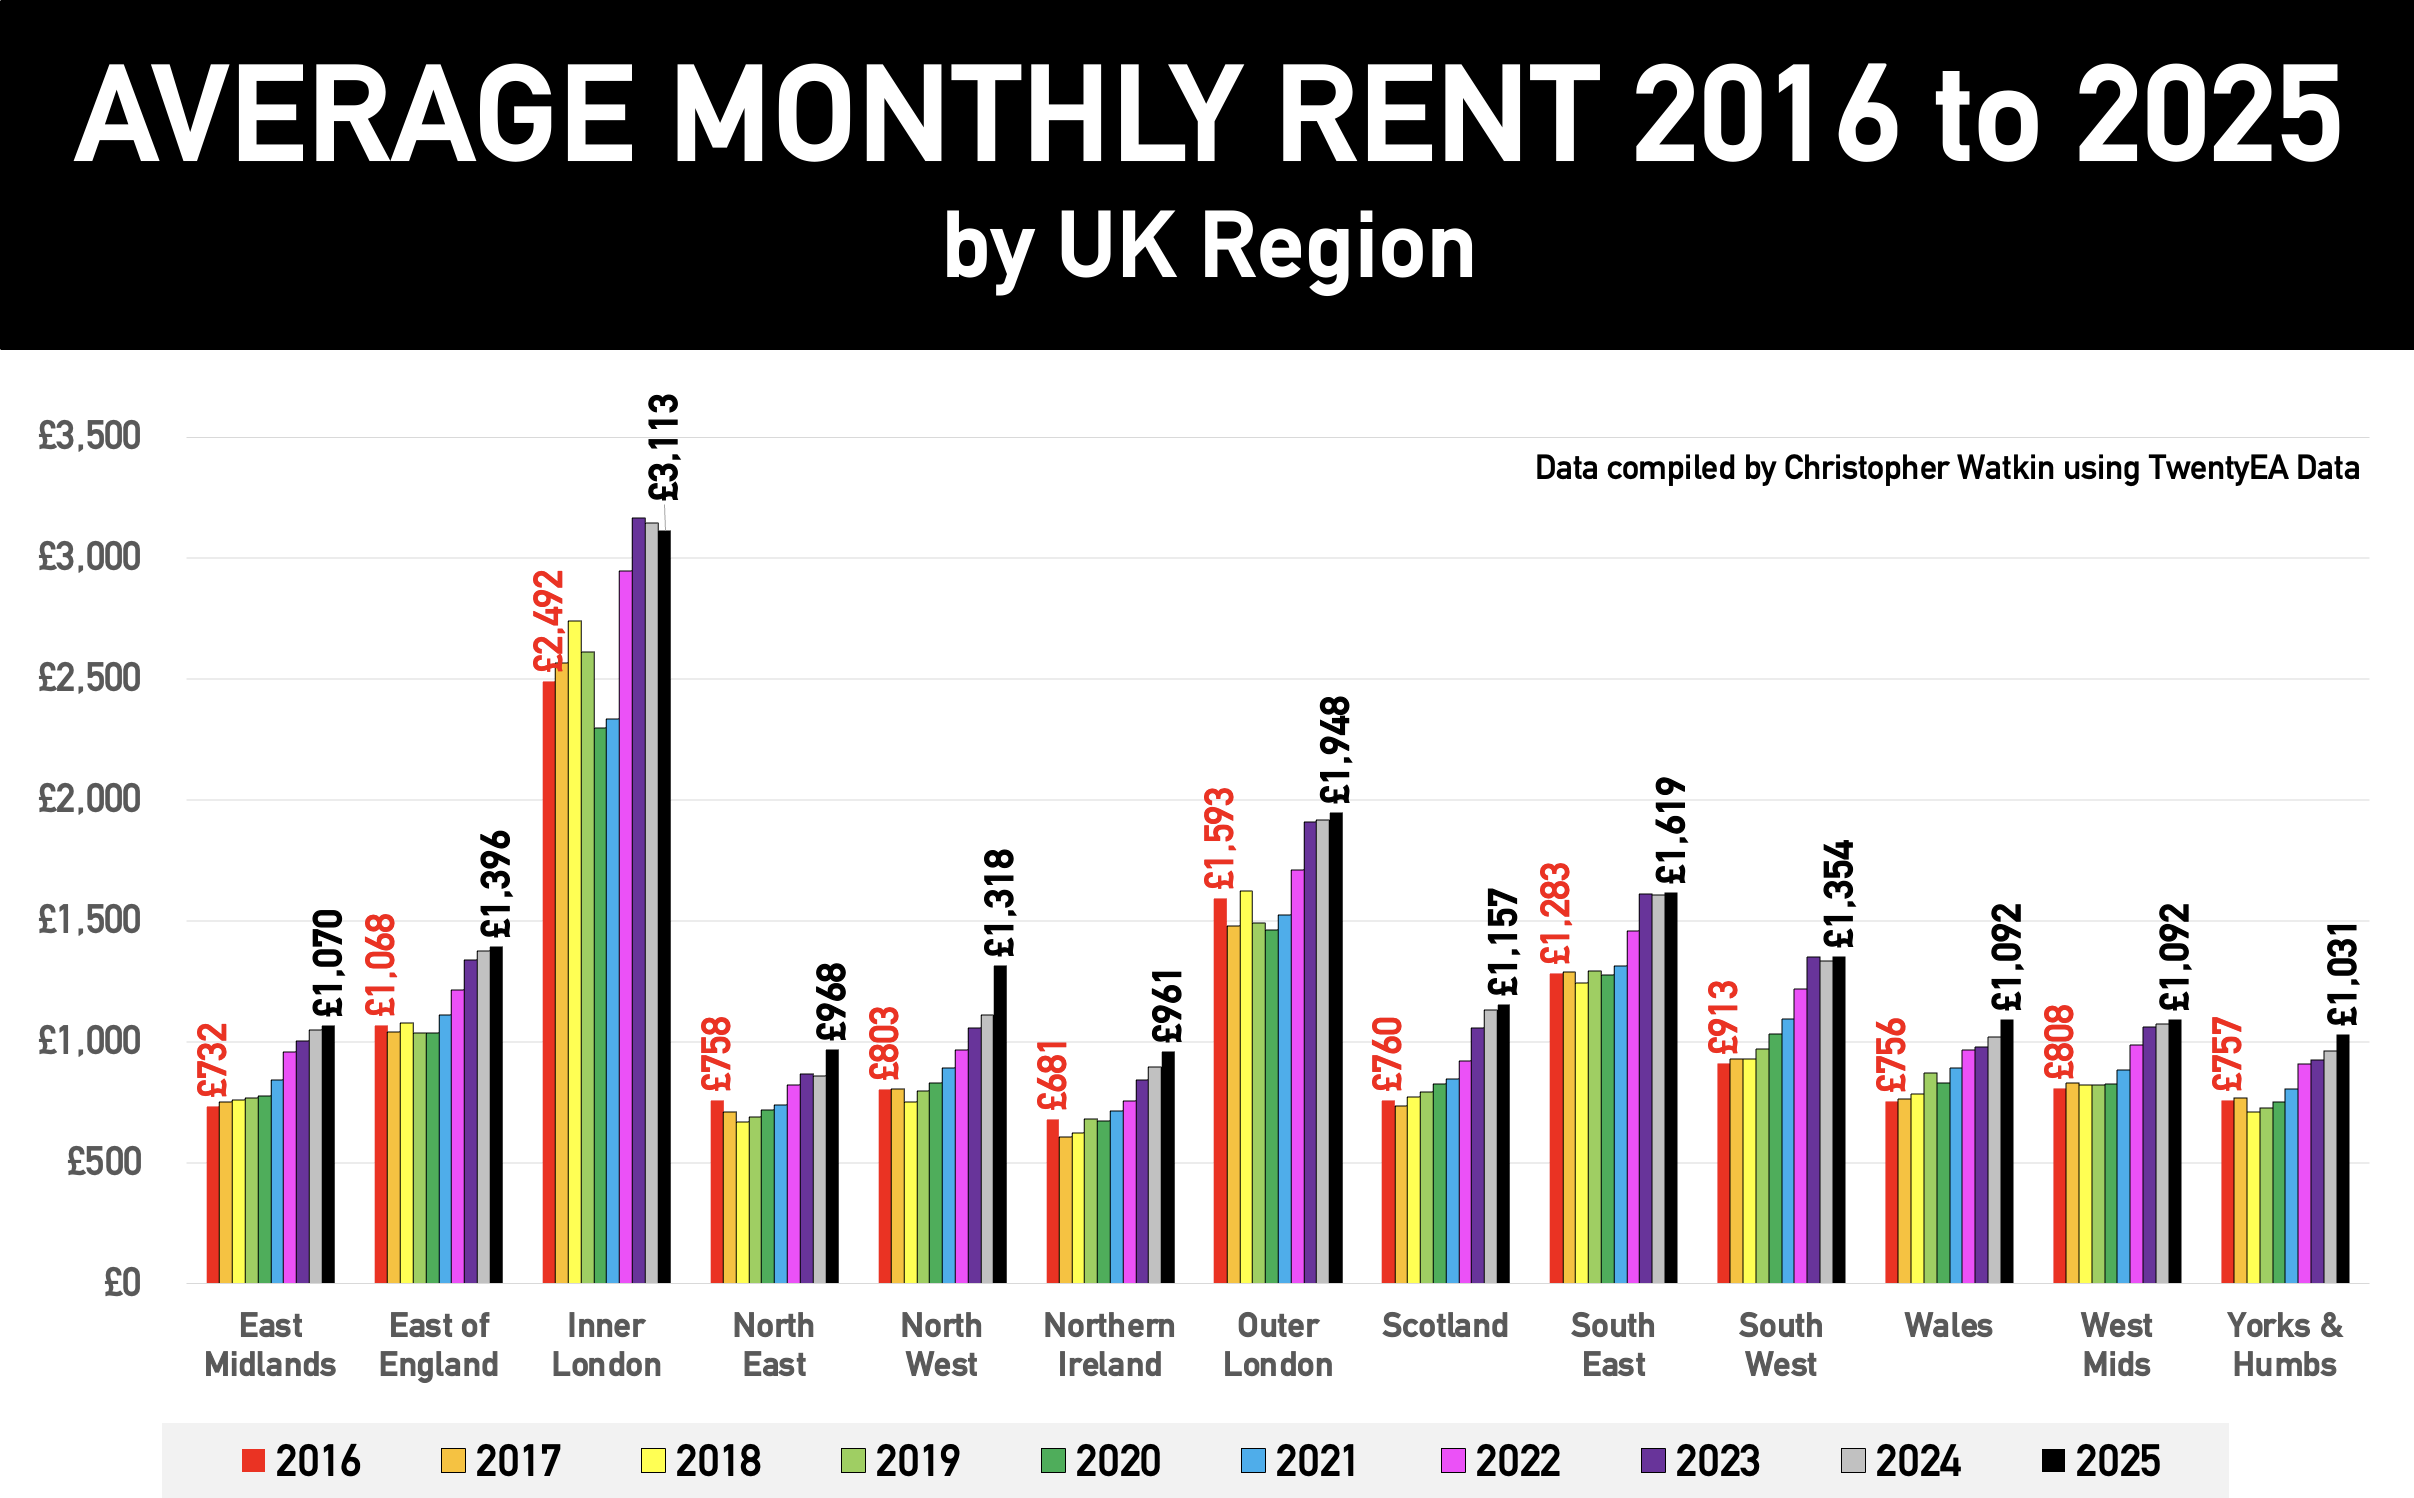
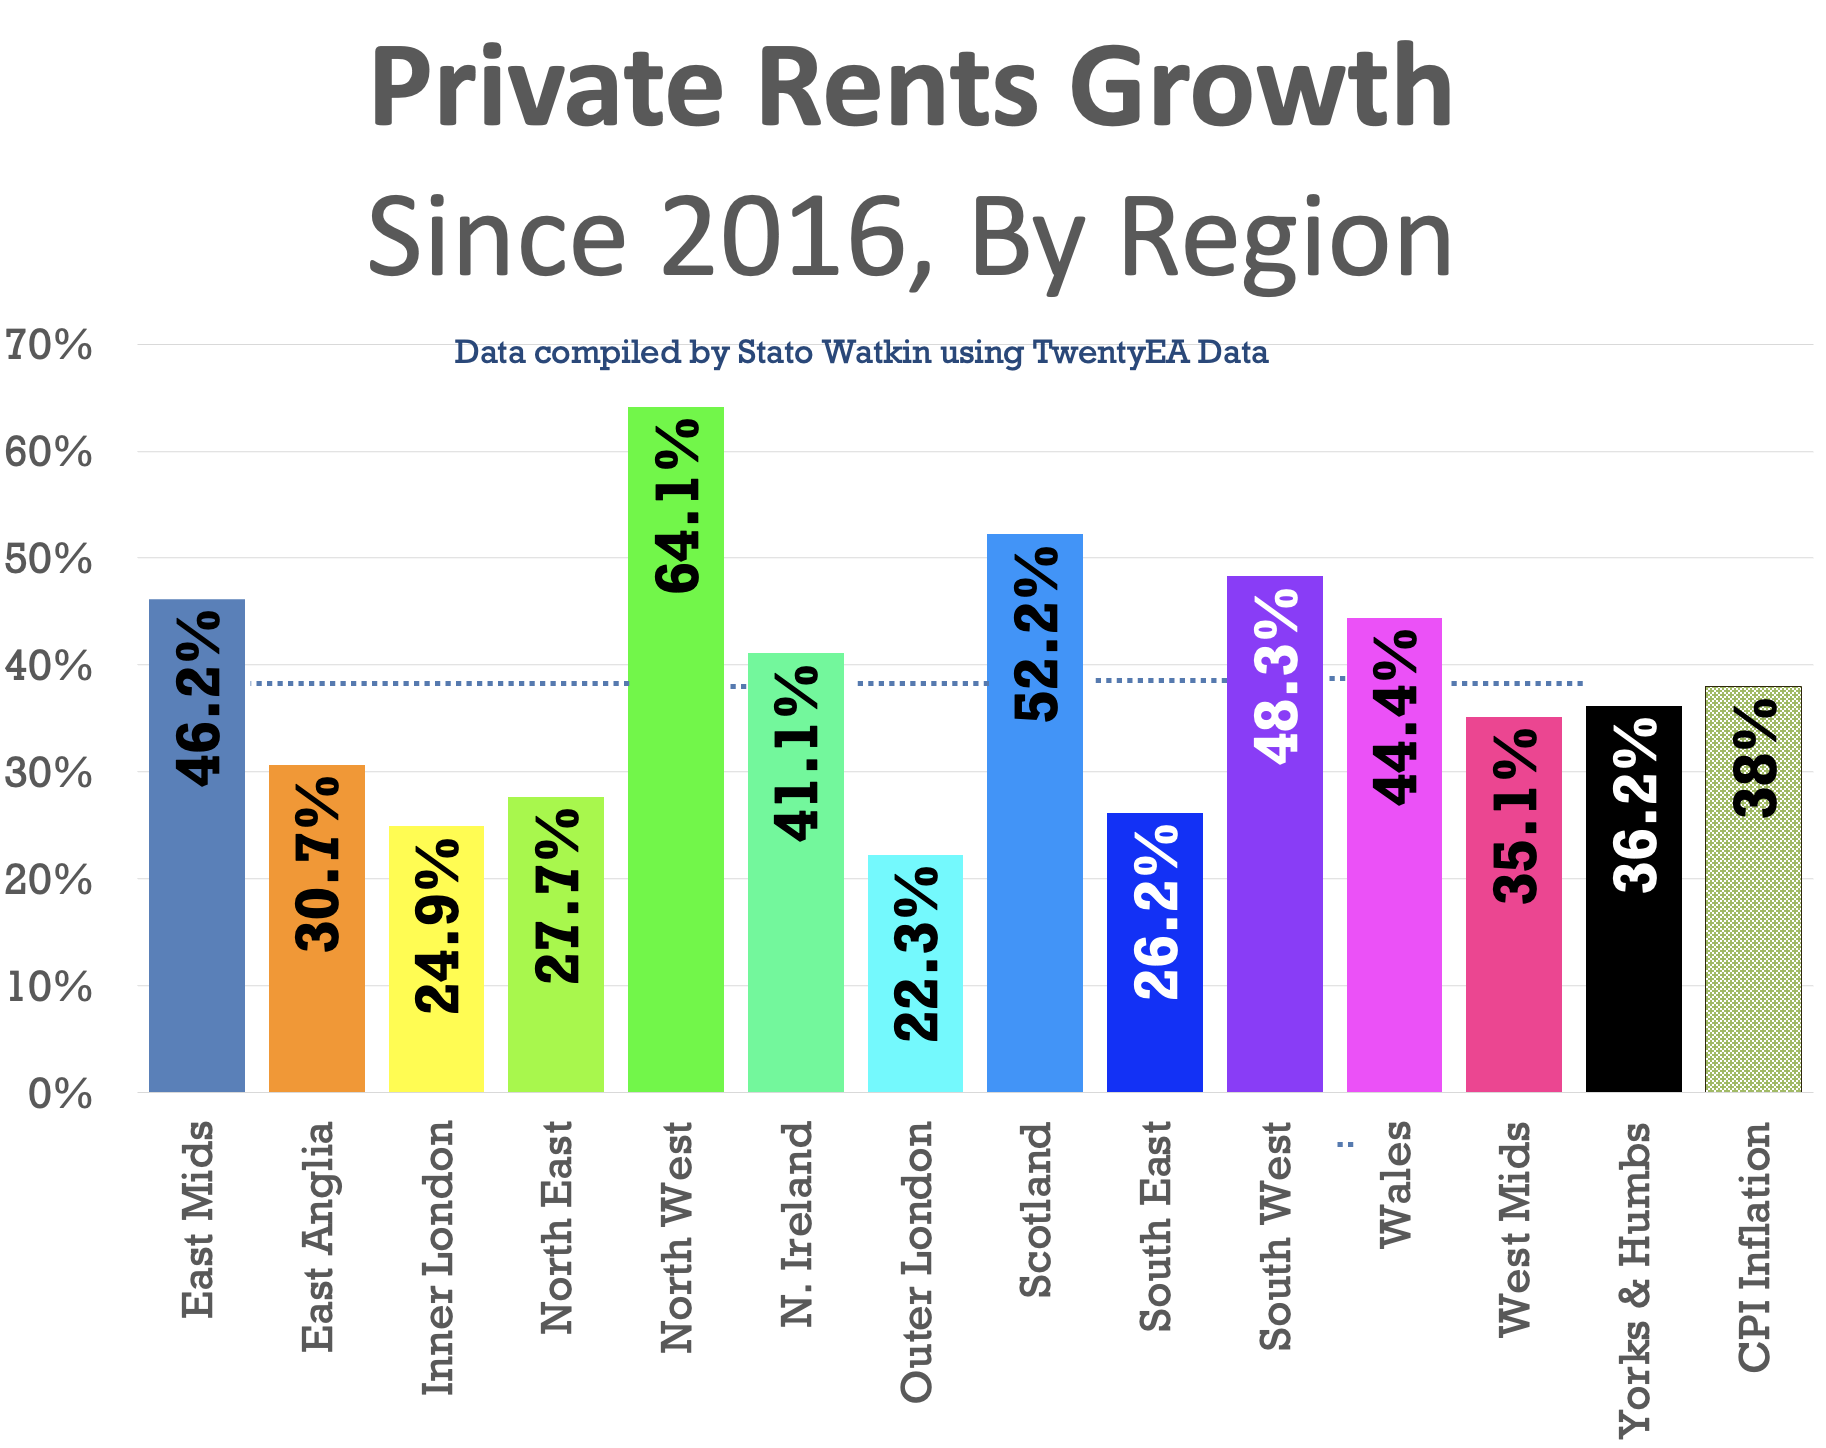
✅ Rentals
- Average Monthly Rents by region
· East Midlands – £1,070 (Growth since 2016) – 46.2%
· East Anglia – £1,396 (Growth since 2016) – 30.7%
· Inner London – £3,113 (Growth since 2016) – 24.9%
· North East – £968 (Growth since 2016) – 27.7%
· North West – £1,318 (Growth since 2016) – 64.1%
· Northern Ireland – £961 (Growth since 2016) – 41.1%
· Outer London – £1,948 (Growth since 2016) – 22.3%
· Scotland – £1,157 (Growth since 2016) – 52.2%
· South East – £1,619 (Growth since 2016) – 26.2%
· South West – £1,354 (Growth since 2016) – 48.3%
· Wales – £1,092 (Growth since 2016) – 44.4%
· West Mids – £1,092 (Growth since 2016) – 35.1%
· Yorks & Humberside – £1,031 (Growth since 2016) – 36.2%
- Average UK rent in September – £1,846 – a growth 2.44% from Sept 2024
- 297k rental properties were available in Sept ’25 (286k – Sept 24 & 229k in Sept ’23).
✅ Local Focus on the Show:
Redhill & Reigate
Read the orginal article: https://propertyindustryeye.com/what-is-currently-happening-in-the-uk-property-market-70/


