 The pace of London outmigration has continued to slow, reaching its lowest level in over a decade. Hamptons’ analysis of Countrywide data shows that in the first seven months of 2025, Londoners purchased just 5.3% of homes sold outside the capital—down from a peak of 8.2% in 2022, when the Covid-induced race for space was in full swing. This figure not only reflects a reversal of pandemic-driven migration patterns but also sits below the pre-Covid average of 5.9% recorded between 2010 and 2020.
The decline in outmigration is partly a consequence of the return to office-based working, which has reduced the appeal of relocating further afield. However, it also stems from a slower London housing market, which has gradually reduced the purchasing power of would-be movers.
Chart 1 – Share of homes bought outside the capital by a Londoner
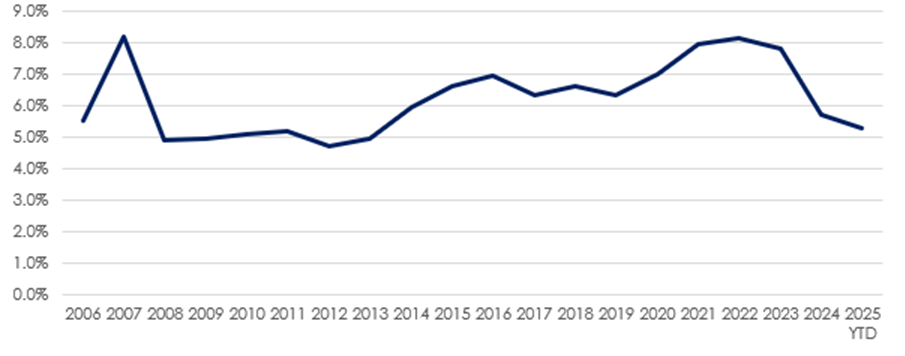
Source: Hamptons
Property values in the capital, particularly in Inner London, have risen at a more muted pace than elsewhere in the country, making it more challenging for homeowners to trade up or relocate. Prices have risen 26% outside the capital over the last five years, triple the pace recorded in London (8%). Over the last decade, prices outside the capital have increased by 55%, outpacing the Greater London average of 23% (table 1).
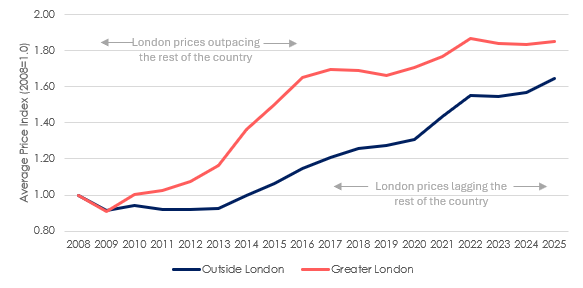
Chart 2, Table 1 – Price growth in and outside of London
| Outside of London | Greater London | Inner London | Outer London | |
| Average Price | £242,720 | £560,100 | £655,580 | £509,800 |
| 2025 v 2024 | 5.0% | 0.7% | -0.9% | 2.5% |
| 2025 v 2020 | 26% | 8% | 2% | 13% |
| 2025 v 2015 | 55% | 23% | 12% | 33% |
Source: ONS, Land Registry & Hamptons
In total, Londoners bought 31,620 homes outside the capital in England and Wales during the first seven months of this year. While this represents a 7% increase compared to the same period last year—driven by a strengthening housing market where transaction volumes are up 15% year-on-year across Great Britain—it is still half the number recorded during the same period in 2021, when 63,600 homes were purchased outside the capital by a Londoner.
The current level of outmigration is more in line with figures from over a decade ago, before the pandemic reshaped housing preferences, and during a time when the London market was fairly subdued following the financial crash.
While most movers still come from Outer London (70%), Inner Londoners now account for a record 30% of all those moving out, up from 25% a decade ago. This shift reflects how weaker price growth in central London has made it harder for homeowners to move locally, particularly when borrowing costs are high, prompting more to consider areas further afield for better value.
Purchasing Power and Space Gains
The fall in outmigration is closely tied to the capital’s subdued housing market. In many parts of London, particularly in the centre, property prices have stagnated or even declined, limiting equity growth and reducing the financial incentive to relocate. Meanwhile, house prices outside the capital have continued to climb, further narrowing their advantage and making it harder for Londoners to afford a larger home elsewhere.
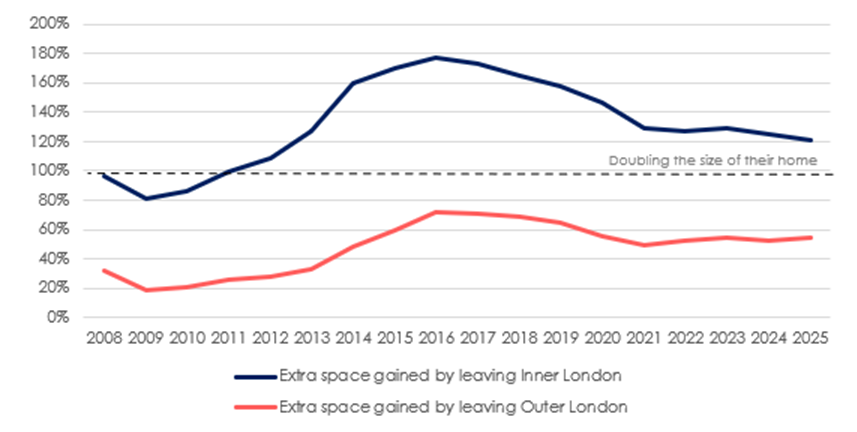
Extra space gained by leaving London
Source: ONS & Hamptons
This erosion of purchasing power is particularly evident among Inner London leavers. So far this year, they spent an average of £417,660 on their new home outside the capital —25% more than in 2015. In contrast, those leaving Outer London, where prices have held up better, spent 34% more than they did a decade ago.
Despite these challenges, London leavers still benefit from the ability to buy more space when moving out of the capital. The typical household selling in Inner London for £655,580 this year could afford to more than double the size of their property – gaining 121% or 1,178 extra square feet of space.
However, this is nearly a third (32%) less space than if they had moved in 2016, when spatial purchasing power peaked and movers could nearly treble their space (chart 3). Compared to 2016, the average Inner London property buys 553 fewer square feet outside of London, roughly equivalent to two double bedrooms or a typical one-bed flat.
For Outer London leavers, the decline in the extra space they can afford to buy has been less pronounced. The average household selling a home for £509,800 this year could increase their space by 55%, down from 72% in 2016. This is largely because house price movements in Outer London have more closely tracked those outside the capital, preserving more of their relative purchasing power.
Chart 4 – Share of London leavers who move beyond the East or South East of England

Source: Hamptons
Historically, those leaving Inner London have tended to move further afield than their Outer London counterparts, often beyond the traditional commuter belt of the South East and East of England. Back in 2021, 37% of Inner London leavers purchased homes outside these two regions, compared to just 28% of Outer London movers, who were more likely to remain within reach of the capital (chart 4). Destinations such as Cornwall, Bournemouth and Poole, and the Cotswolds were particularly popular among central London leavers seeking lifestyle-driven moves.
However, this year marks a shift in those patterns. Inner London leavers are now just as likely to remain within the South East or East of England as those moving from Outer London – with 31% of leavers moving beyond those regions (chart 4). Rather than seeking out prime locations further afield, this suggests that affordability has become a more dominant driver of relocation decisions. With weaker price growth in central London limiting equity gains, many Inner London homeowners appear focused on retaining links to the capital, while still aiming to maximise value for money.
The shift in migration patterns is also reflected in the changing geography of where Londoners are buying. So far this year, Londoners accounted for over half of all buyers in just five local authorities — down from seven in both 2015 and 2020.
In 2015, areas like Broxbourne (66%), Sevenoaks (63%), and Welwyn Hatfield (60%) topped the list, reflecting strong demand for traditional commuter towns. By 2020, Broxbourne had risen to 87%, and Dartford, Epsom & Ewell, and Epping Forest all exceeded 60%, as the pandemic drove buyers further out in search of space (table 2).
However, in 2025, the list has shifted. While Dartford (67%), Epping Forest (62%), and Tandridge (61%) remain popular, more affordable areas such as Thurrock (59%), Hertsmere (54%), and Basildon (38%) have climbed the ranks (table 2). This highlights how movers are increasingly prioritising value over prestige while staying within reach of the capital.
Table 2 – Top 10 local authorities with the highest % of buyers from London
| 2015 | 2020 | 2025 | |||
| Broxbourne | 66% | Broxbourne | 87% | Dartford | 67% |
| Sevenoaks | 63% | Epsom and Ewell | 69% | Epping Forest | 62% |
| Welwyn Hatfield | 60% | Dartford | 65% | Tandridge | 61% |
| Tandridge | 55% | Epping Forest | 60% | Thurrock | 59% |
| Dartford | 55% | Sevenoaks | 55% | Hertsmere | 54% |
| Thurrock | 55% | Tandridge | 54% | Epsom and Ewell | 48% |
| Three Rivers | 53% | Thurrock | 54% | Brentwood | 44% |
| Epping Forest | 49% | Elmbridge | 48% | Elmbridge | 42% |
| Slough | 47% | Mole Valley | 39% | Sevenoaks | 40% |
| Elmbridge | 45% | Brentwood | 38% | Basildon | 38% |
Source: Hamptons
Aneisha Beveridge, head of research at Hamptons, said: “London’s housing market has been treading water for much of the last decade, and that’s now shaping migration patterns. The return to the office has played a role in curbing the appetite for long-distance moves, but it’s the lack of price growth in the capital that’s really clipped the wings of would-be leavers.
“Many London homeowners simply haven’t built up enough equity to make the leap to where they want to go, especially as prices outside the capital have continued to climb. The result is fewer moves, shorter distances, and a growing focus on affordability over aspiration.
“We’re seeing a clear shift in where Londoners are heading. The pandemic pushed buyers into leafier, more lifestyle-driven locations, but today’s movers are more pragmatic. Places like Dartford and Thurrock are topping the list—not just because they’re commutable, but because they offer better value, particularly for first-time buyers.
“Even Inner London leavers, who once ventured far and wide, are now staying closer to the capital. In a sign of the times, the dream of doubling your space still exists, but it’s no longer a given. Buyers are having to compromise, and that’s reshaping the map of London outmigration.”
Read the orginal article: https://propertyindustryeye.com/lowest-london-outmigration-in-more-than-a-decade-new-data-shows/


