
 Welcome to the 30th UK Property Market Stats Show of 2025 — your go-to weekly YouTube ‘TV Show’ on the UK property market.
This week, I’m joined by Simon Gates, as we unpack the key headlines from the 30th week of 2025, ending Sunday, 3rd August 2025.
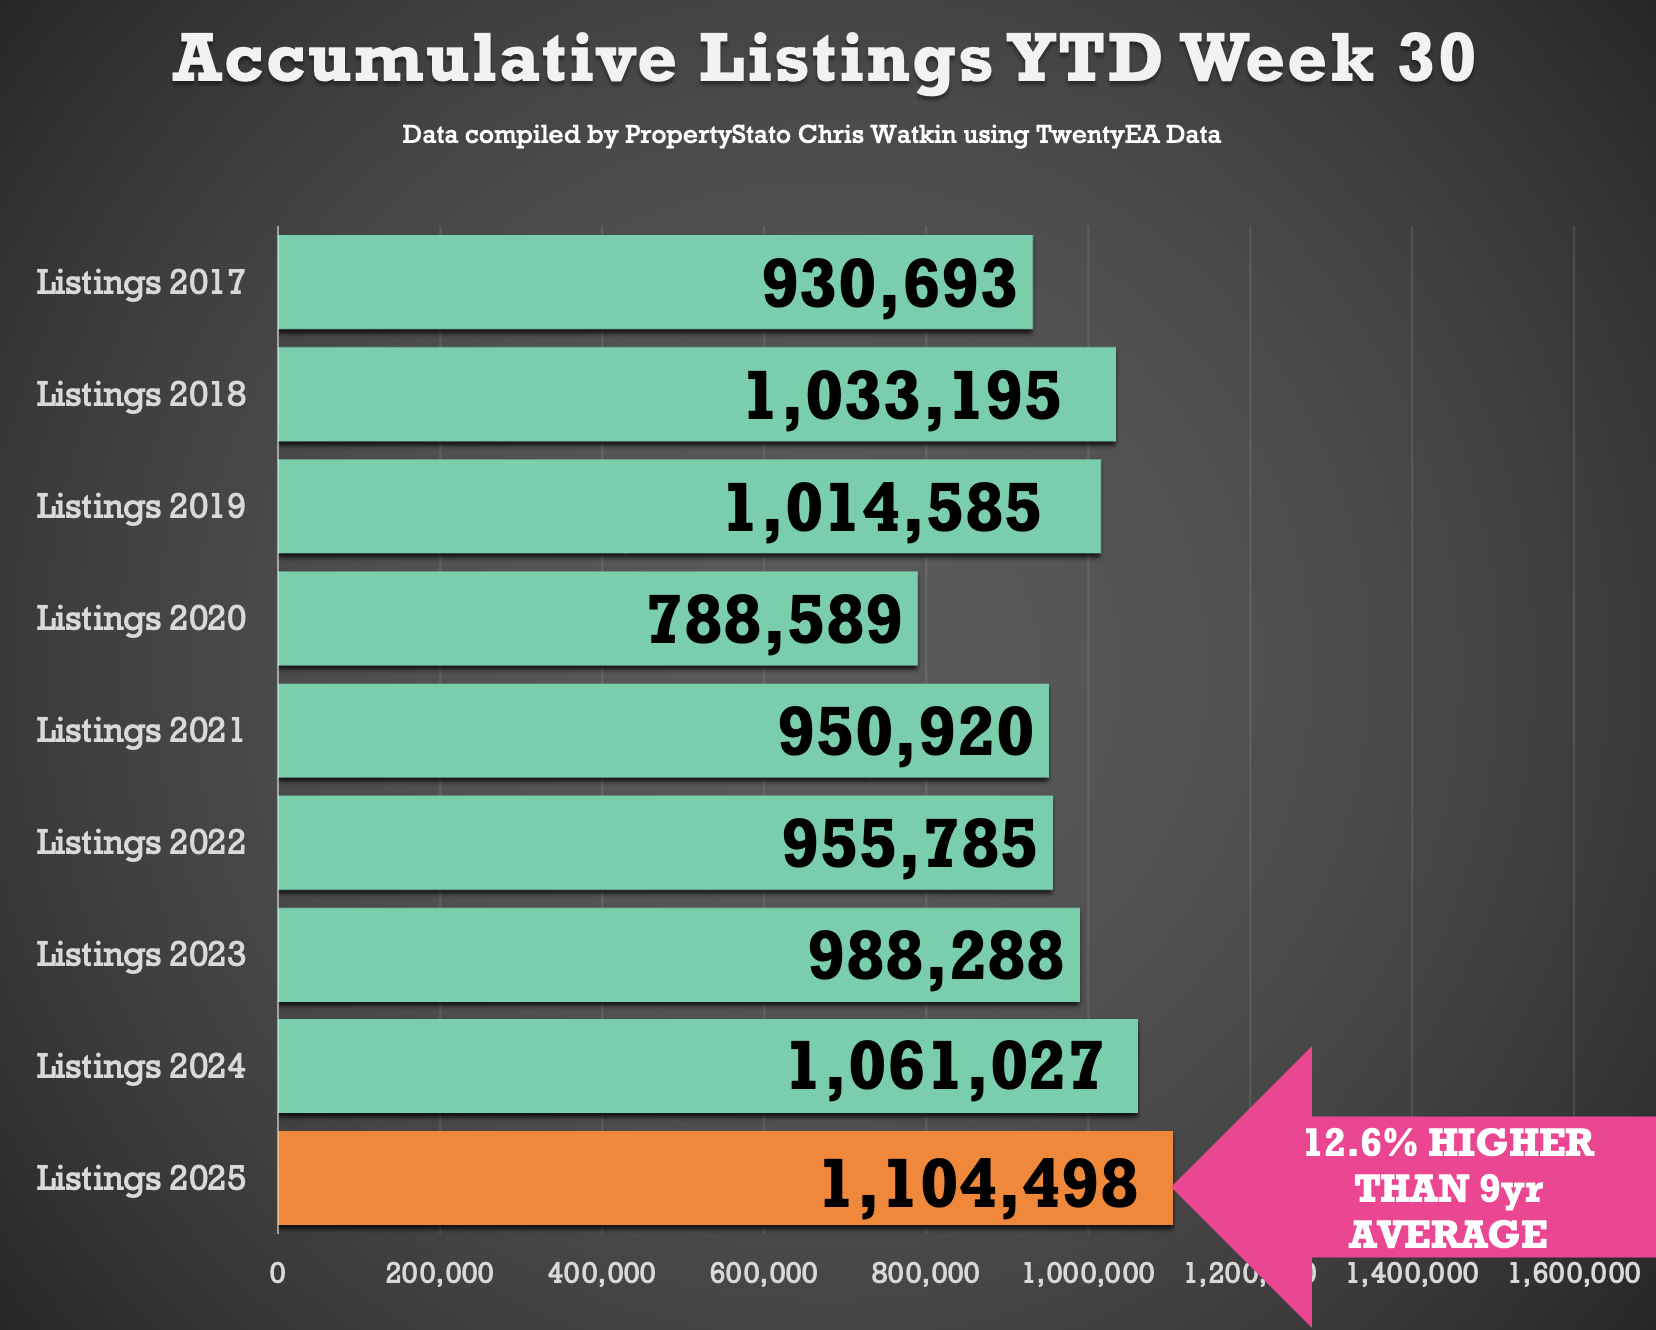
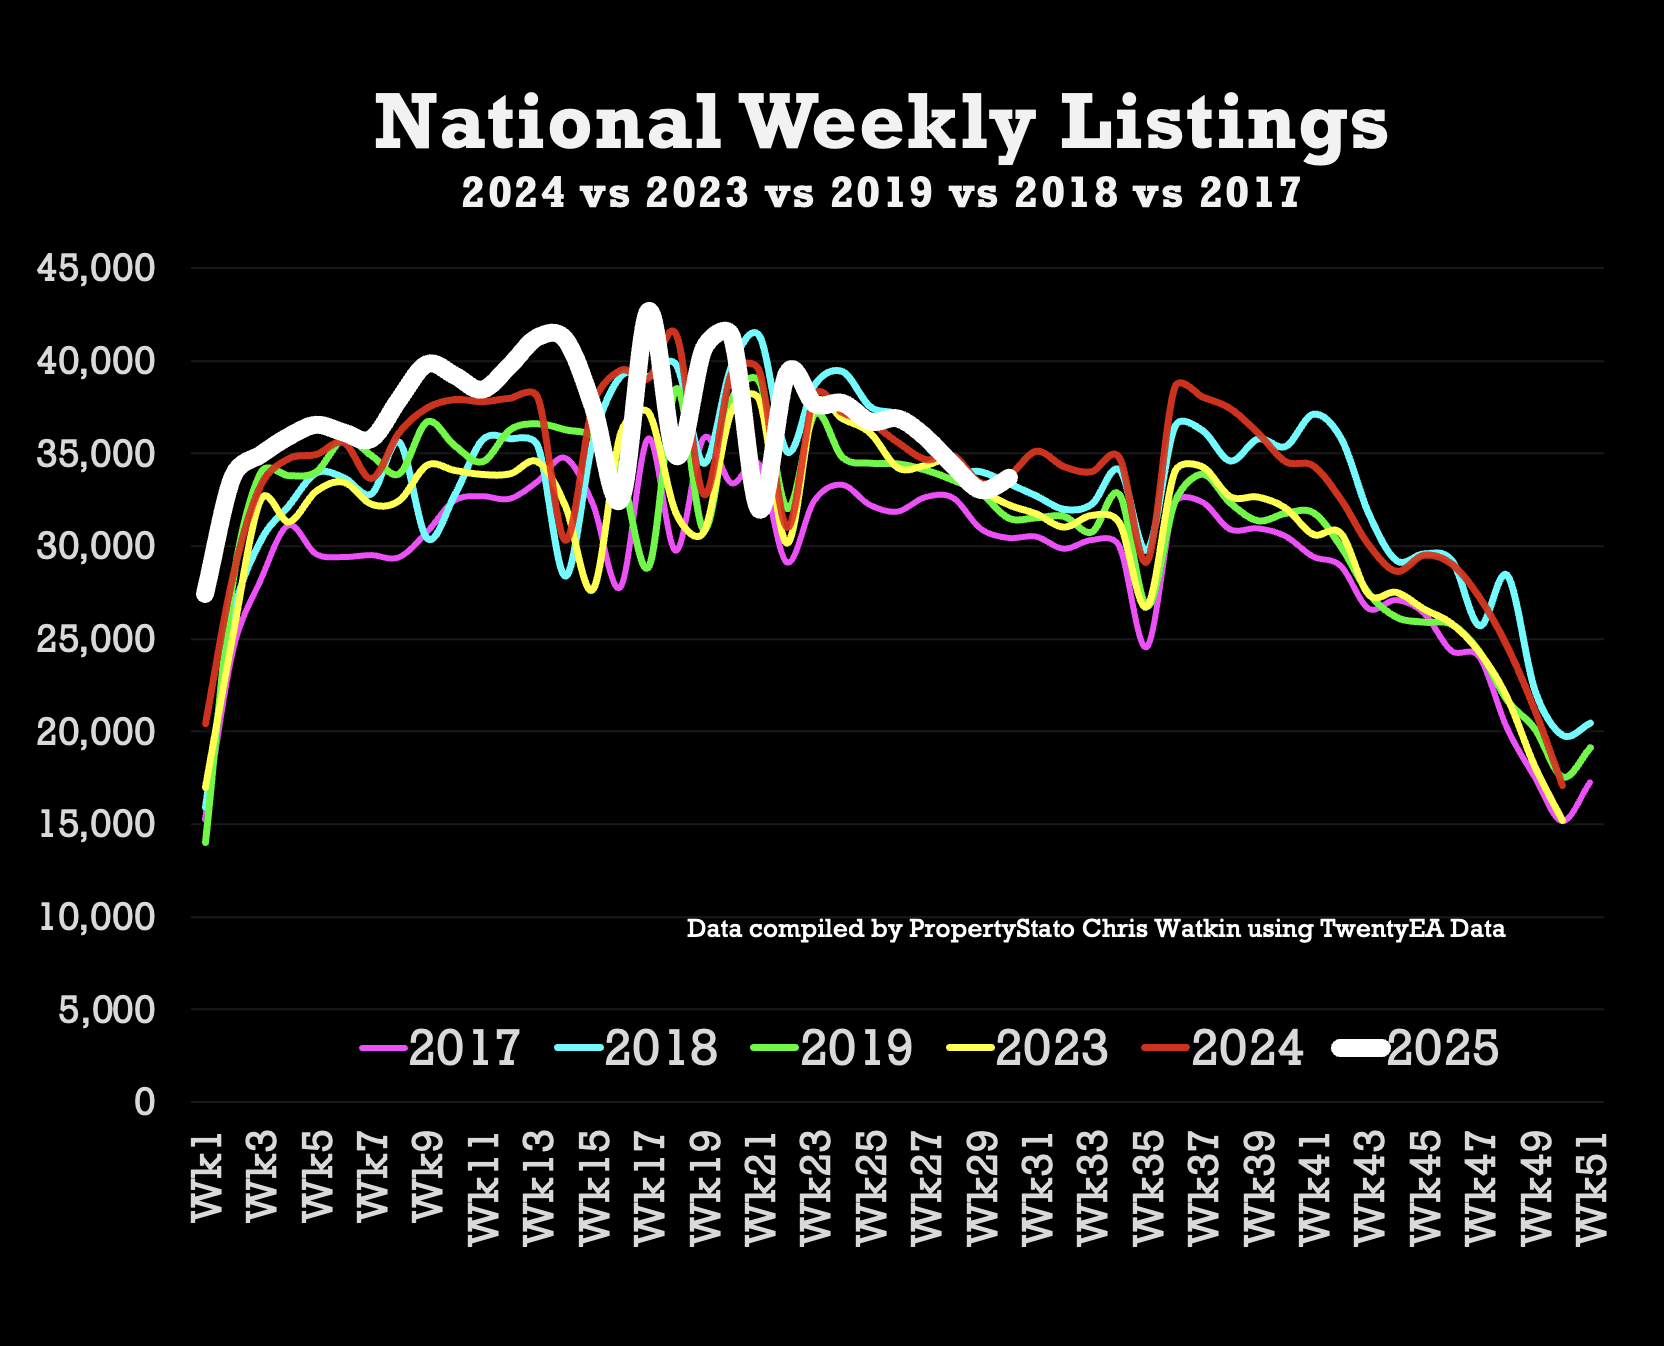
✅ Listings (New to Market)
33.7k new listings this week (Up from 33k last week).
YTD listings are 4.1% higher than 2024 YTD and 6.9% above the 2017–19 YTD average (1.10m YTD vs 1.06m in 2024 YTD).
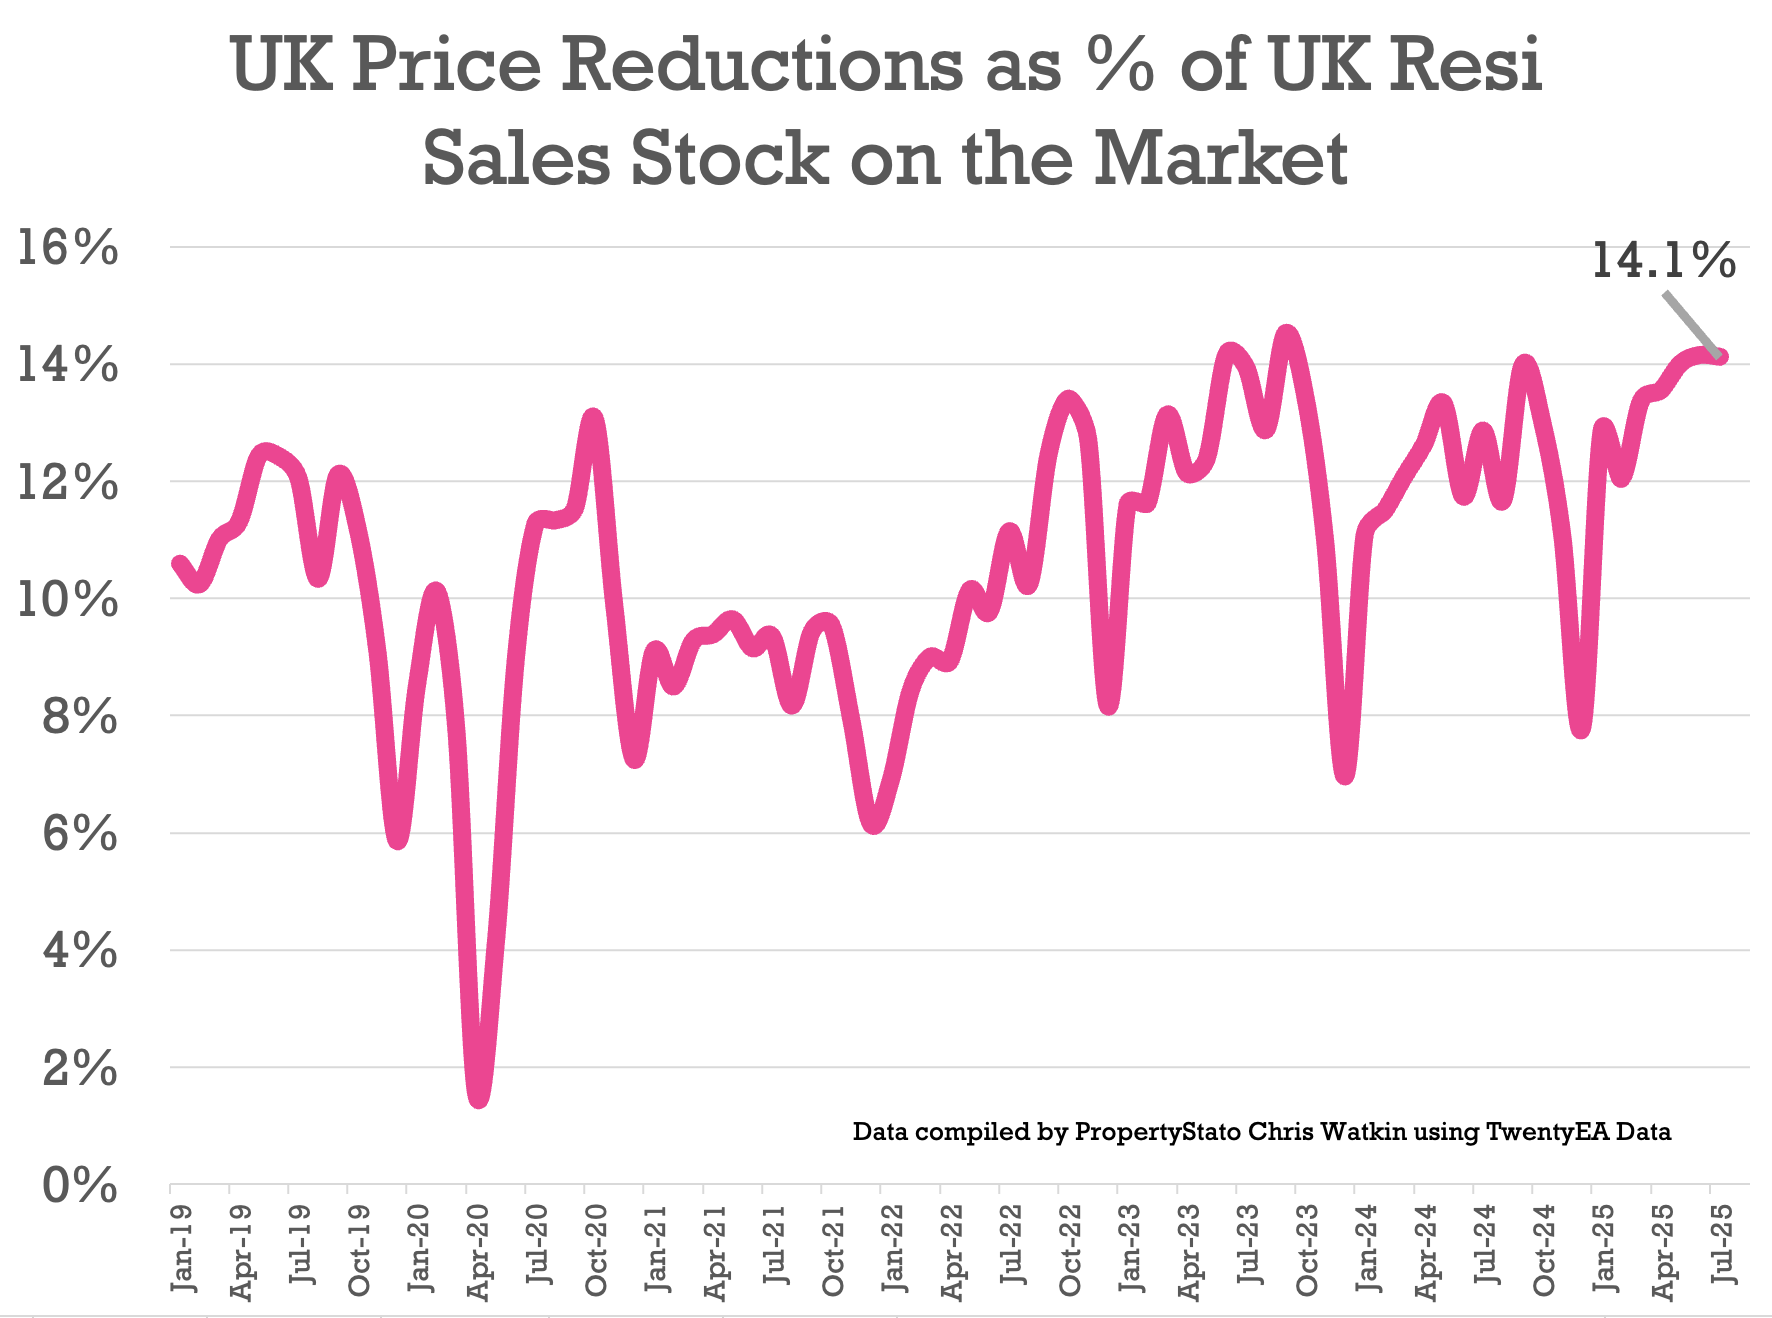
✅ Price Reductions
22.7k reductions this week (down from 23.5k last week).
That’s still only 1 in 7.1 homes on the market being reduced monthly (14.1%)
For context:
- 14.1% in July, 14% in June & 13.4% in May
- 12.1% average in 2024
- Long-term 5-year average: 10.6%.
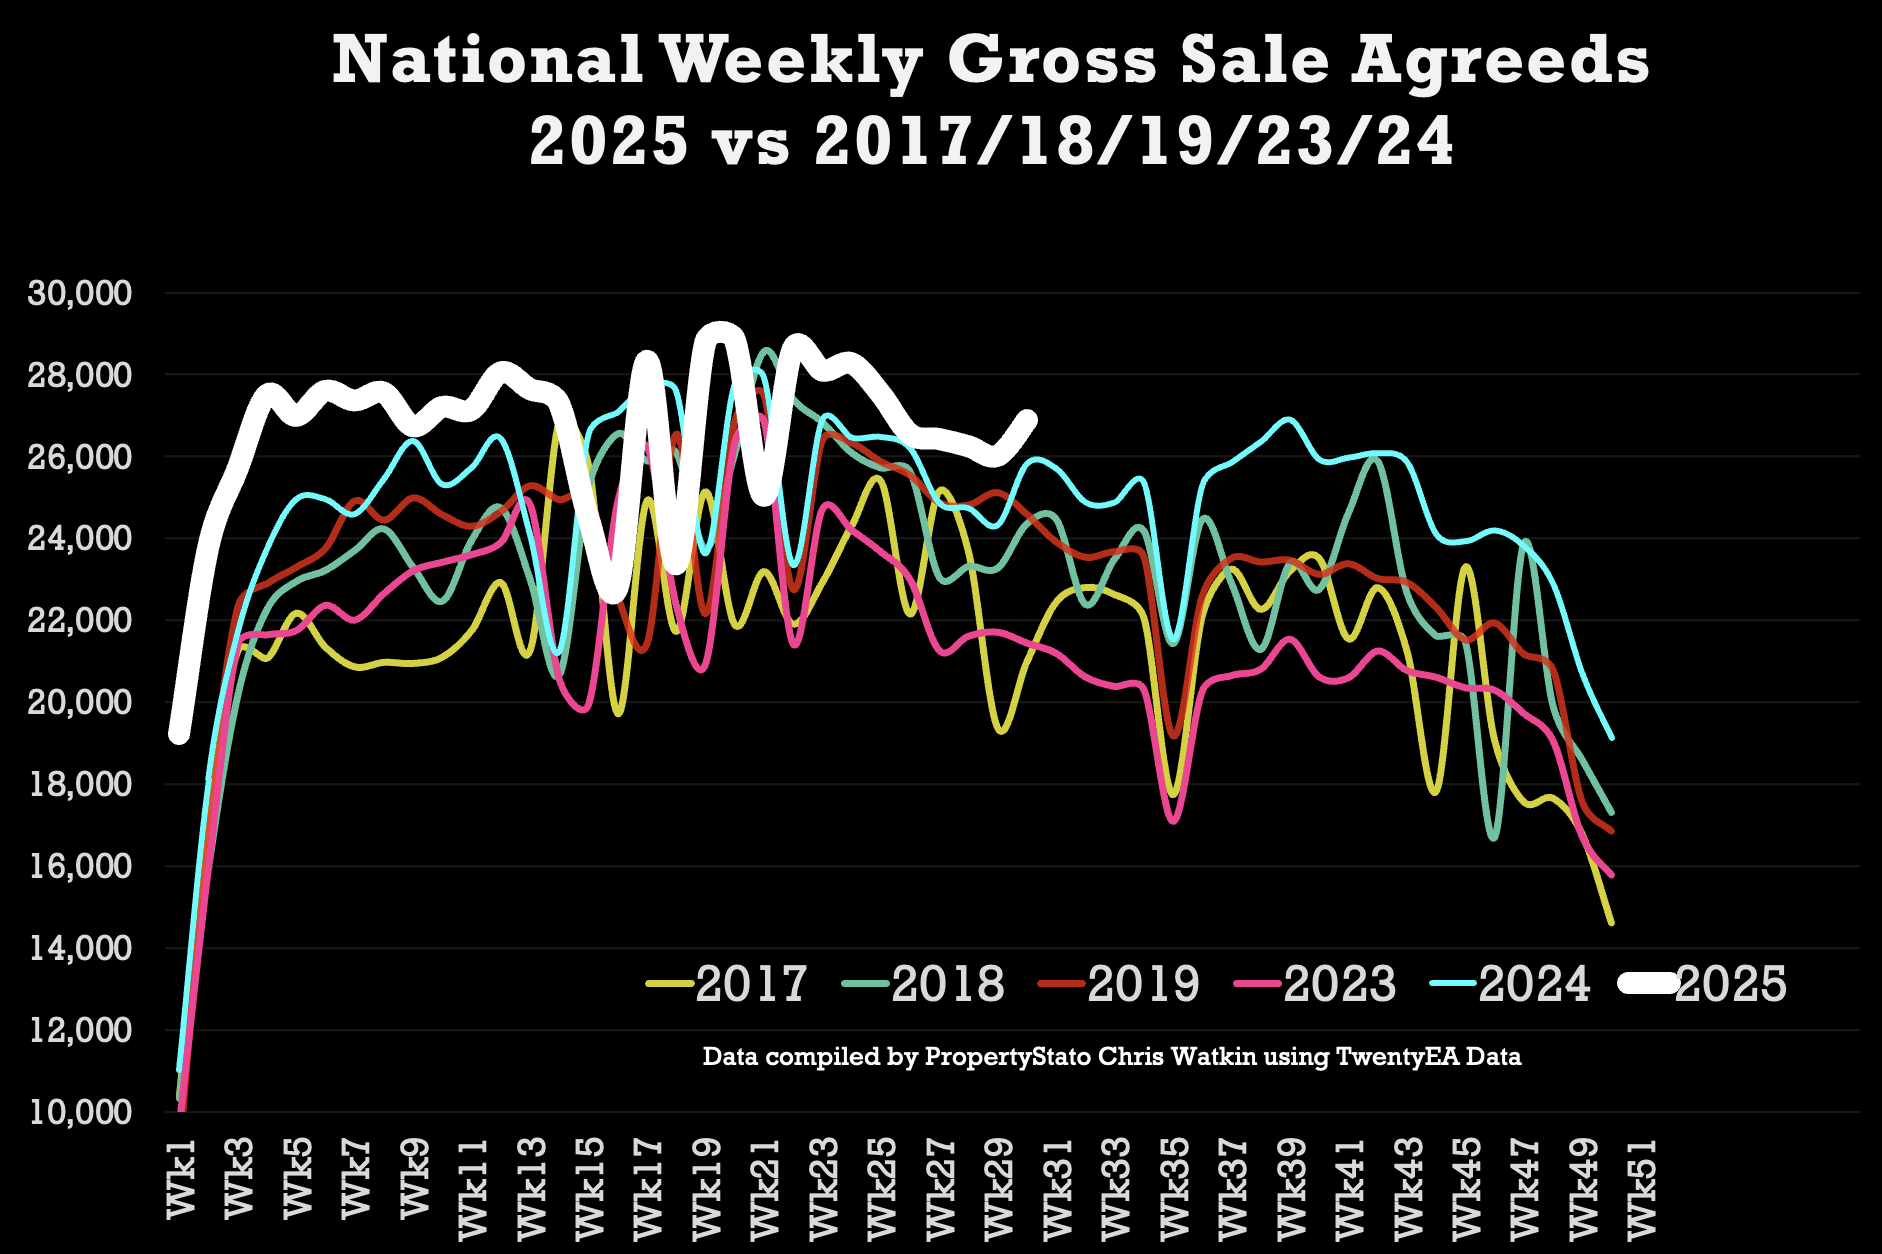
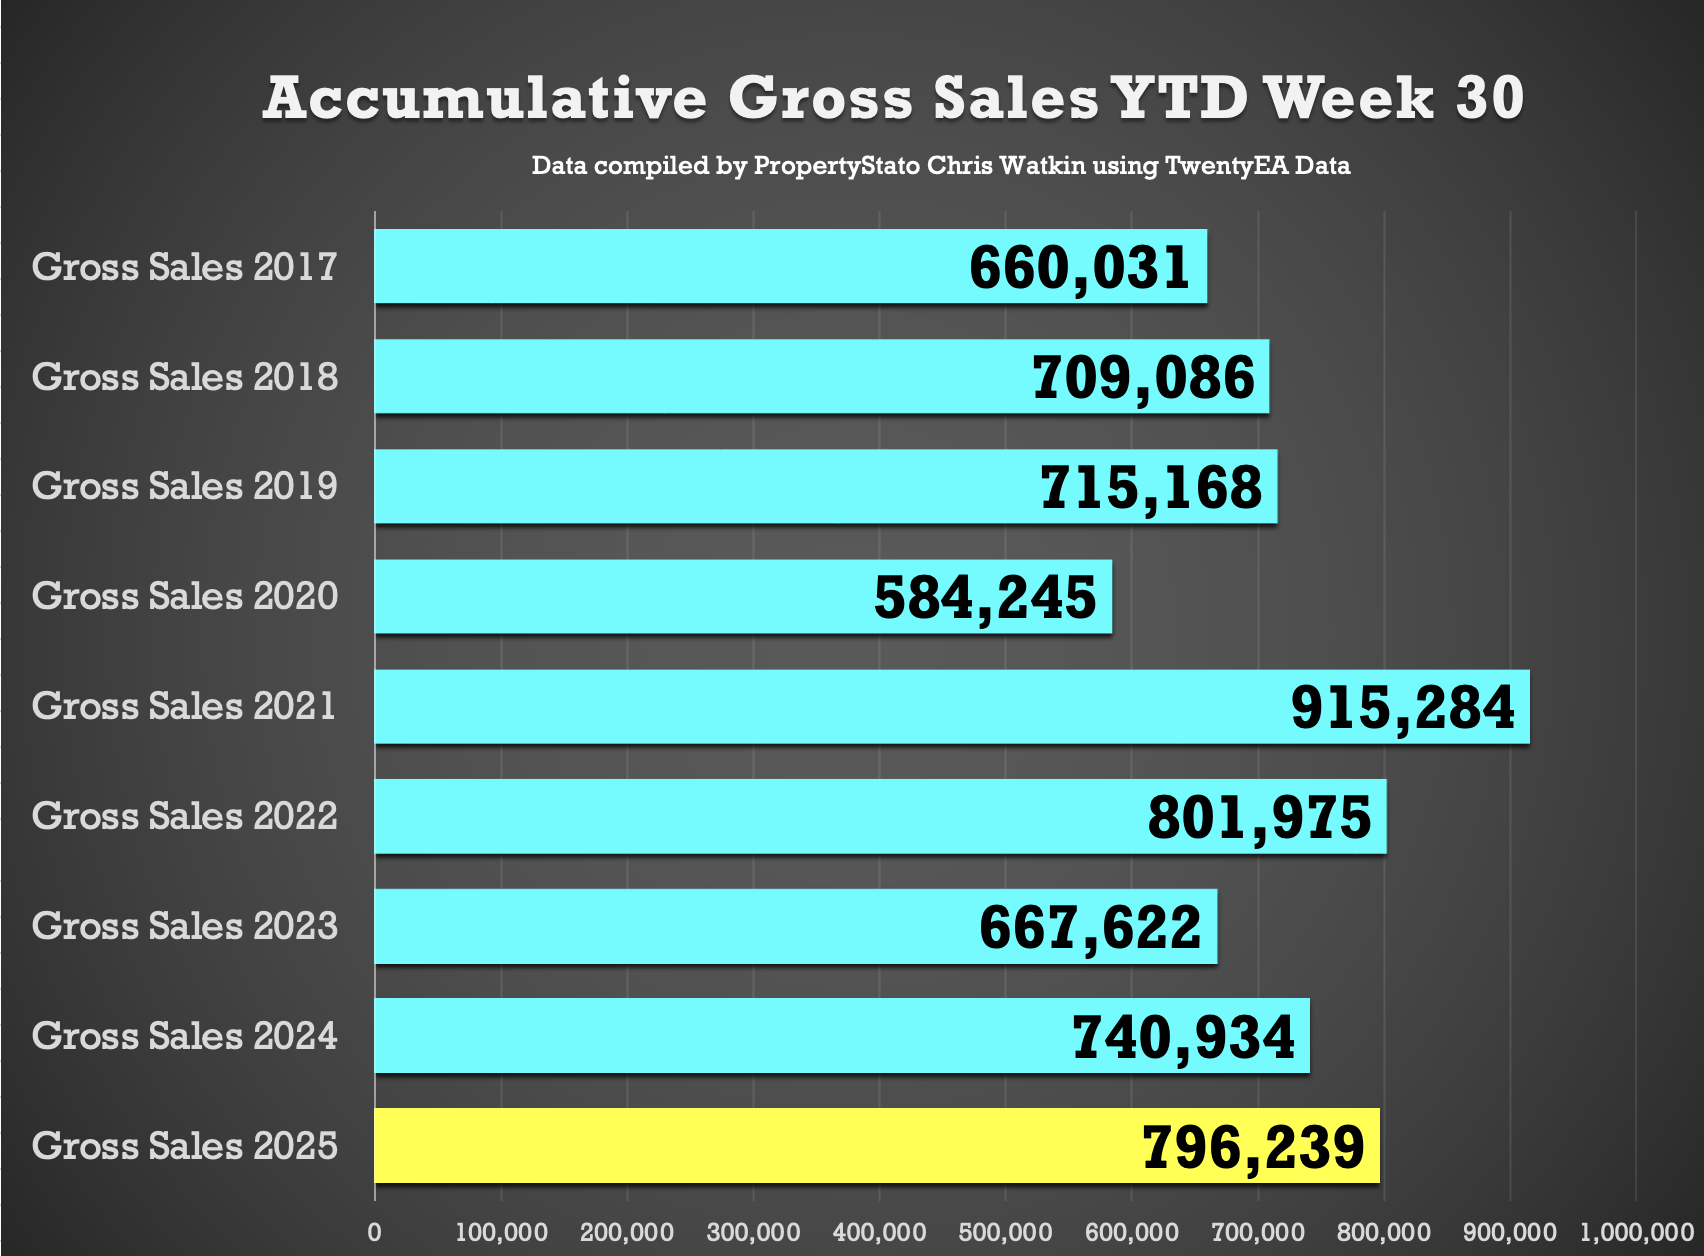
✅ Sales Agreed
26.9k homes sold STC this week (up from 26k last week)
YTD agreed sales:
- 7.5% up on 2024 (796k vs 741k)
- 14.8% up on pre-Covid average of 695k (2017–19). Graph 8 Graph 9

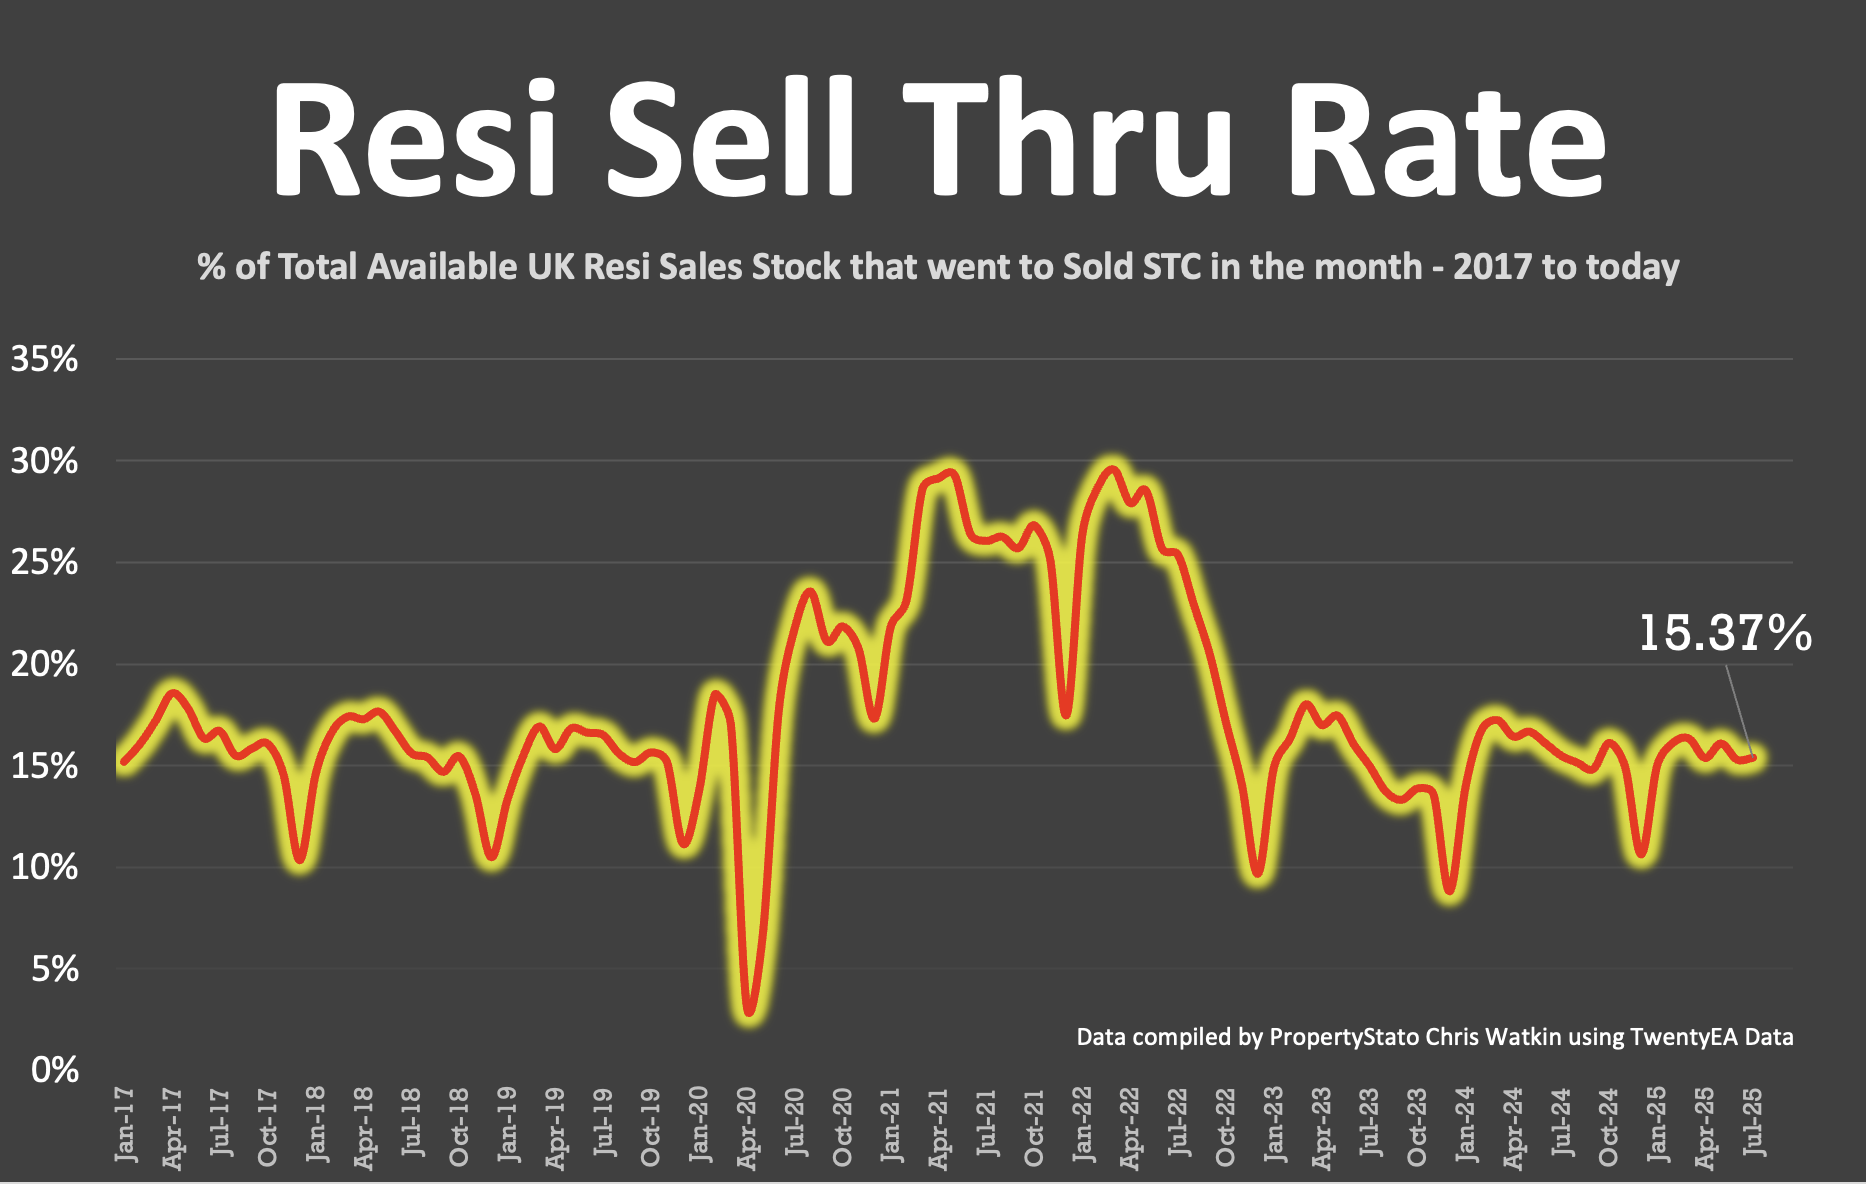
✅ Sell-Through Rate (July, in arrears)
15.4% of properties on the market went Sold STC in July.
Up from 15.3% in June. 16.1% in May
2024 average: 15.3%
8-year average: 17.9%
Takeaway – Sales are up, yet stock levels are up. Greater choice of homes for sale.
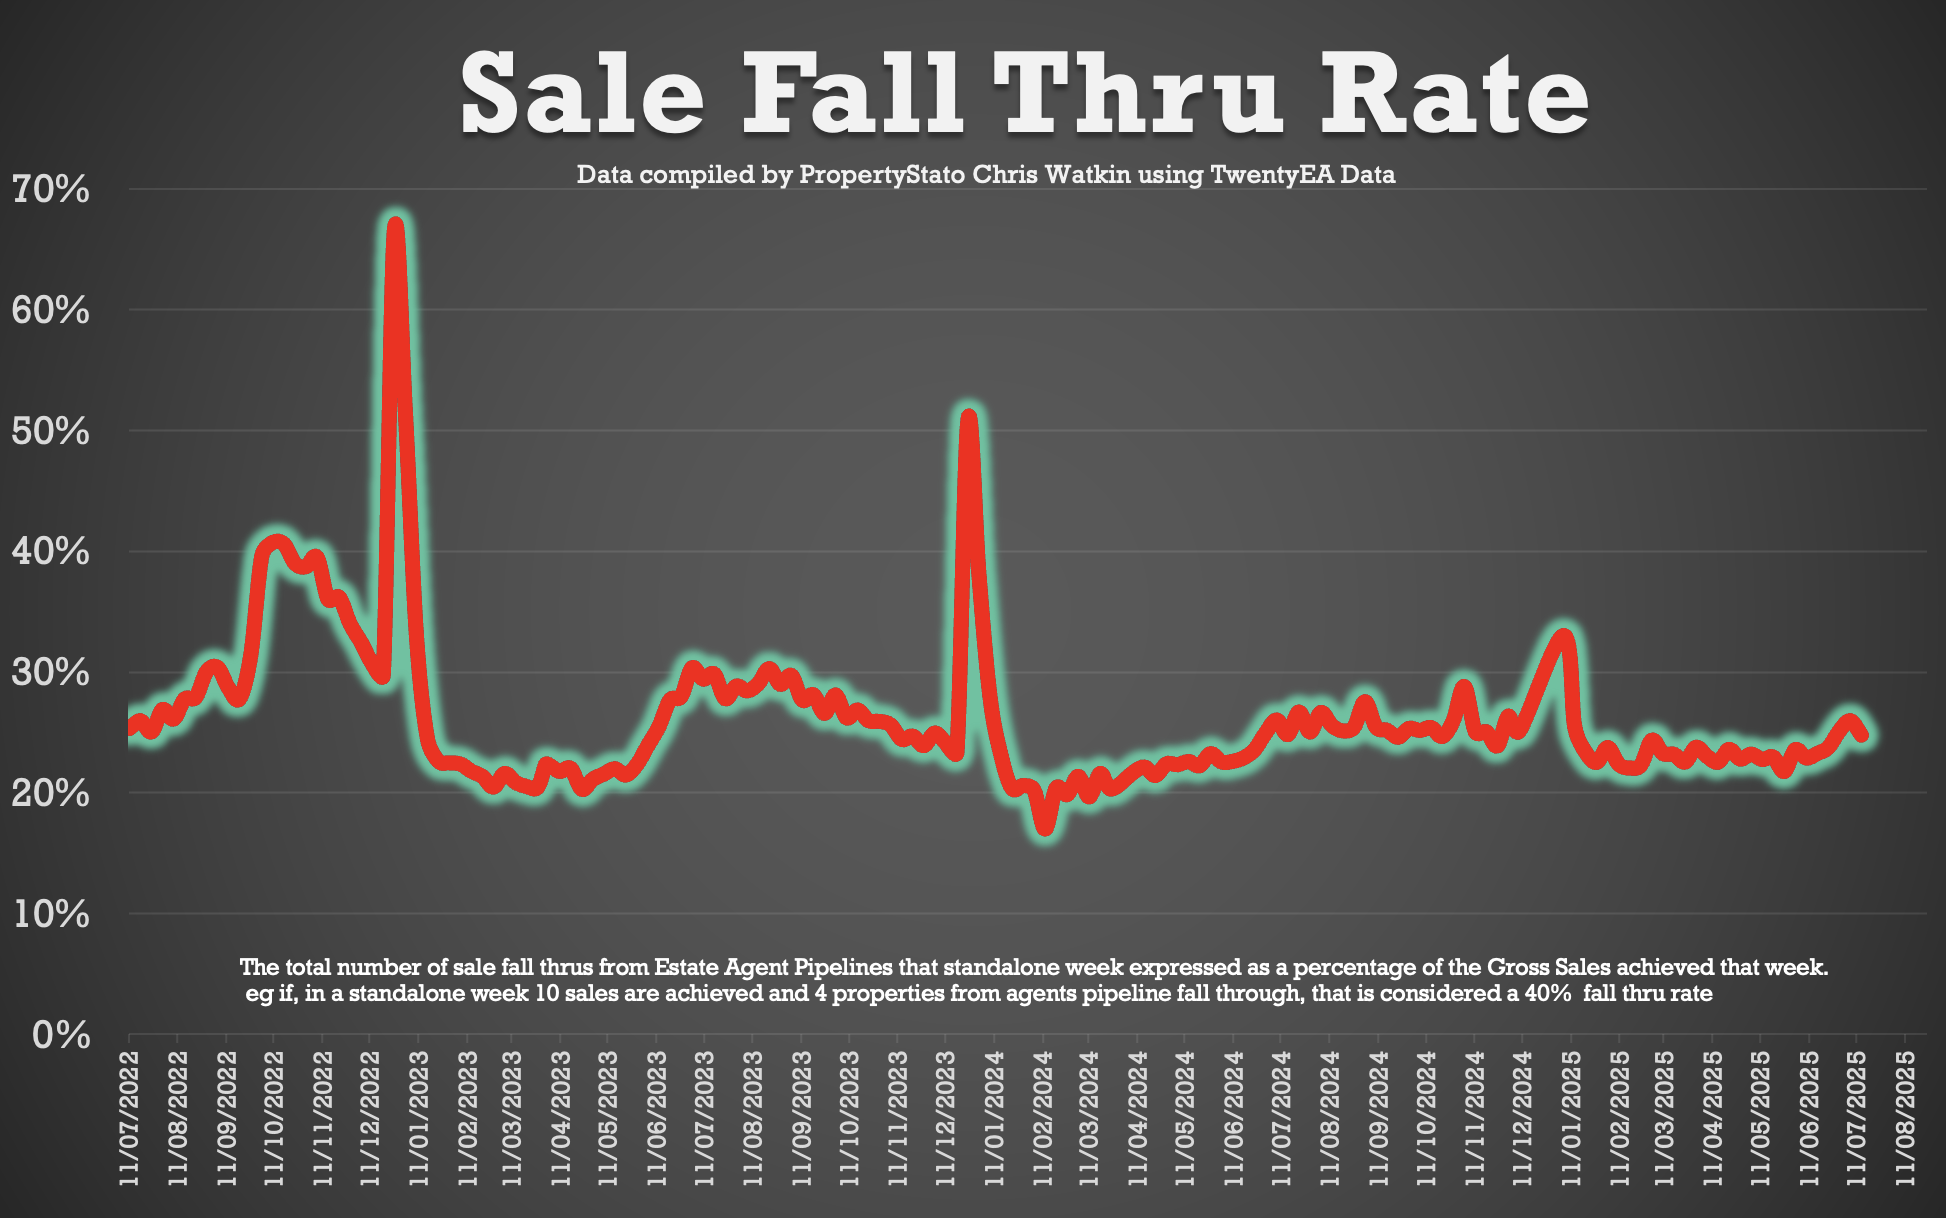
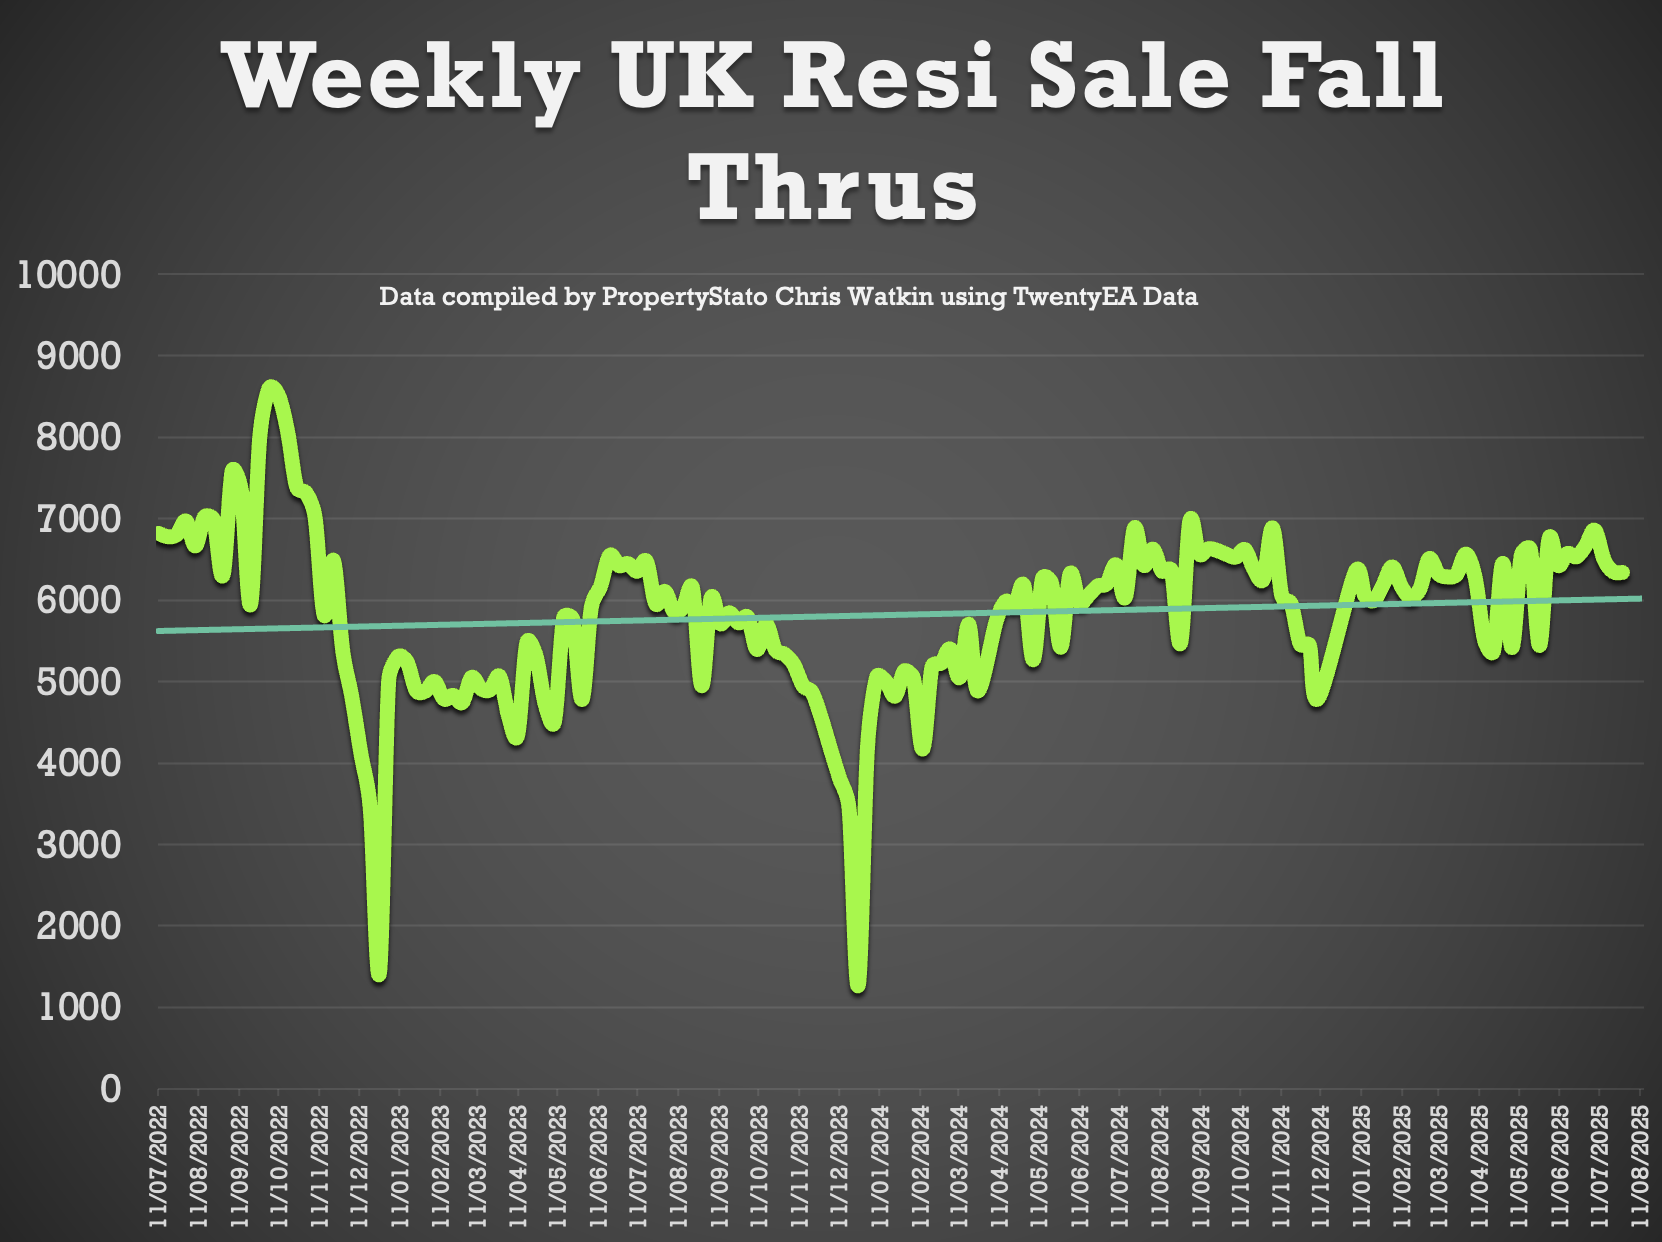
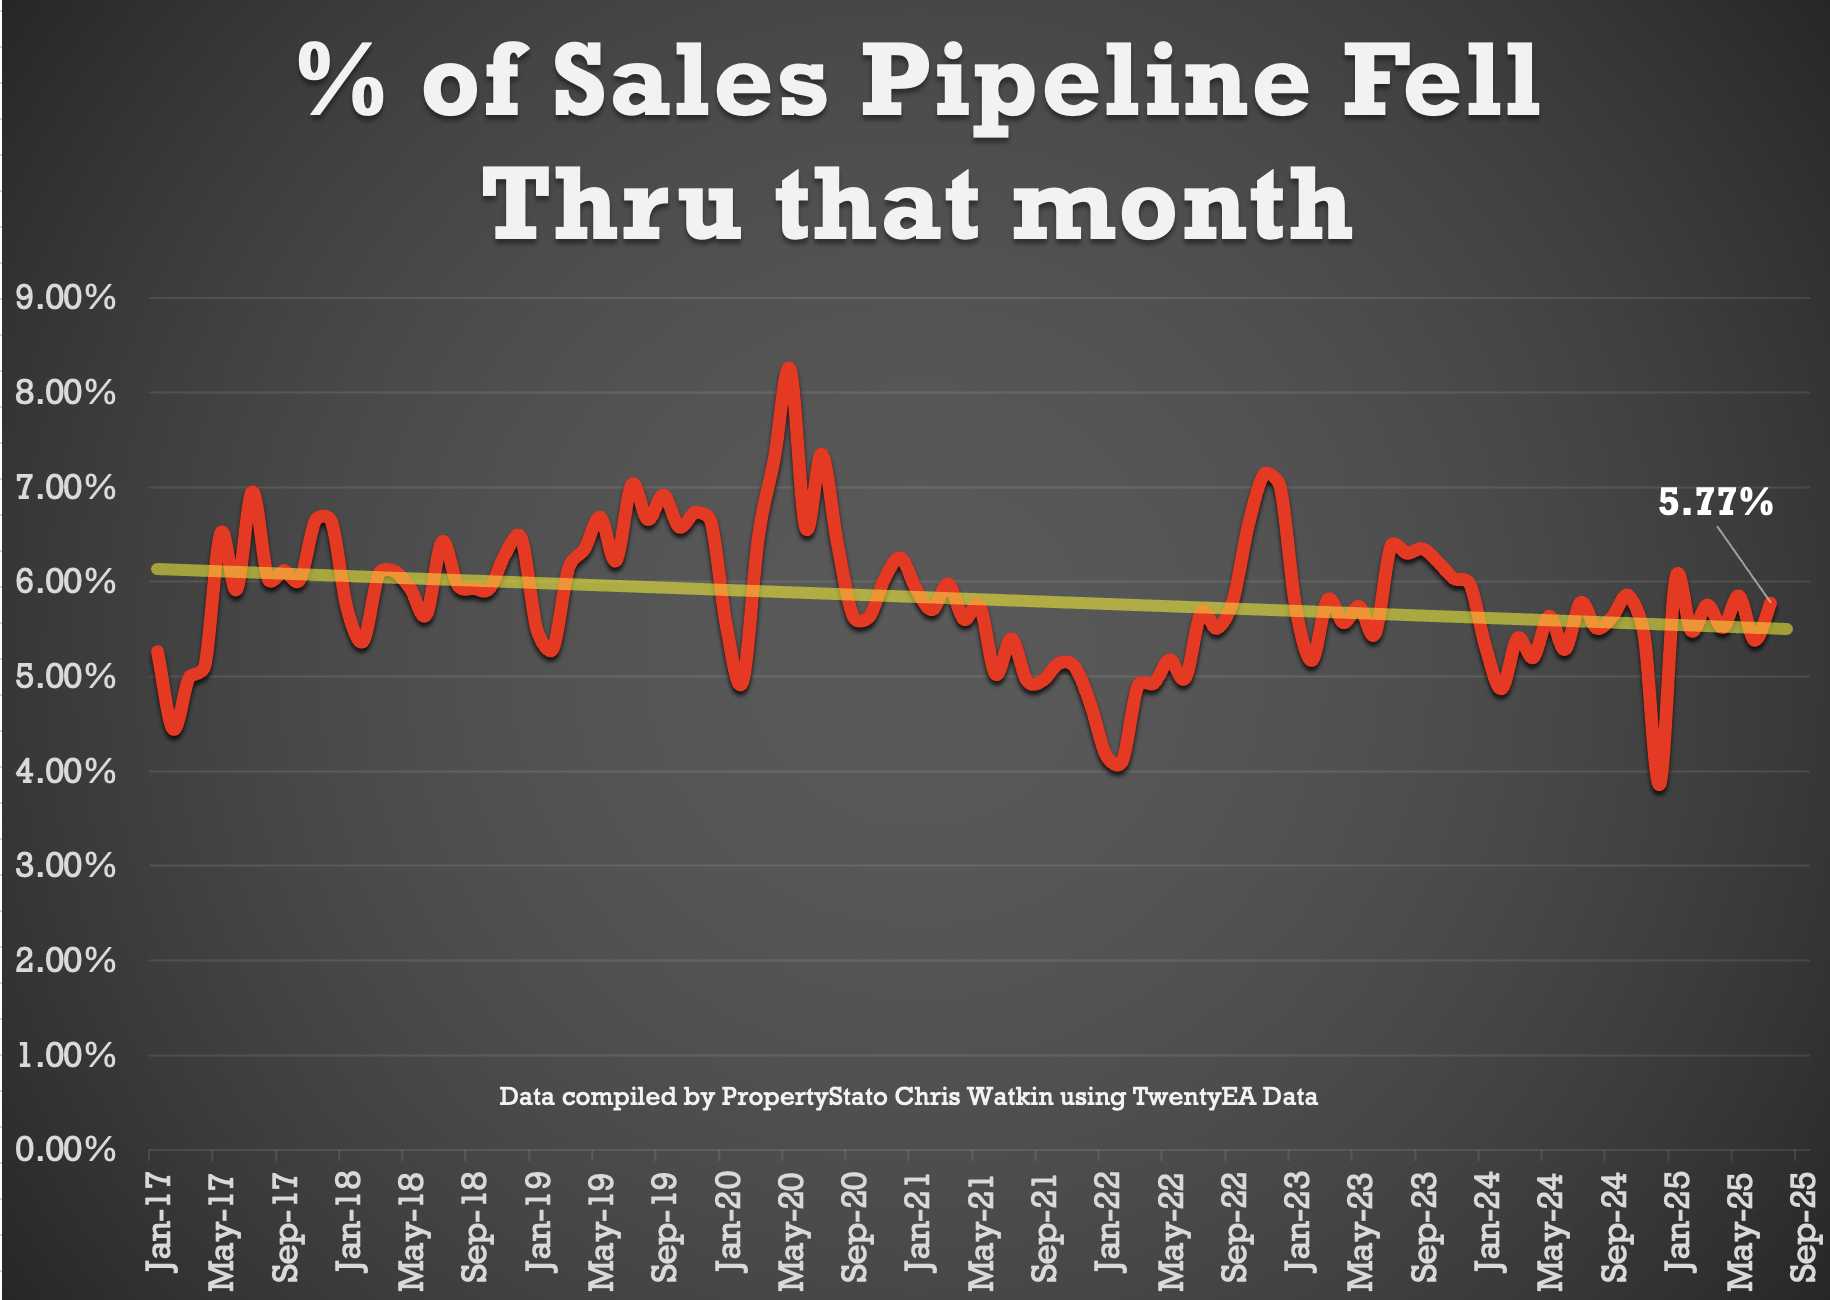
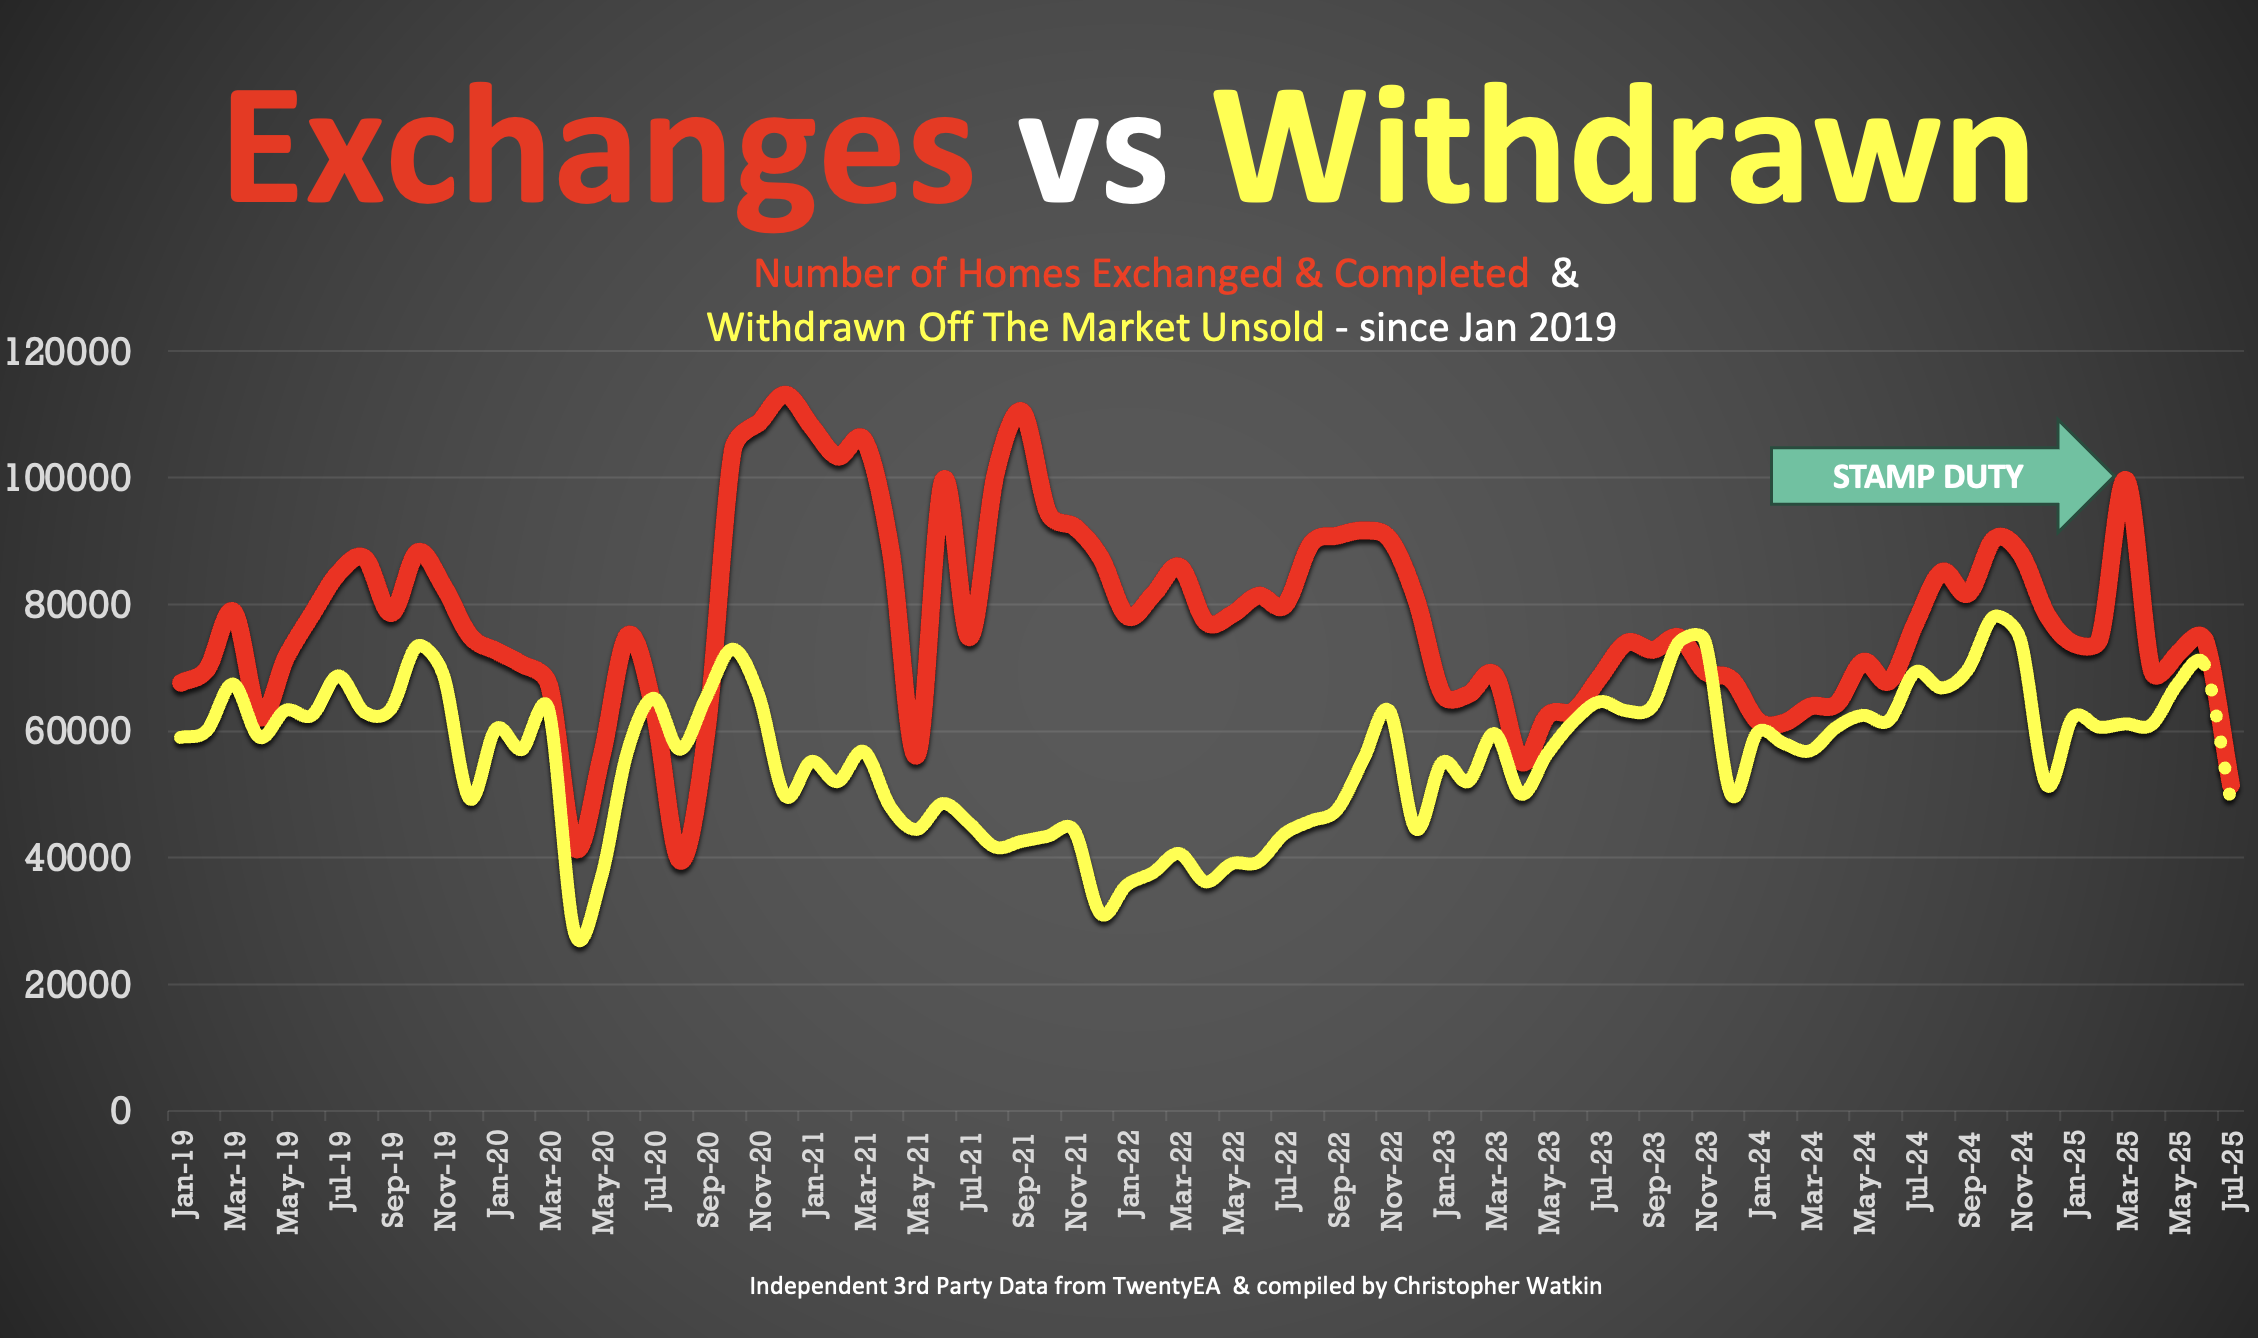
✅ Sale Fall-Throughs
6,337 fall-throughs last week (from a 512k SSTC pipeline (units)).
Fall-thru rate as % of gross sales: 23.6% (down from 24.4% last week).
Slightly better than the long-term average of 24.2%, and far below post-Truss chaos levels (40%+).
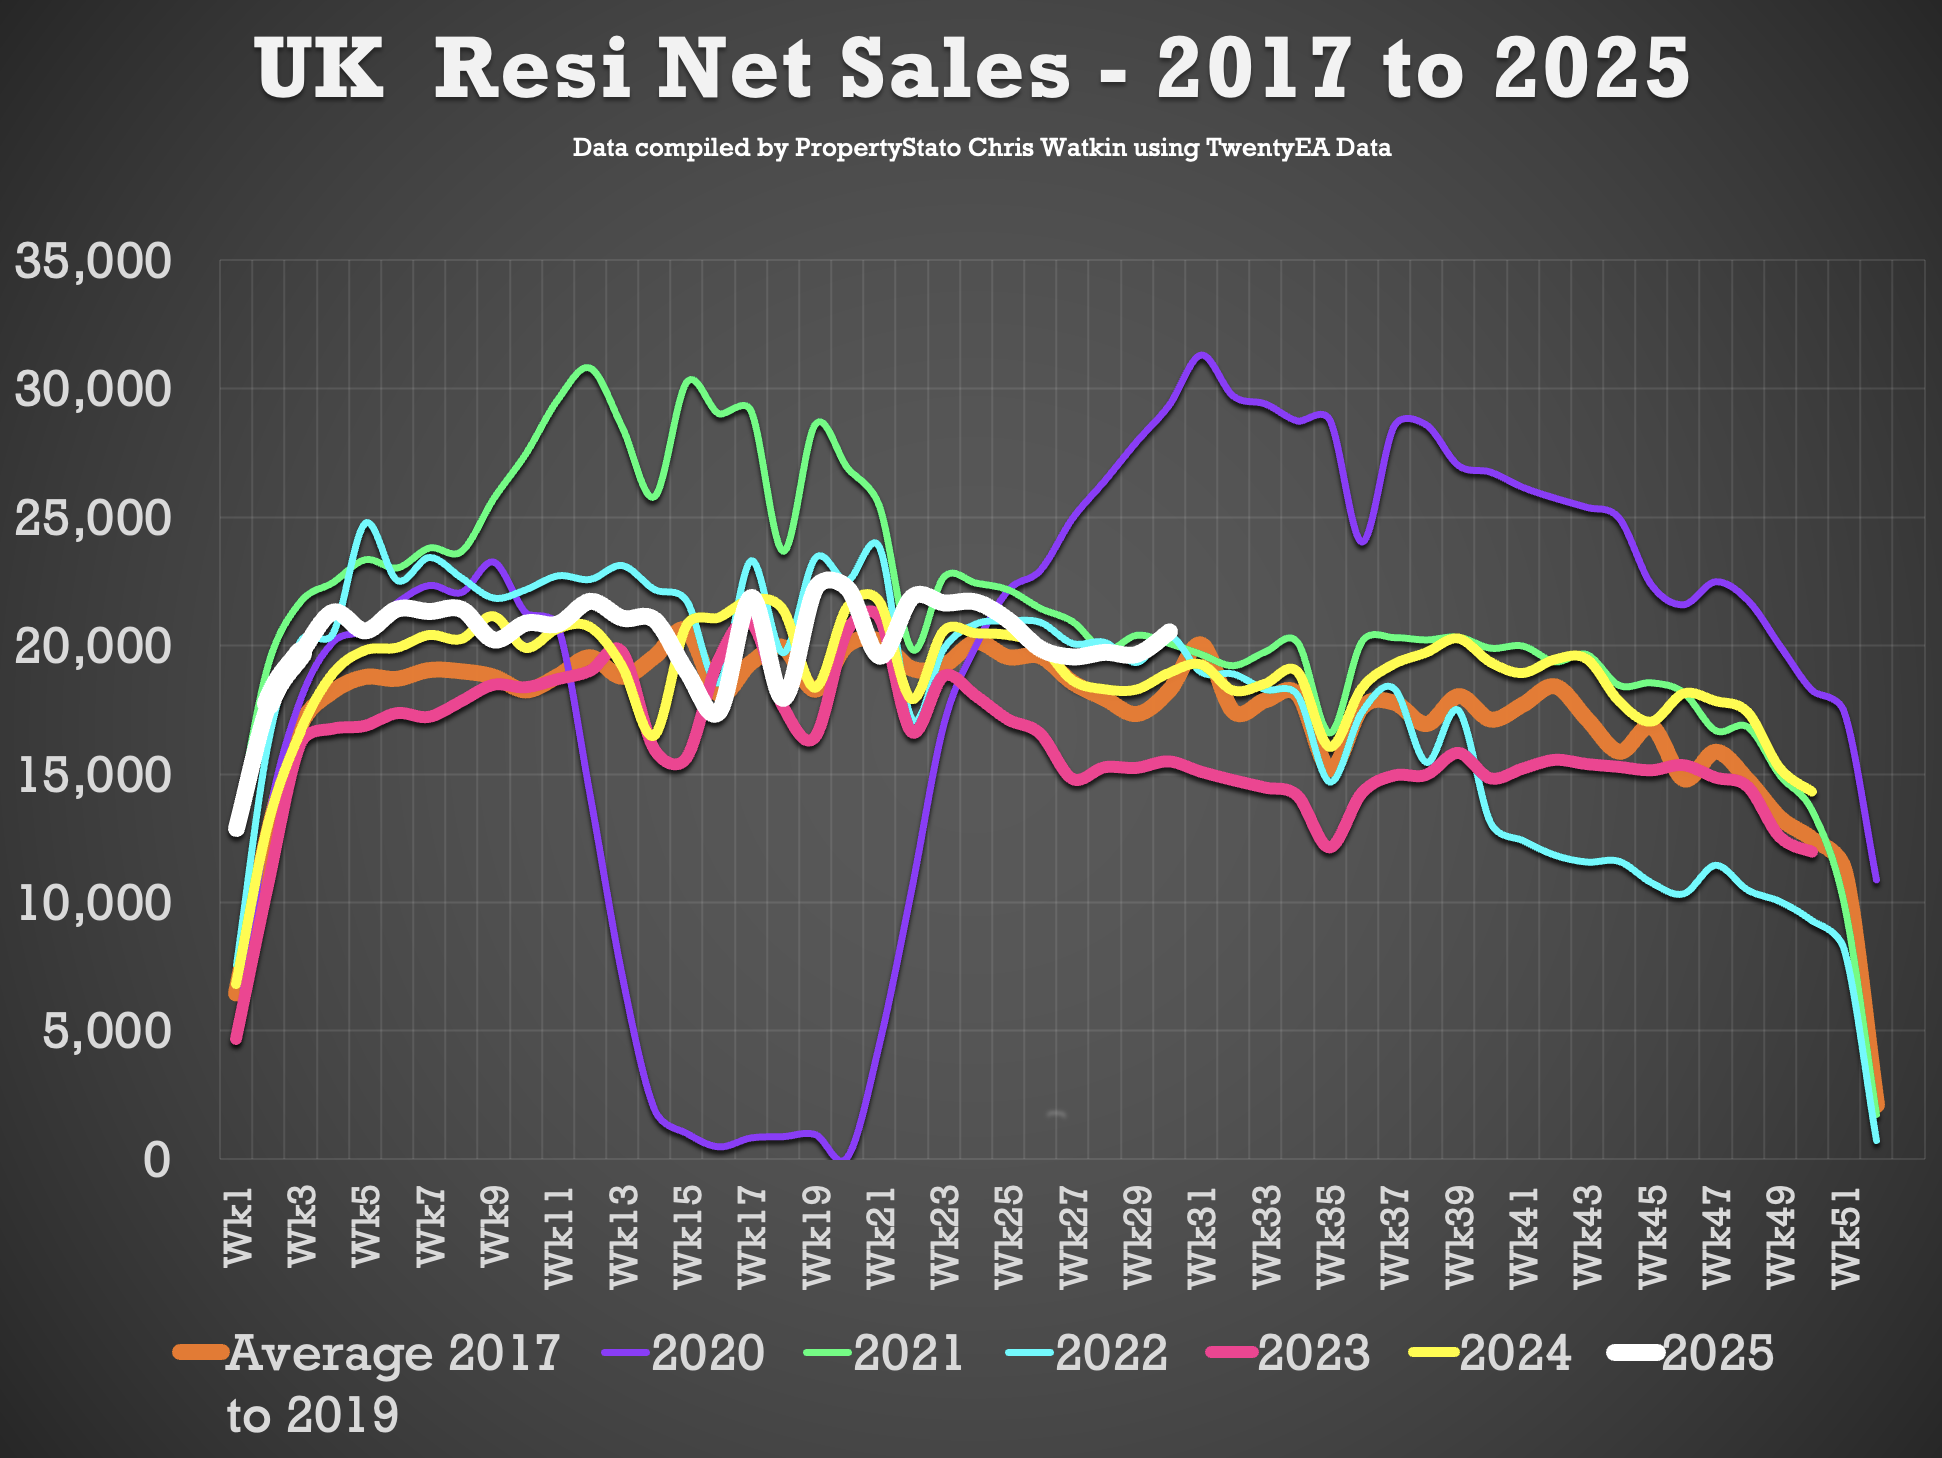
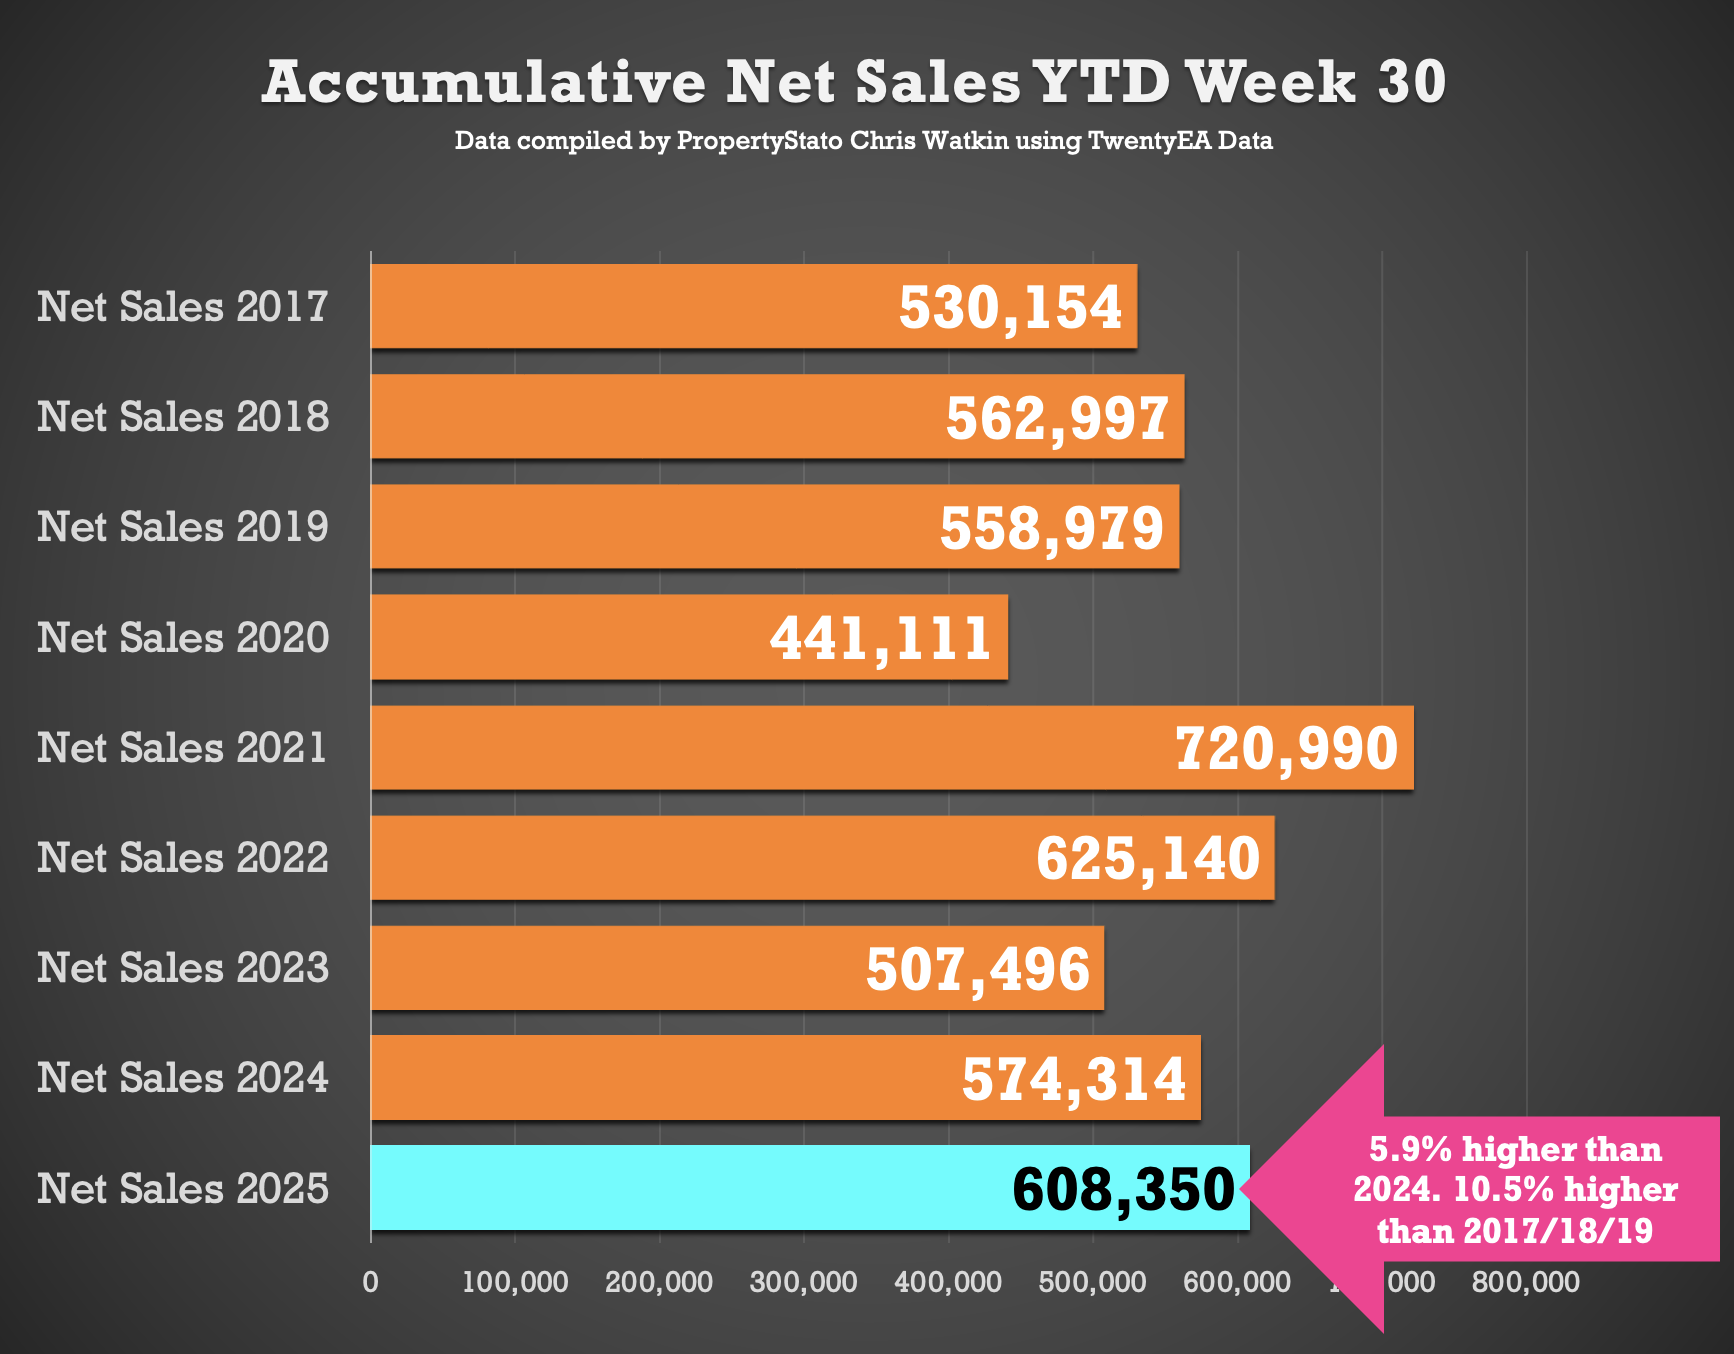
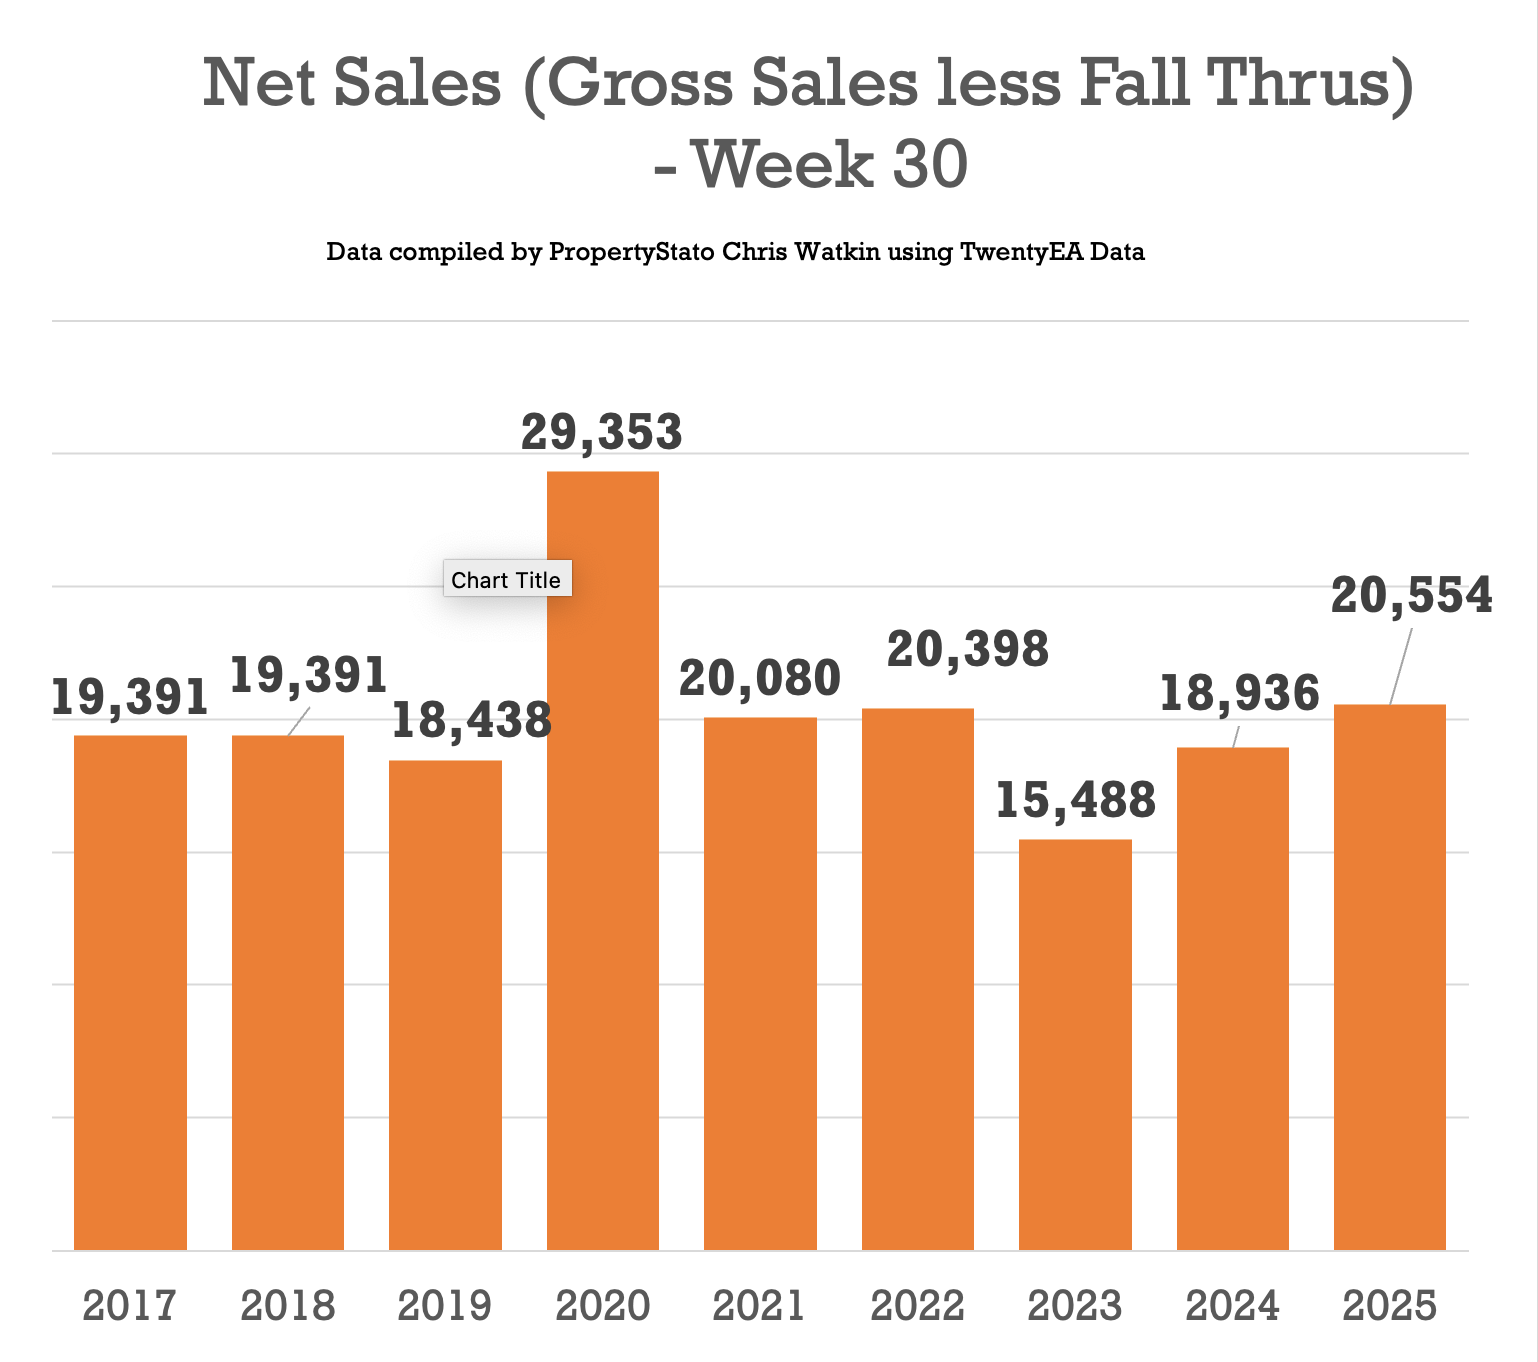
✅ Net Sales
20.6k net sales this week (Up from 19.7k last week)
Weekly average for 2025: 20k
YTD Net Sales: 608k in 2025 which is 5.8% ahead of 2024 YTD figure of 574k and 10.6% up on 2017–19 YTD (551k).
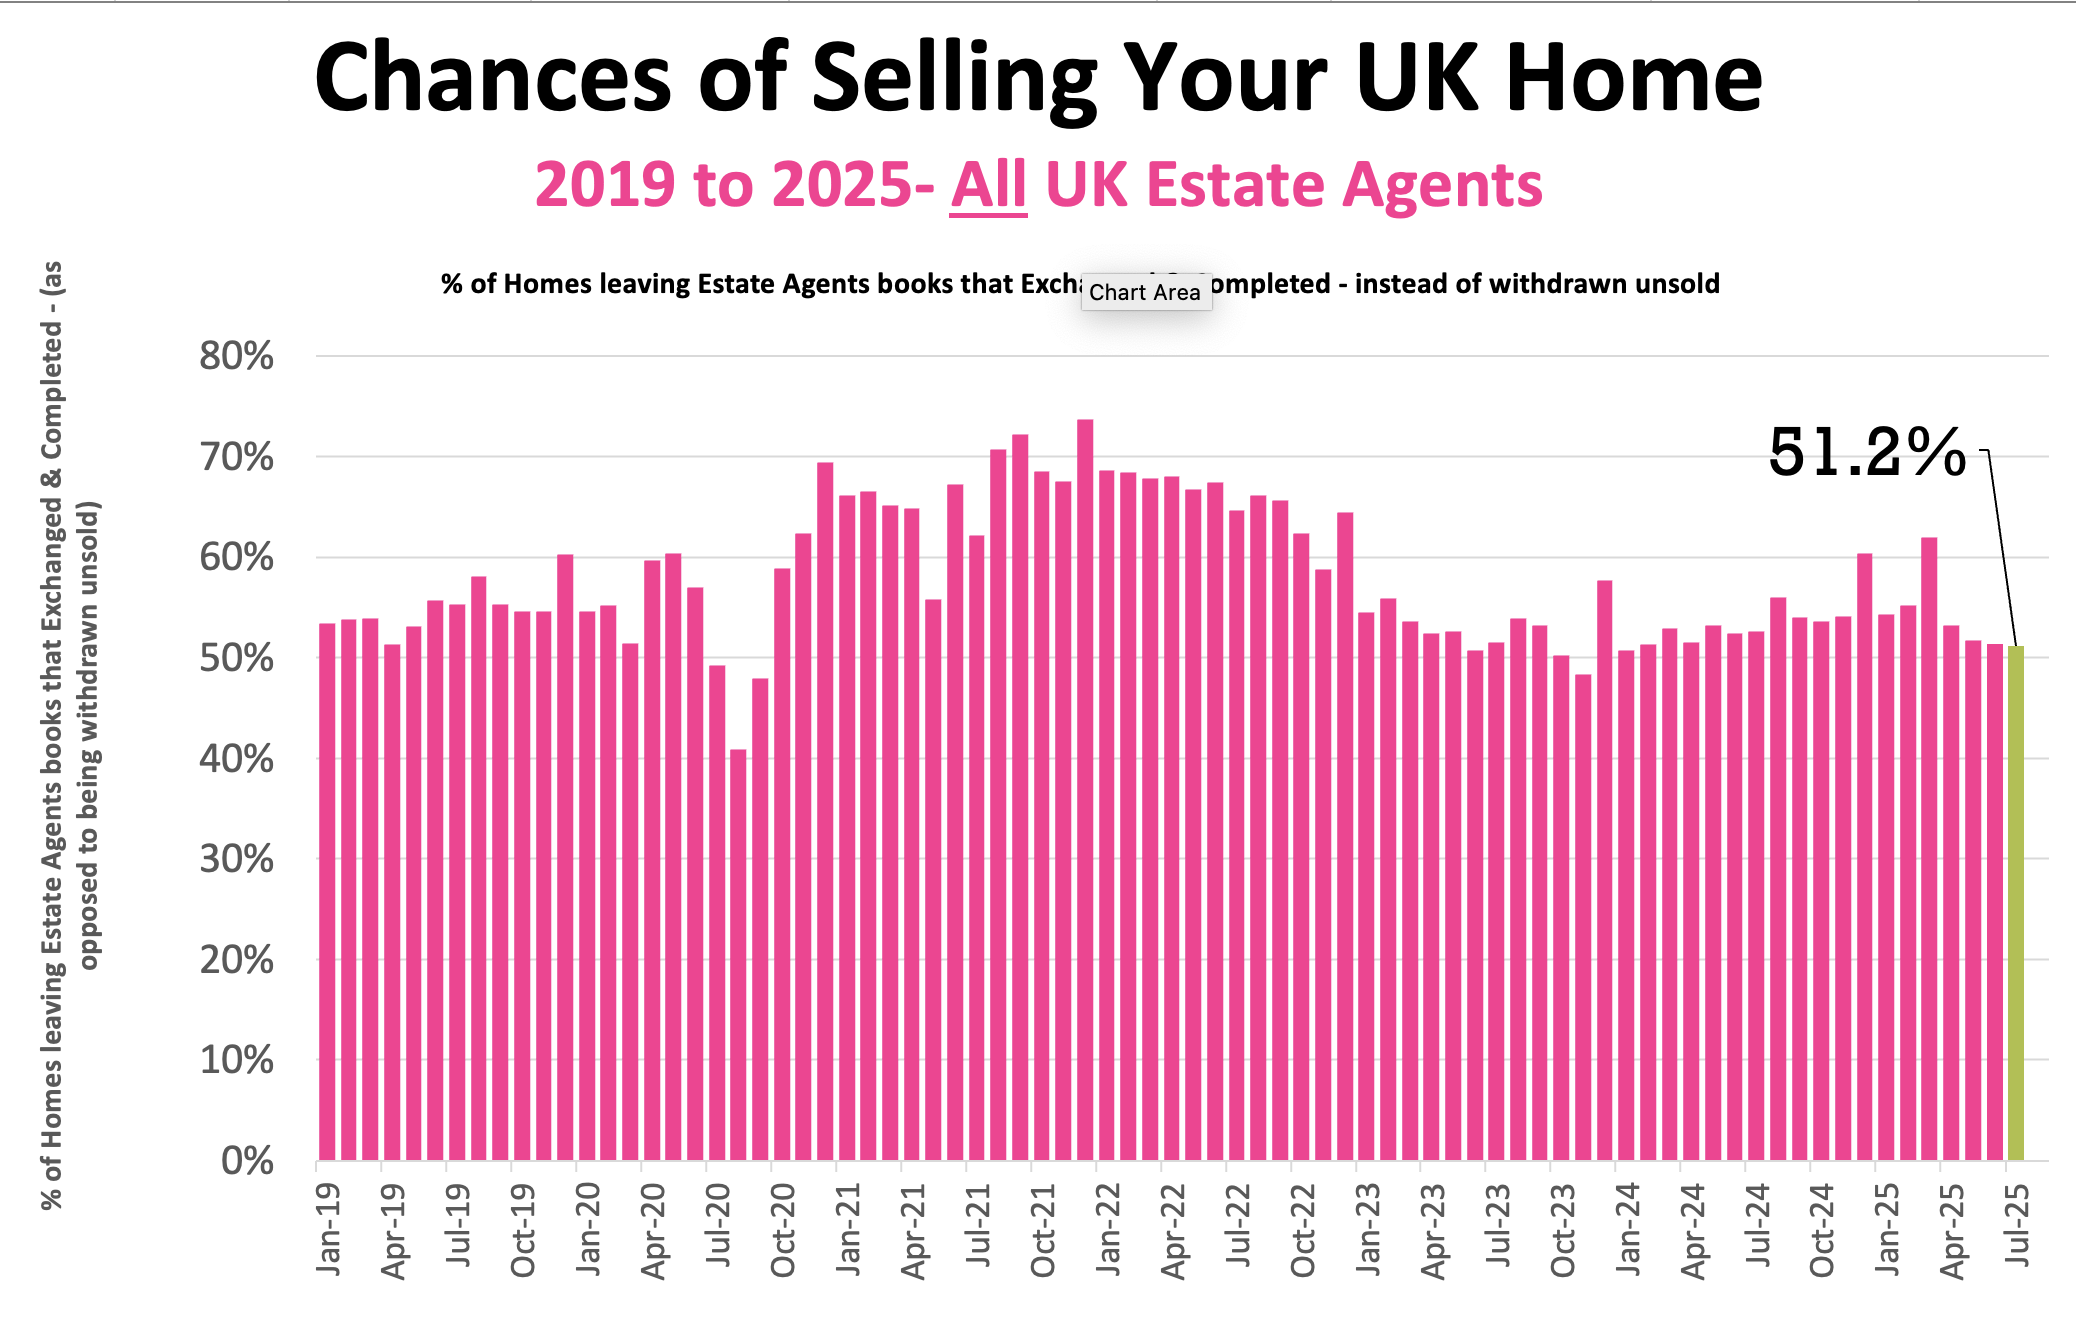
✅ % Chance the Home will Sell
July stats showed 51.2% of UK Homes that left the estate agents books in exchanged & completed contracts (ie the agent got paid and the home moved on completion), the remaining 48.8% left Estate Agent books, unsold and homeowner staying in their home.
Comparison
Jun – 51.3%
May – 51.7%
April – 53.2%
NB – this July stat will change throughout August as more data comes through.
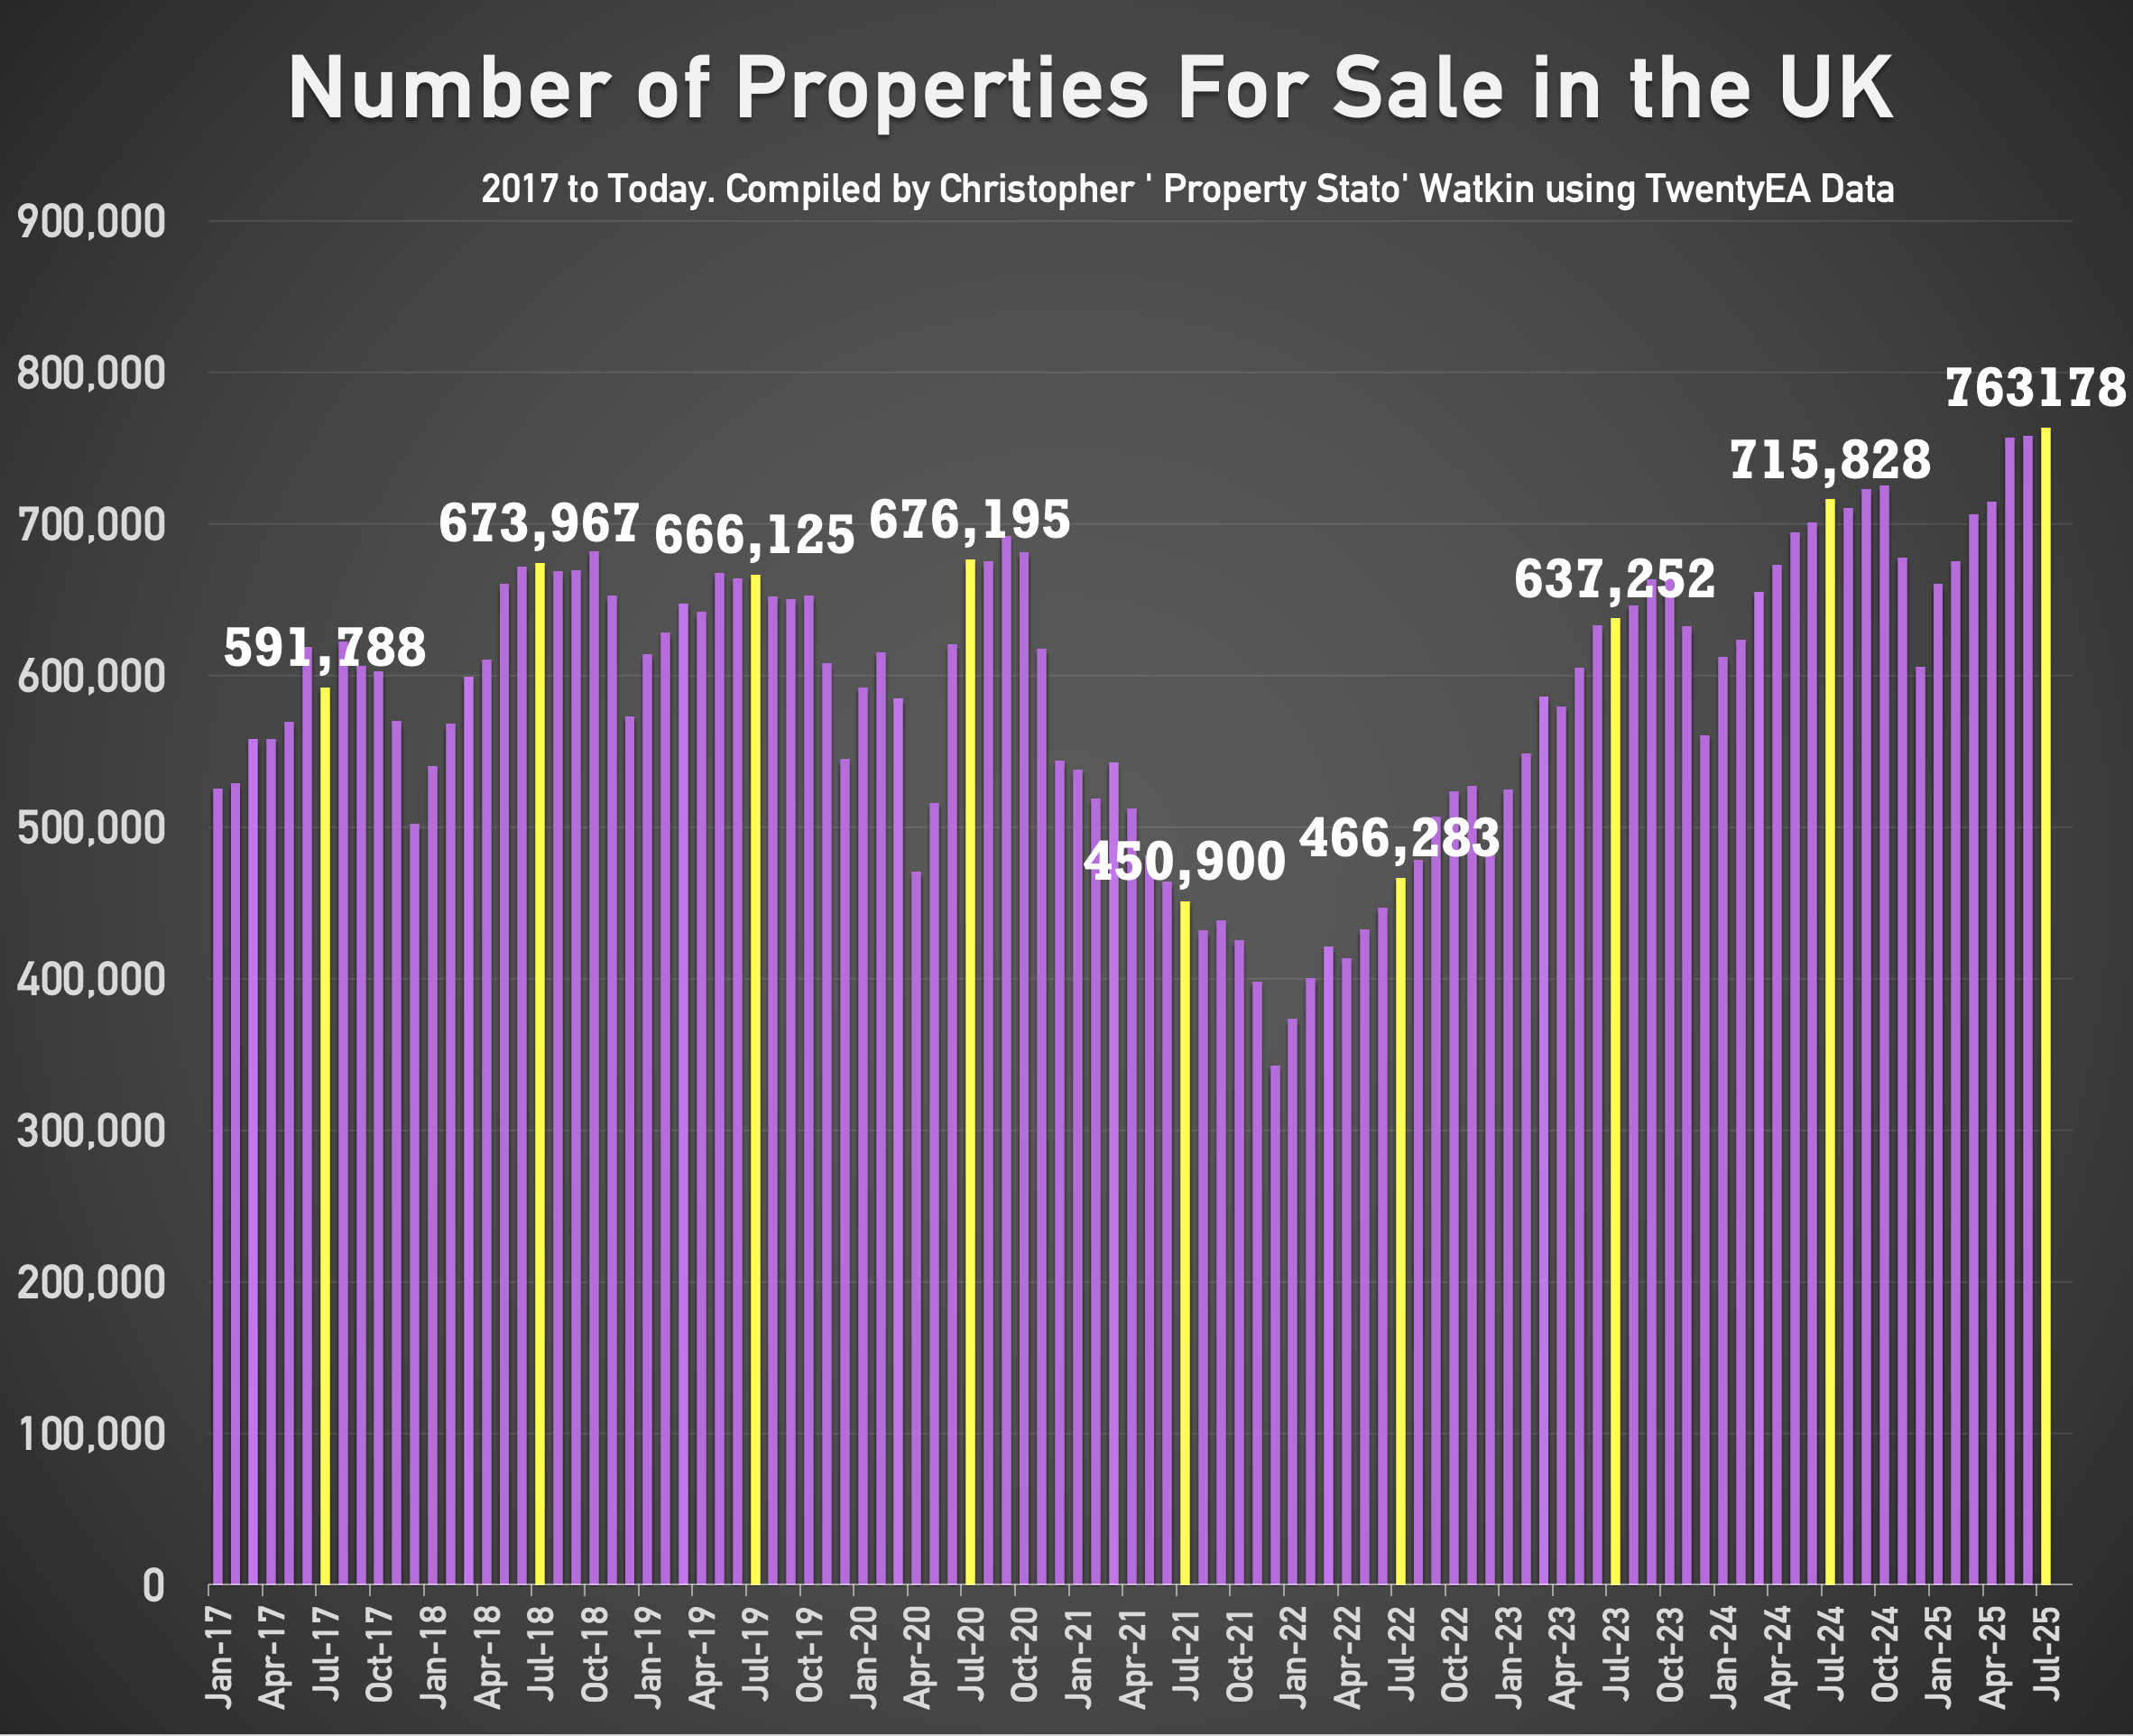
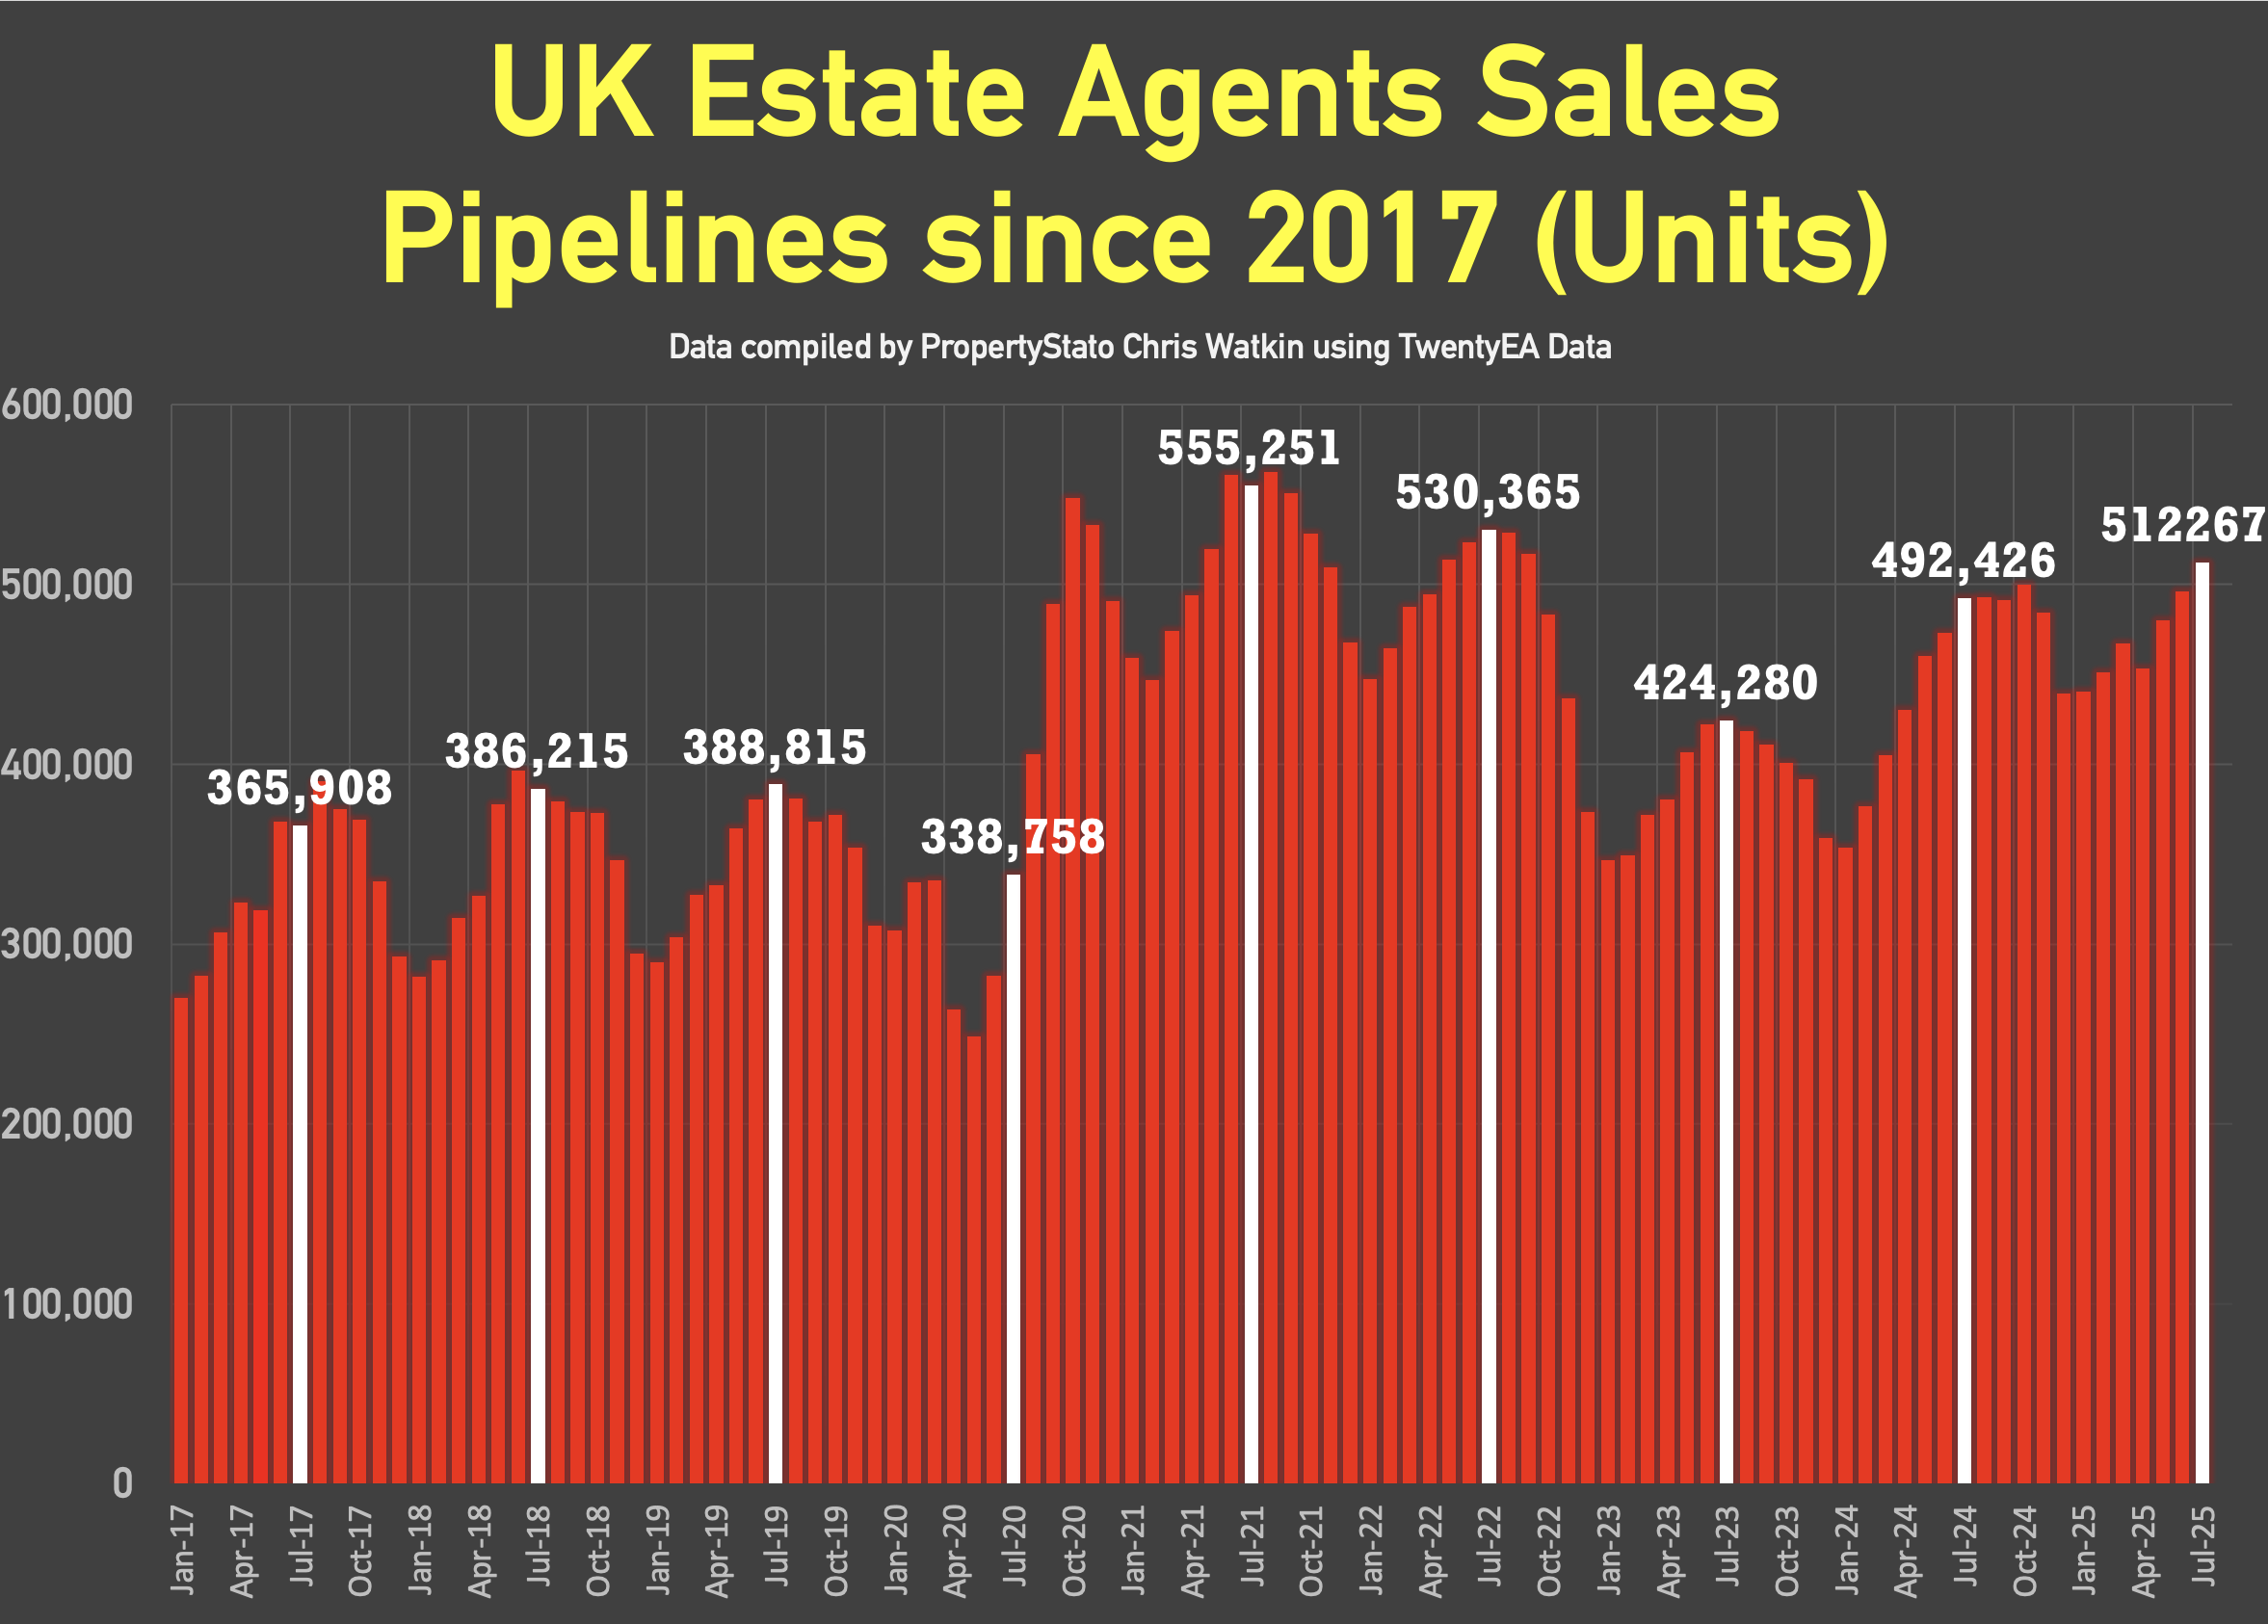
✅ Stock Levels (For Sale and Sales Pipeline) – 1st of the Month
763k homes on the market at the start of 1st August – 6.7% higher than 1st August 2024 (715k).
512k homes in Estate Agents sales pipelines on 1st August – 4% higher than than 1st August 2024.
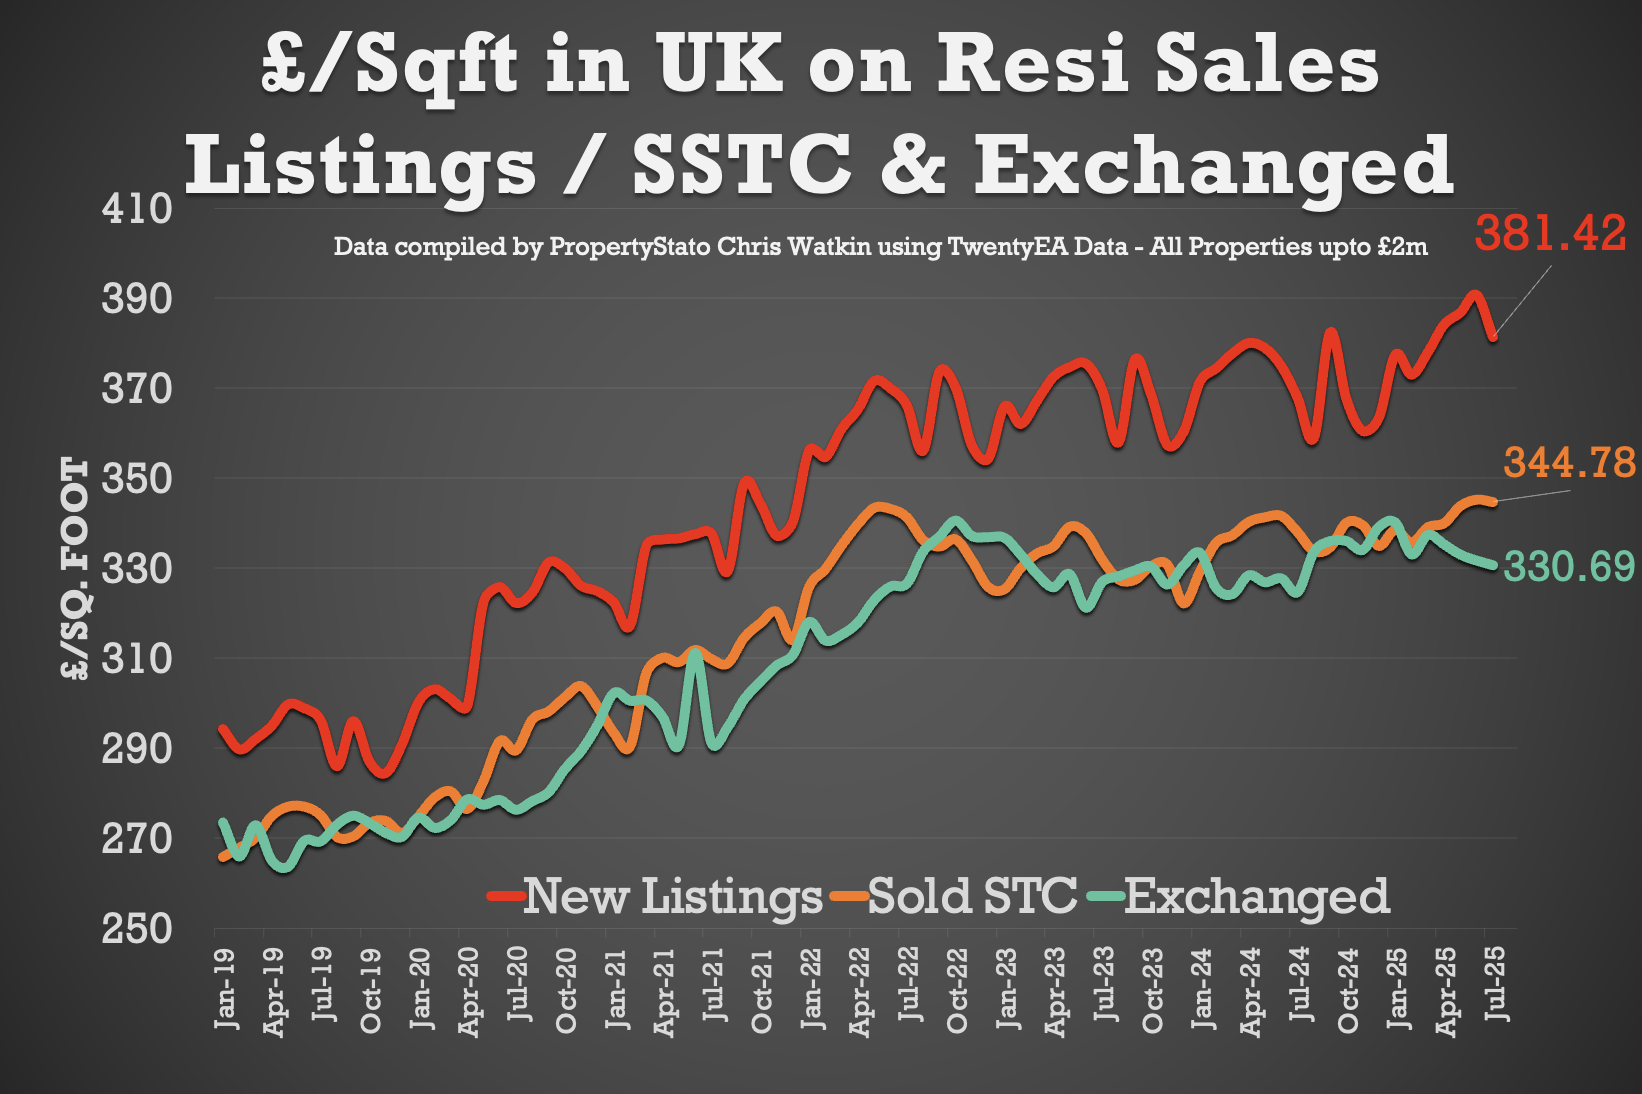
✅ House Prices (measured by £/sq.ft)
£344.78/sqft on Sales Agreed in July 2025 – 1.97% higher than July 2024 and 3.85% higher than July 2022.
✅ Rental Stats (in arrears)
July 2025 with an average rent of £1,876 pcm (July ’24 – £1,863 pcm)
(YTD 2025 average is £1767 pcm).
✅ Local Focus: Croydon
Why Should you Watch the Show?
Estate Agents, this show is designed for you.
From understanding the big picture market trends to translating them into actionable insights for your business, the Stat Show is your weekly must-watch.
Remember, in the survey of 10,000 homeowners last year with the Property Academy, 36% of homeowners chose their estate agent based on the estate agent’s property market knowledge. This show and graphs will help you
Read the orginal article: https://propertyindustryeye.com/whats-happening-in-the-uk-property-market-this-week-10/


