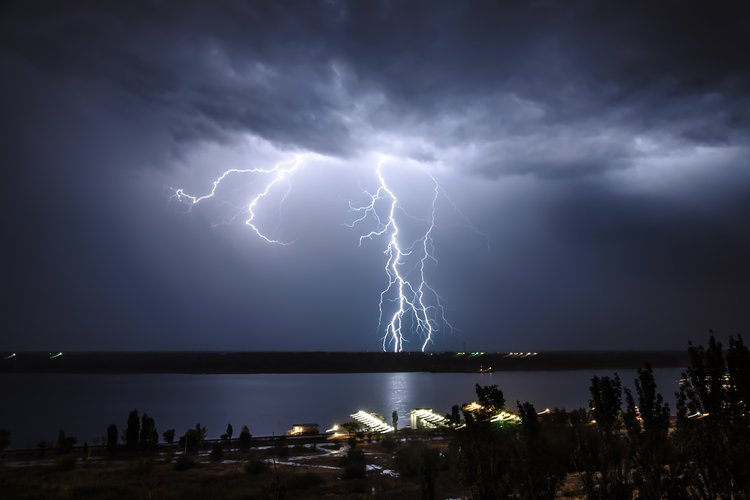
“Earlier on today, apparently, a woman rang the BBC and said she heard there was a hurricane on the way. Well, if you’re watching, don’t worry, there isn’t!”
These were the iconic words of meteorologist and weather forecaster Michael Fish on October 15, 1987. That night, the worst storm to hit South East England for three centuries crashed into the county, and 19 people died.
Whether Fish misspoke (he later stated he was referring to a hurricane in Florida at the time), or was making a poorly timed joke, the incident led to the coining of “the Michael Fish moment” – a forecast on any topic that turns out to be completely, and horrifically, wrong.
While Fish would presumably wish he could suck those words back up and into oblivion, never to have left his lips, the reality is that unless had superpowers, the responsibility of weather forecasting did not solely lie on his shoulders. In fact, the weather gods of today are supercomputers, whirring machines handling quadrillions of calculations a second. These numbers are set to grow further as more compute power is added, giving meteorologists a more detailed picture than ever before.
Human meets machine
Prior to our reliance on supercomputers, responsibility for weather observation and forecasting lay with human ‘computers.’ As depicted by Andrew Blum in his 2018 book The Weather Machine, weather reporting in the US during the mid-1800s relied on the newly installed 2,100 plus miles of telegraph lines.
Telegraph operators in various cities would communicate with one another what the weather was like in their respective locations. Because the lines worked poorly in the rain, if communication was unavailable, there was a reasonable expectation that somewhere along that line it was raining.
Though a rudimentary approach to weather forecasting, this limited data could provide a basis for assumptions about storms that may or may not be approaching.

Building a submarine cable through the North Pole
By the late 1800s, Norwegian physicist Vilhelm Bjerknes had begun to realize that there was also a mathematical basis for the way weather behaved. His first hypothesis argued that, in circumstances where pressure and densities are unequal, they will battle against one another until they become more balanced. Dubbed ‘Circulation Theorem,’ the hypothesis could, in theory, predict the direction and intensity of that circulation.
Once tested on meteorological data, Bjerknes’ idea proved to have legs, and he refined it further. Bjerknes has been credited with the founding and formulating of many of the equations that are still used today in numerical weather prediction and climate modeling.
These calculations were still made by human computers for a long time, and the sheer complexity of the parameters meant that truly meaningful forecasting was limited – predictions often took longer to formulate than the weather did to emerge.
In 1922, English mathematician and physicist Lewis Fry Richardson estimated that a global workforce of 64,000 human computers would be necessary for a global forecast. As he wrote at the time: “The scheme is complicated because the atmosphere is complicated.”
It wasn’t until 1950 that computers as we think of them today found their role. The Electronic Numerical Integrator and Computer (ENIAC), the first programmable computer, was used for the first forecasts. ENIAC was made up of 18,000 vacuum tubes, and 1,500 relays, as well as hundreds of thousands of resistors, capacity, and inductors. In total, ENIAC was capable of around 5,000 calculations per second. The first calculations for a 24-hour forecast on ENIAC took the machine almost 24 hours to produce – not exactly practical.
But, as computers have become more powerful, forecasting has become more accurate and timely.
The global scope of the problem
It is easy to think of weather as just what is outside of your window at any given time, but the reality, says David Michaud, is much more complicated.
“You can almost think of the atmosphere as a fluid – it needs to be continual,” explains Michaud, director of the Office of Central Processing at the National Oceanic and Atmospheric Administration’s (NOAA) National Weather Service.
“You have to view the forecast in a global context. We need observations from all around the world to create that global forecast, and that can then create boundary conditions for smaller, higher fidelity, and higher resolution models.”
As Michaud puts it, if the weather comes from the East Coast and moves to the West, “there isn’t just a void behind it.” Even if you are just looking for a regional weather forecast, you still need to be able to fill it in from a global scale model.

To work effectively within these conditions, meteorological services across the world collaborate and share observations.
“We have agreements and standards around the way that we share data and format data. So each government agency or entity around the world has its own platforms, and then all that data is shared,” says Michaud. “All those observations are constantly flowing and we have sharing agreements so that we have this continuous set of information coming in.”
This was reiterated by Alan Hally, scientific lead of the AI transformation team at Met Éireann, Ireland’s meteorological institution. He notes that national meteorological services share data via a global transmission system where observations are collected in different global centers, and then distributed to all the regional offices.
“Recently, we had the tail end of Hurricane Kirk that transitioned across the Atlantic and impacted parts of Europe,” Hally says. “When those things occur, we have conversations directly with the National Weather Service, specifically the National Hurricane Center in the US, because they have responsibility for those types of weather events.
“Then, as it was going to impact France and possibly the UK, it would have been a collective call between all of those countries to discuss where the hurricane is most likely to move.”
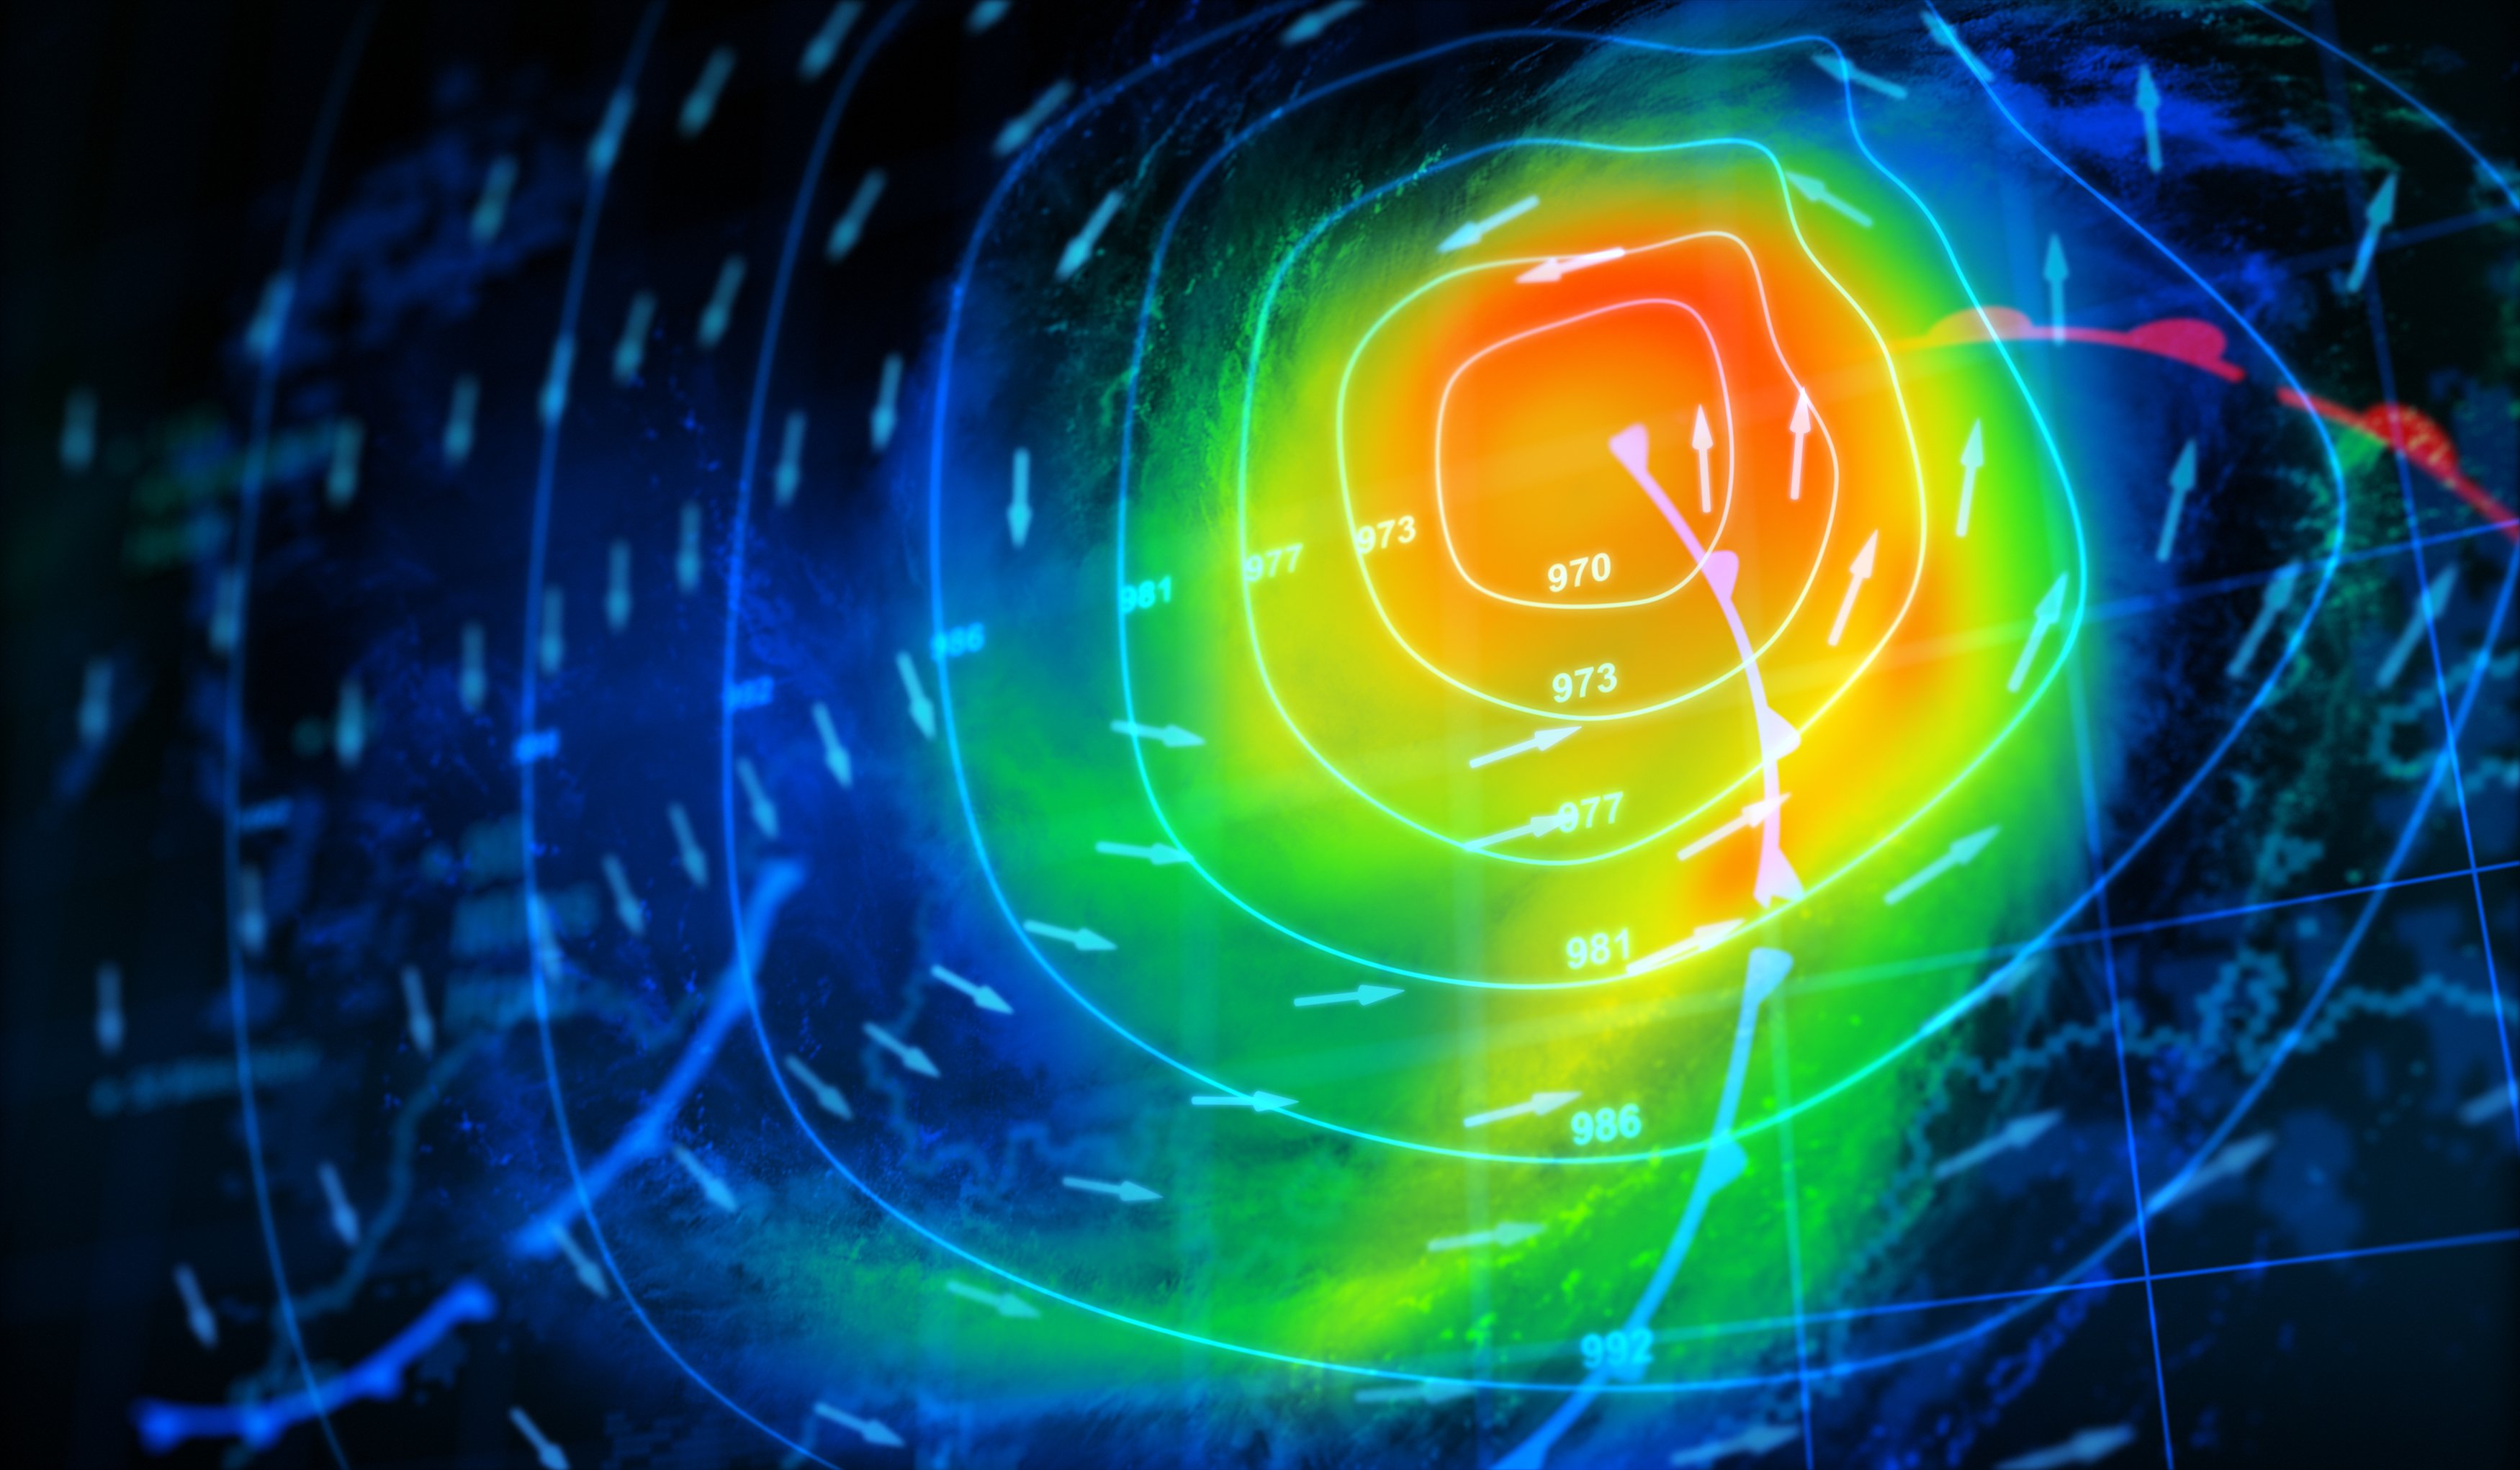
In the case of an approaching hurricane, the conversations would surround the simulations created using Numerical Weather Models – the models that underpin our understanding of the atmosphere. However, for those simulations to be created and interpreted, data must first be collected.
Observing the atmosphere
Weather observations are made from a variety of platforms and instruments, Michaud tells DCD, and those methods cover every layer of the atmosphere – from the ground, to in the air, to out of the air in space.
Satellites – both GEO and LEO – contribute significantly to the gathering of weather data. “There are various instruments that exist on each satellite platform that can look at different things – different wavelengths and with different parameters,” he says. “It’s not just a camera that looks at the clouds. You can actually profile through a vertical in the atmosphere and get information at different layers with a satellite.”
Beyond satellites, observations are also gathered from weather balloons, which have been used for the past 150 years and are still released twice a day, every day, from around 900 locations globally. The balloons reach heights of around 20 miles – twice that of airplanes – and sensors on those balloons measure elements such as temperature, humidity, wind, and atmospheric pressure.
“We even have sensors from airplanes, so as a plane takes off, they’re taking weather observations through the atmosphere,” adds Michaud. Observations are also taken from ships. Then there are radars “looking up from the surface,” Michaud says, adding: “All of that is brought in, and then you have to quality control it because now you have to make that initial condition a continuous state.
“If you have one bad sensor out there, that’s reporting a temperature of 500 degrees or something like that, you need a way to figure out how to throw out that observation so that it doesn’t create these hotspots and this discontinuous environment.”
The scale of the challenge facing Michaud and his colleagues around the world is hard to take in. At its most fundamental level, calculating the weather is a computational fluid dynamics (CFD) problem, but one that covers the entire globe.
The atmosphere has to be broken down into three-dimensional segments, with each segment impacted by those surrounding it. Nothing can be viewed in isolation.
Numerical weather models typically run on either spectral spacing or grid spacing, explains Michaud. In the case of grid spacing – which is perhaps more simple to understand – values have to be associated with each grid point, but that is not always possible. Planes and ships move, and not every surface has an observation at that point.
“You have to find ways to extrapolate all that. There can also be sparse areas where you don’t have a lot of observations, and you need to be able to fill that in. So to create that initial condition, you take all those observations in, and then you can look at a previous forecast and then fit the observations to that forecast,” says Michaud.
“You quality control against other observations and previous forecasts to get a continuous atmosphere as your initial starting condition.”
From the initial starting condition, meteorologists move incrementally forward in time through the physics-based equations that predict the weather.
“One thing we do with our models is take an initial condition and perturb it in many different ways, and then run the same forecast out from different initial conditions,” Michaud says. “We call that a model ensemble. If you look at all the models and they are tightly coupled, you have pretty high confidence, but then the more they diverge, the lower the confidence,” he explains.
But, Michaud acknowledges that “ensemble modeling is another way to chew up computing cycles.”
The direct correlation between more compute and better forecasts
National weather services are continuously expanding their compute capacity to better serve weather forecasting.
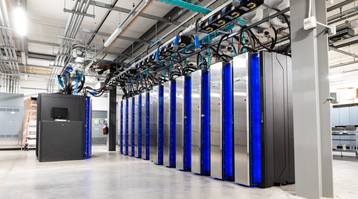
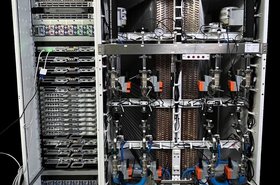
NOAA completed an upgrade of its Weather and Climate Operational Supercomputing System (WCOSS) in the summer of 2023, giving it twin supercomputers each with 14.5 petaflops of computing capacity, an increase of 20 percent compared to the previous solution.
Met Éireann also recently launched a new supercomputer in collaboration with Denmark, Iceland, and the Netherlands dubbed “UWC-West.” The supercomputer is housed in the Icelandic Met Office data center and, according to Hally, the collaborative approach delivers “more bang for our buck.”
“By pooling the resources of each country, we were able to purchase a supercomputer that was more powerful than any one country could on its own,” he says. “It’s also a pooling of expertise. So each of the four institutions has expertise in different areas of numerical weather modeling, so we can bring all of that expertise together.”
Hally adds that housing the computer in Iceland, with its cool temperatures and abundant clean energy, means it is carbon neutral, and runs on 100 percent renewable power.
“Better” forecasts are provided in a variety of ways. The new UWC-West supercomputer pales in comparison to NOAA’s machines – UWC-West can manage 4 quadrillion calculations per second compared to its US counterpart’s 27 quadrillion – but the upgrade has still made a significant difference to Met Éireann’s forecasting.
“The numerical weather model we would have previously run on our supercomputers would have been updated eight times a day – so every three hours. The new supercomputer allows us to update the model every hour,” Hally says.
Hally also draws attention to the issue of ensemble models – the importance of them, and how they necessitate more computation.
“When you do numerical weather modeling, you don’t just do one simulation of weather, you do many of them,” he explains. “This is to account for natural uncertainty – things like chaos and the butterfly effect all come into it. There is a natural inherent uncertainty in weather forecasting, you have to do many simulations in order to capture all of that. “
Previously, we were doing 15 different simulations every three hours. But now we’re doing 30 different simulations.”
More computational power can also improve models on a resolution level. Reducing the grid spacing provides a greater level of precision in forecast outcomes, but it also complicates the process.
As Michaud puts it: “Let’s say you double the resolution – from a 30km to 15km model by grid space. That’s not just double the computing – you are doubling in several different directions. So instead of double, you could need more like 16× the computing capacity.”

Additional detail can be added to a model by introducing elements such as ocean components, or new cloud physics – both of which add physical complexity to an already physically complex model.
All of this – the initial observations, and then the simulations derived from the models – creates astronomical amounts of data, all of which has to be stored.
Housing the atmosphere
The European Centre for Medium-Range Weather Forecasts (ECMWF) has one of the largest stores of atmospheric data in the world.
Approaching its 50th birthday, ECMWF has been running operational models since the end of the 1970s and, according to Umberto Modigliani, its director of forecast and service development, has been archiving all the forecasts it produces both operationally and for research purposes.
“The size of that archive is around one exabyte,” he says. “It’s one of the largest archives of meteorological data in the world.”
Not only are the forecasts looking towards the future, but extensive amounts of effort are put into re-analysis – or reproducing the situation of weather in the past. According to Modigliani, they have been running these sorts of forecasts from around 1940.
“The data produced a long time ago is still relatively small in size because, at that time, the computing resources were not as powerful,” he says. “They were using one of the first Cray systems which, in comparison to what we use today, had a lot less power. The first one, ECMWF, had around 16 CPUs.”
Modigliani says the bulk of the archive has “been produced more recently.” He explains: “Typically, what we run right now operationally is a global model with a resolution of around 10km. Every day, we produce more than 100 terabytes of data, and we archive something like half a petabyte per day. The size of the archive is growing very quickly, because of what we are doing now, not because of what we had in the past.”
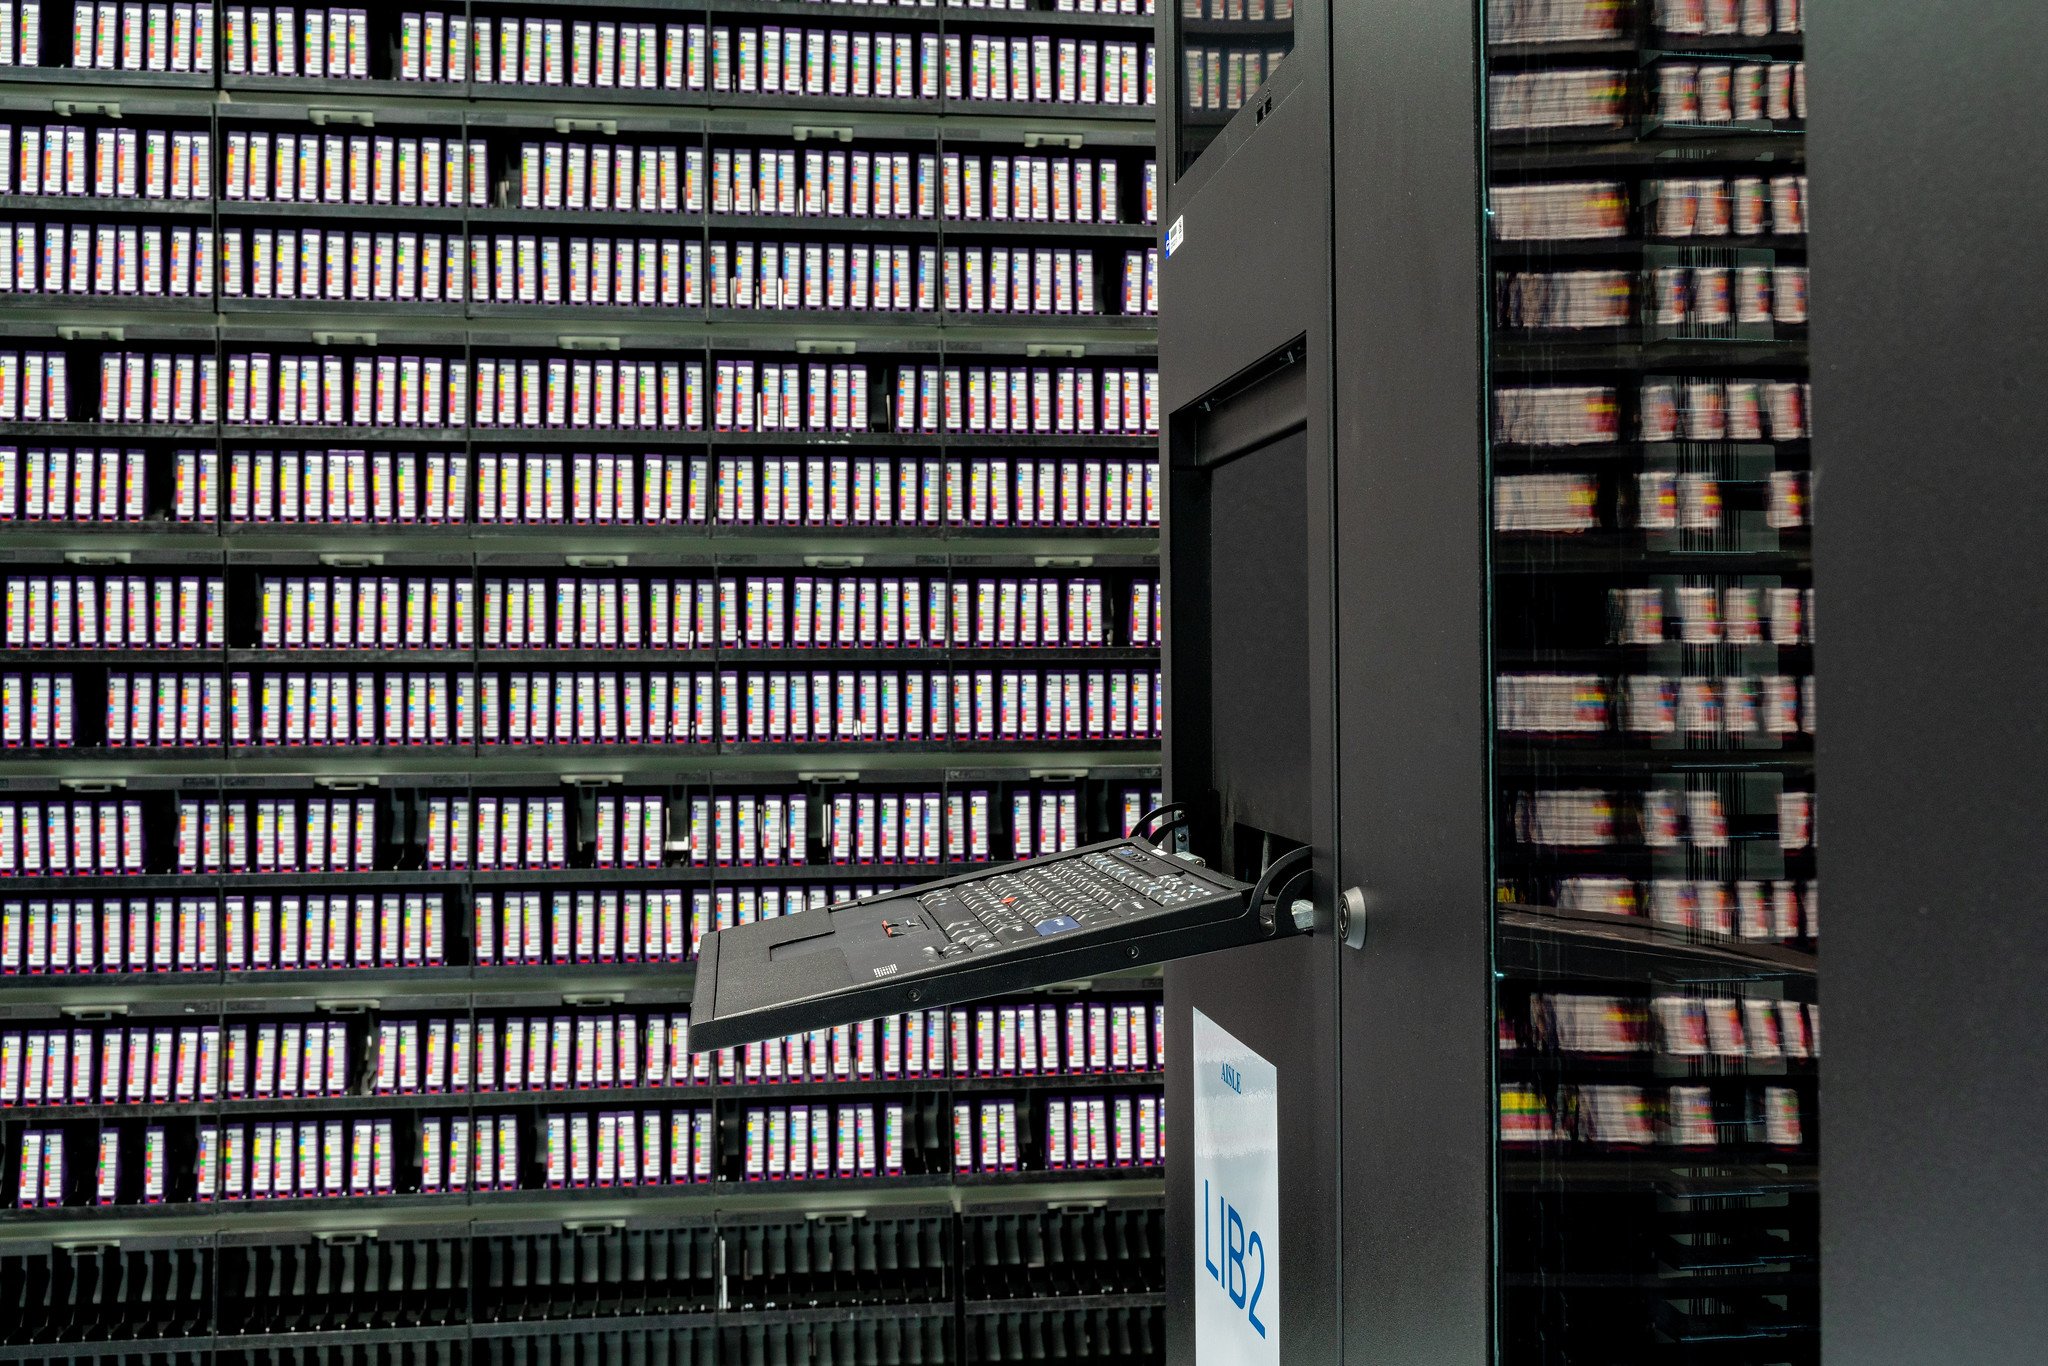
The vast majority of that data is stored on-premises using a distinctly old-school storage medium.
“Our archive is still mostly based on tapes,” Modigliani says. “We have a parallel file system. If you are accessing recent data, it will typically be from the disks for the supercomputer. If you were looking at trends in temperature somewhere over the last 20 years and need to see our operational forecasts for that period, then that is sitting on tapes which are then transferred to disks.”
Modigliani adds: “There is also a catalog accessible online. We handle something in the order of between half a million and a million requests per day from people.”
The use of tape storage is also the preferred method across the Atlantic ocean, at NOAA.
NOAA has a component dedicated to the archiving of data – the National Centers for Environmental Information (NCEI). “It’s important because as you get better computational technology and better model physics, you can go back and rerun models with past data and then use those to make sure that you are capturing extremes in different situations,” Michaud tells DCD.
While also using tape for much of its storage, the solution comes with its own challenges. “If you’re storing on tape, which is an affordable solution, the tape densities and the tape technologies and the tape drives change over time, and then you’ve got to migrate all that onto the new technology. So, as the data is growing, the ability for technology to store that in a higher data density is growing as well,” he explains, adding that tape migration is an ever-ongoing process at NOAA, one which has been underway for decades.
NOAA has not, however, made a move to cloud storage, though Michaud notes that others in the industry are looking at that.
Cloud computing in the cloud
The UK’s Met Office notably signed a partnership with Microsoft in April 2021 that would see the two collaborating on a new supercomputer.
It would be incorrect to describe the supercomputer as “based in the public cloud,” however. As previously reported by DCD, the supercomputer is actually housed in a dedicated supercomputing facility within a Microsoft cloud data center in the UK.
“Microsoft is hosting the multiple supercomputers underlying this service in dedicated halls within Microsoft data centers that have been designed and optimized for these supercomputers, rather than generic cloud hosting,” Microsoft told us in a 2022 statement.
“This includes power, cooling, and networking configurations tuned to the needs of the program, including energy efficiency and operational resilience. Thus, the supercomputers are hosted within a ‘dedicated’ Microsoft supercomputing facility for this project.”
The solution holds its own storage capabilities, but can also leverage offerings available from Microsoft cloud.
Amazon Web Services’ (AWS) general manager of advanced computing Ian Colle, argues firmly in favor of doing weather forecast modeling in the cloud.
During the AWS Re:Invent 2024 conference, Colle told DCD about a particular client – MAXAR – which uses AWS for just that purpose and, Colle claimed, to great effect.
“They (MAXAR) take the data set from the National Weather Service, and they can actually get their model out before the National Weather Service does because they can fan out on the flexible resources on AWS as opposed to what NOAA has to do with their fixed on-premises cluster,” says Colle.
Colle notes that it is reliable enough that this is a big part of their business value, with MAXAR customers then able to use the weather report to look at commodities and investments.
According to Colle, MAXAR is doing this work at the same level or greater fidelity as NOAA, in less time.
The convergence of cloud computing and meteorological data can also, to an extent, be seen in the work of ECMWF. Under the ECMWF umbrella lies the European Weather Cloud (EWC).
The EWC became fully operational in September of 2023 and describes itself as a “hub for the meteorological community in ECMWF and EUMETSAT member and co-operating states, so that users from different countries and organizations can be brought together to collaborate and share resources.”
The EWC, Modigliani explains, is hosted in ECMWF’s data center – the same as its supercomputer – but is a “physically separate system.” It is connected to the archive, and the supercomputer via an internal network.
“The data we produce on a daily basis was also one of the main reasons for having this cloud service so we could offer more flexibility on the sort of application you could run,” he says. “We wanted to have that system on-premise, because of the amount of data, in principle, that users could access. We discussed using a public cloud provider, but if you want to use the 100 terabytes produced daily, that would need to be transferred, which isn’t really feasible.”
The cloud offering also gives users more flexibility.
It is not only the ECMWF using its supercomputer for forecasting – member state users can also access it. However, the HPC system is managed by ECMWF, and “users don’t have a lot of flexibility on what kind of applications they can deploy on the system.”
“The idea is that they get their own infrastructure [on EWC]. We create tenancies where they have their own virtual machines (VMs). At the moment, the basic service is VMs, but there are some also running Kubernetes clusters and then, if the user wants, we can manage things at an infrastructure-as-a-service” level.
“Some of the workloads just can’t be done on an HPC. For example, creating a web-based service that they can provide access to someone else, that couldn’t run on an HPC. So, for us, the EWC is more like a compliment to the main HPC to facilitate applications that were not there before,” says Modigliani.
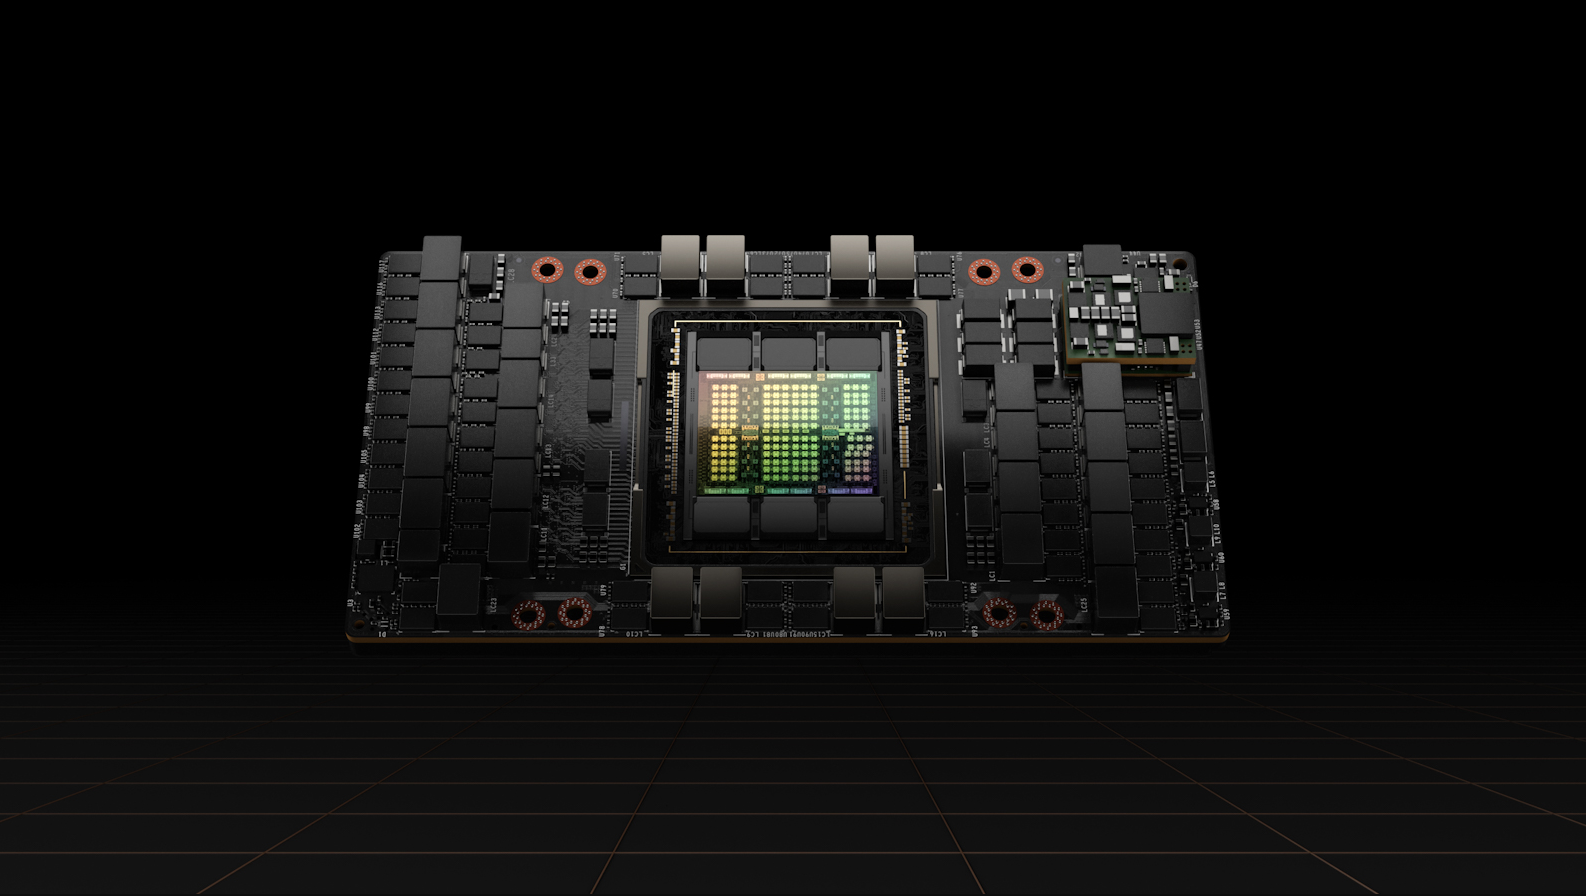
Another stark difference is the makeup of the hardware. The ECMWF’s HPC system is mostly CPU-based, with only a relatively small segment utilizing GPUs. The EWC operates on both CPUs and GPUs, which Modigliani says is down to demand for GPUs “particularly in the last couple of years,” with the growth of AI systems making the accelerators harder to come by.
GPUs and AI models
Met Éireann’s UWC-West supercomputer is solely CPU-based. Met Éireann’s Hally says the procurement for that system started in 2019 or 2020 and, at that time, AI and weather forecasting “weren’t really the big topic they are now.”
This focus on CPUs for weather is due to the fact that numerical models used for weather forecasting are not designed with GPUs in mind.
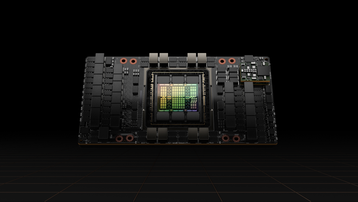
“The traditional weather modeling code – the actual computer code – was written originally to work on CPUs in terms of the way it was parallelized and sent to individual processors, but there are ongoing efforts to change the code so it can be used on GPUs because that is the way the industry is going and where the technology is going,” says Hally.
ECMWF is similarly working on making its code work for GPUs.
“The problem is that the model that we are using – the integrated forecasting system (IFS) – is a physics-based model,” says Modigliani. “Firstly, it is mostly written in [programming language] Fortran at the moment. It has been developed over the last 20 years or so, and it certainly has more than one million lines of code.
“It’s a large bit of code with a lot of different components, and in practice, you need to rewrite the whole of it. It’s not an effort that you achieve in a small amount of time.”
The ECMWF has been doing some testing on GPUs – with Modigliani citing the Destination Earth project as an example, which has access to EuroHPC resources including the Lumi, Leonardo, and MareNostrum 5 supercomputers in Europe – but the performance thus far hasn’t radically improved: “there isn’t really an advantage for us.”
“There are some areas that could benefit from the use of GPUs, but we still need to improve the GPU version of the model by at least a factor of five.”
The winds are certainly blowing in the direction of GPUs. In September, NOAA announced a $100 million grant from the Bipartisan Infrastructure Law and Inflation Reduction Act, which will be used for the procurement of a new supercomputer dubbed Rhea. Rhea will be equipped with an unspecified amount of GPUs and, according to NOAA, will be used to “strengthen NOAA’s exploration and application of artificial intelligence and machine learning capabilities.”
As put by Met Éireann’s Hally, the outlook is “rapidly changing.” He says: “Every couple of months, I read a new scientific article about an advancement in AI and weather forecasting.”
Notably, this December, Google announced that its DeepMind research lab had developed a ‘GenCast’ AI weather prediction model that it claims outperforms traditional methods on forecasts up to 15 days. This “marks something of an inflection point in the advance of AI for weather prediction,” Ilan Price, a Google DeepMind research scientist, said in a statement.
Hally adds that, once a model is trained, the number of GPUs needed to run it is much smaller. “It can also be deployed on very simple hardware and architecture, meaning you can make models available to those in developing countries that don’t have as much access to high-performance computing and they can then do their own simulations for their own targeted area.”
What remains a certainty, is that the pursuit of more compute will not reach an endpoint any time soon.
“I don’t see an end to it,” says Michaud. “In all seriousness, we’ve been doing this for a long time, and I think what will end up happening is that scientists and researchers will have to prioritize the balance of resolution increase, complexity, and certainty.
“You may choose to deal with better data simulation and not do as much with the model, or you may do less simulation and increase complexity in the model.”
This sentiment was reiterated by Modigliani. “It’s very difficult for us and other organizations to say ‘let’s take a break and wait a few years.’ The goal is always to provide the most useful forecast.”
TV presenters looking to avoid their own “Michael Fish moment” will certainly be grateful for the extra help.
This feature appeared in Issue 55 of the DCD Magazine. Read it for free today.


Read the orginal article: https://www.datacenterdynamics.com/en/analysis/frosty-with-a-chance-of-gpus/


