From a founder perspective, getting your pitch deck right is a crucial part of the fundraising process. Docsend reports that on average, a seed fundraise involves around 50 meetings — and VCs typically spend only 2m 12s reading your deck. What’s more, the time investors spend analysing a pitch deck has dropped every year since 2021, so standing out is harder than ever.
At Episode 1, we’ve received roughly 7,000 pitch decks since we started backing seed companies in 2014. That’s three new decks a day, every day, for 10 years.
And we wondered: could we use this dataset to work out a formula for what the perfect pitch deck looks like? Is there a right set of slides, words, phrases and figures that can maximise a founder’s chances of raising funding? To answer this, we carried out what we believe to be the most in-depth pitch deck analysis in European venture to date.
Firstly, we anonymised the data by removing company and founder names. We then used computer vision to extract every word and key phrase in all 7,000 decks. The final step was to label each deck with a 0 or 1 depending on whether they were successful in raising capital (we used Crunchbase/PitchBook/Dealroom data for this part).
Matching company names is hard to perfectly automate, so to guarantee data accuracy, we labelled each deck by hand. This took several months, but the results were worth it. Below, we’ve summarised some of our key findings.
What your pitch deck should (and shouldn’t) include
- Sell the team, not the tax benefits. Decks mentioning tax benefits (for example SEIS/EIS in the UK) consistently found it harder to raise. The best decks sell the quality of the team, the product and the market; overemphasising personal financial benefits is a negative signal.
- ‘Why now?’ References to recent industry shifts was a good predictor of success. Investors are always highly conscious of the “why now?” question; i.e. why is now the right time to build this company.
- Longer decks aren’t better. There was no correlation between the length of the deck and the chances of raising. Ditch the appendix. Remember you have just over two minutes to capture the attention of the investor. A lot of the text won’t be read. Keep it short and sweet.
- Demonstrate clear value-add. Decks explicitly highlighting time savings or cost savings were considerably more likely to raise. GTM feasibility is a key factor that VCs look for. A product with tangible, easily quantifiable value-add is easier to sell, and hence easier to raise money for.
- Get into the numbers. A breakdown of unit economics in a pitch deck was also a good predictor of fundraising success. Investors want to see the financial viability of your product and a long-term route to profitability. As a corollary, decks that discussed pricing strategy were 30% more likely to raise.
- Start with the customer. Market sizing is the most common reason we pass on deals at E1, and most of our VC peers are in the same boat. Decks calculating bottom-up market size (ie. starting with the customer, not the macro economics of the industry) were more likely to raise capital.
- Figure out your runway. Decks showing runway calculations had a significantly higher chance of raising. Many startups aren’t able to properly articulate why they need to raise, for example, $3m and not $1m. A bigger raise usually leads to a higher valuation, so investors want to know what their money will be spent on and whether the valuation is justified.
To quantify this more tangibly, we extended the above analysis to create 36 unique, proprietary ‘sub-scores’ related to the presence or absence of key phrases, slides and metrics in a given deck. We then used a simple gradient descent algorithm to work out the optimal weighting of each sub-score. These were all combined to give each of the 7,000 decks a single, overall ‘quality’ score. The higher the score, the more likely the deck is to raise capital.
Seed → Series A
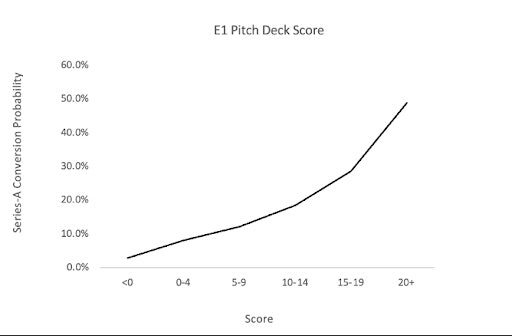
At Episode 1, a key metric we optimise for is how likely a seed investment is to raise future Series A financing. On average, this figure is around 20% for European seed-stage startups. We were curious to see how our pitch deck score correlated with the chances of a company raising Series A financing. Our results are shown below (noting that we only looked at decks received before 2021 to allow companies sufficient time for growth).

Companies with the highest pitch deck score (20+) were almost 15x more likely to convert to Series A as companies with the lowest score (<0). Whilst we don’t explicitly use our pitch deck model to make investment decisions, every deck we receive is scored using this proprietary in-house tool, leading to more efficient prioritisation of investor time.
At some point we hope to release this model as an open-source tool that founders can use to optimise the quality of their pitch deck. Will this lead to ‘gaming’ of the model? Perhaps. But we think the community benefits far outweigh the costs.
Read the orginal article: https://sifted.eu/articles/pitch-deck-do-dont/


